Round Price Levels MT5
- Indicatori
-
Robert Gerald Wood
 Sviluppatore di software professionista da oltre 25 anni, ora costruisce strumenti per me stesso e li condivide con la comunità più ampia.
 - Versione: 1.10
- Aggiornato: 23 febbraio 2026
- Attivazioni: 10
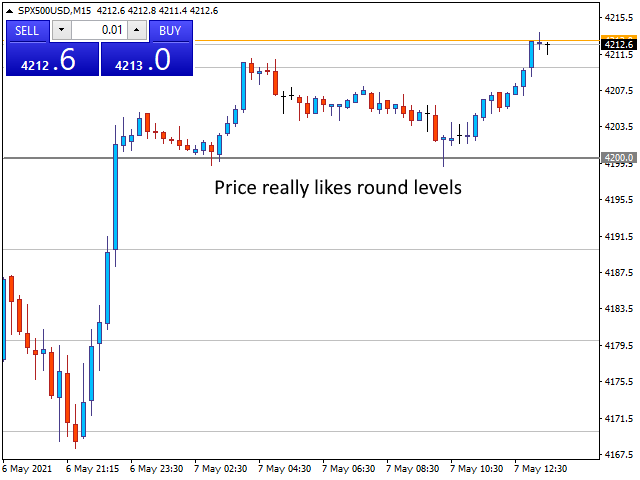
I mercati amano davvero i numeri tondi e spesso fungono da supporto in un mercato in calo o da resistenza quando il prezzo sale.
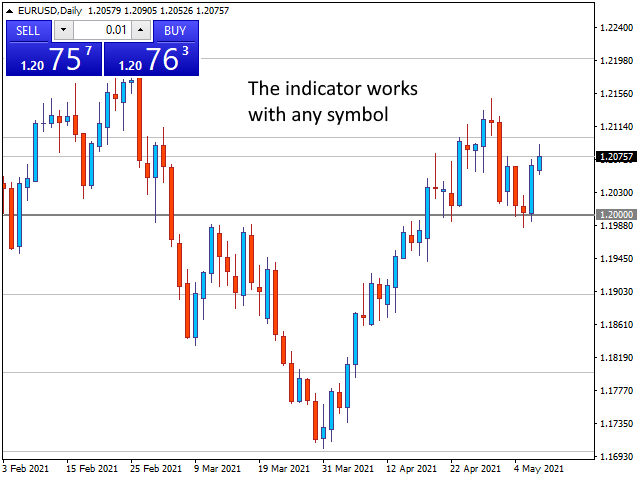
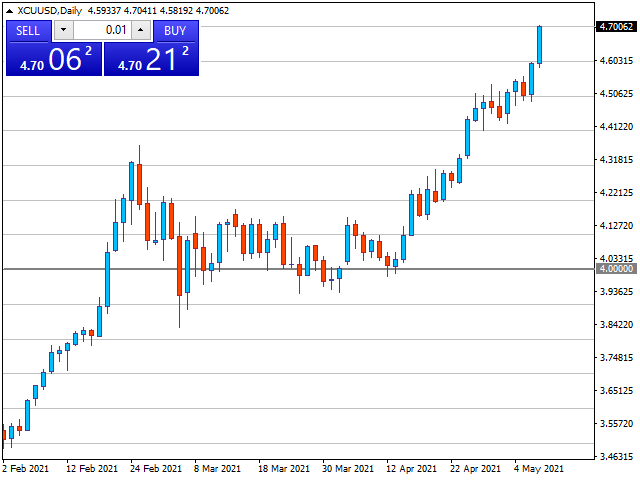
Questo indicatore è progettato per disegnare livelli di prezzo a valori Round. Lo fa automaticamente, ma hai anche la possibilità di ignorarlo e determinare i livelli che desideri vedere.
Un livello rotondo può essere semplice come passaggi di 10, quindi 10, 20, 30 ecc. o se stai lavorando con il Forex, forse vuoi vedere i cambiamenti a 0.1 o 0.01.
L'indicatore disegna due classi di linea, Maggiore e Minore, ciascuna con un formato diverso. Ciò consente di vedere i cambiamenti tra due diversi cambi di livello contemporaneamente.
Allerta
L'indicatore include la possibilità di emettere avvisi a livello di prezzo Maggiore, Minore o entrambi quando il prezzo rientra in una distanza configurabile.
Installazione automatica
Per impostazione predefinita, l'indicatore determinerà un livello appropriato sia per i prezzi principali che per quelli secondari. Lo fa utilizzando un'impostazione DensityIndex configurabile che controlla quante linee vuoi vedere sullo schermo in qualsiasi momento.
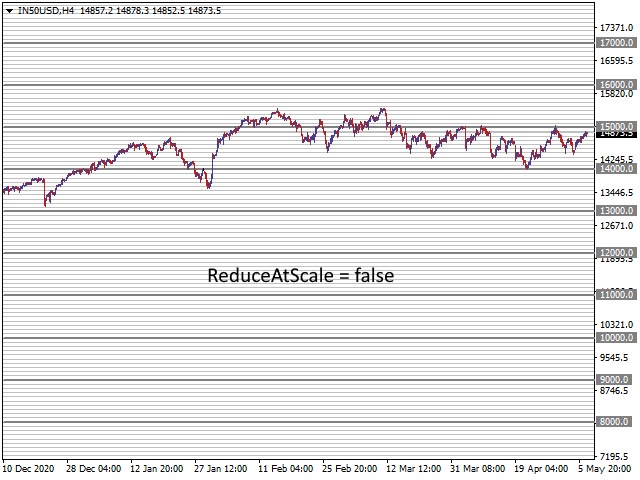
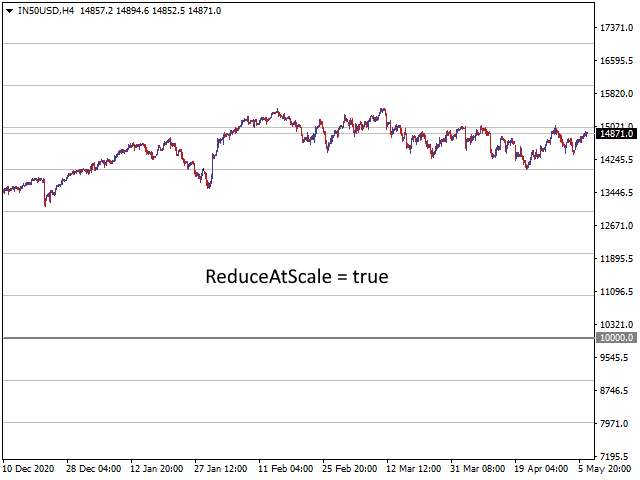
Se si imposta il proprio ridimensionamento, utilizzando le impostazioni MajorGap e MinorGap, è comunque possibile ottenere che l'indicatore limiti il numero di linee disegnate sullo schermo utilizzando l'impostazione ReduceAtScale.
Si prega di vedere gli screenshot per avere un'idea più chiara di questa funzione.
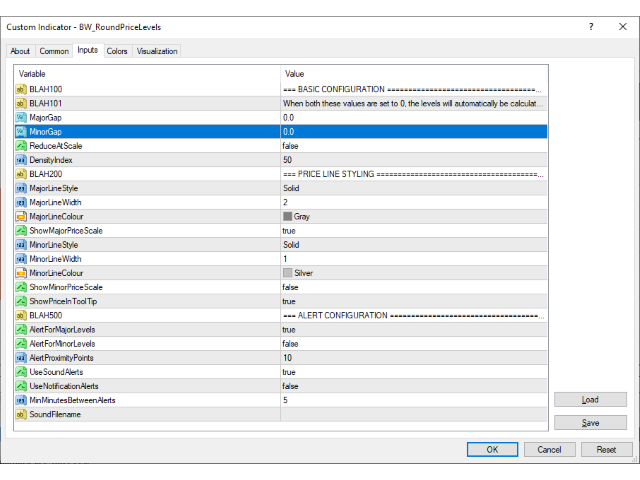
IMPOSTAZIONI
CONFIGURAZIONE BASE
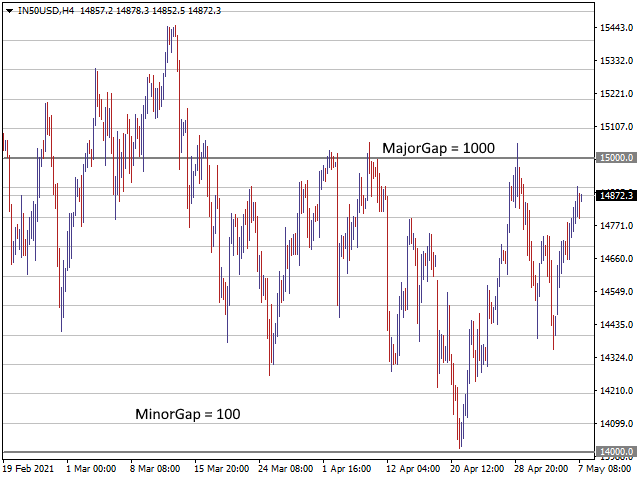
MajorGap
Se impostato su 0.0, l'indicatore calcolerà automaticamente una scala appropriata
MinorGap
Se impostato su 0.0, l'indicatore calcolerà automaticamente una scala appropriata
Riduci in scala
Se vero, l'indicatore terrà conto della scala del grafico e ridurrà il numero di livelli tracciati se necessario.
DensitàIndice
Numero massimo di valori secondari prima del ridimensionamento automatico.
STILE DELLA LINEA DI PREZZO
MajorLineStyle
Lo stile della linea da disegnare, continua, punteggiata, tratteggiata. Selezionare dall'elenco dei valori supportati dal sistema.
MajorLineWidth
La larghezza della linea da disegnare. Se si desidera utilizzare uno stile diverso da SOLID, questo valore deve essere uguale a 1.
MajorLineColor
Il colore per tracciare la linea.
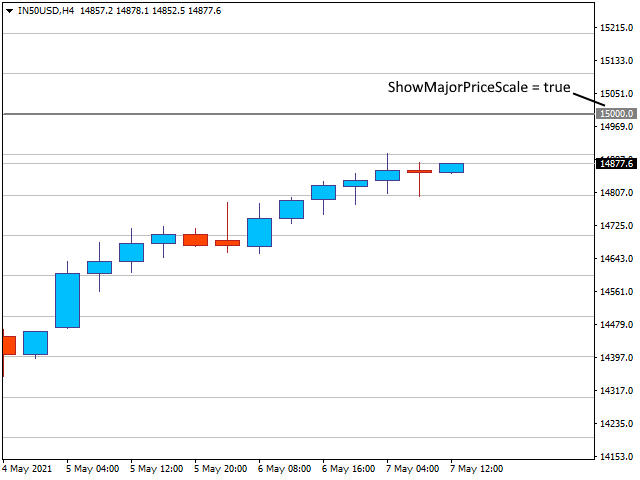
MostraMajorPriceScale
Quando vero, i livelli di prezzo principali saranno evidenziati nella scala dei prezzi a destra del grafico.
MinorLineStyle
Lo stile della linea da disegnare, continua, punteggiata, tratteggiata. Selezionare dall'elenco dei valori supportati dal sistema.
MinorLineWidth
La larghezza della linea da disegnare. Se si desidera utilizzare uno stile diverso da SOLID, questo valore deve essere uguale a 1.
MinorLineColor
Il colore per tracciare la linea.
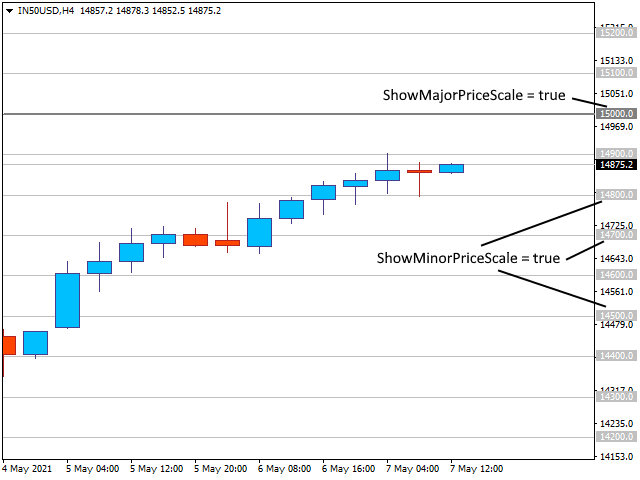
MostraScalaPrezzoMinore
Quando vero, i livelli di prezzo minori saranno evidenziati nella scala dei prezzi a destra del grafico.
ShowPriceInToolTip
Se vero, il valore del prezzo della linea verrà mostrato come suggerimento quando il cursore del mouse passa sopra di esso. Utile se hai disattivato le scale prezzi.
CONFIGURAZIONE ALLARME
AlertForMajorLevels
Quando vero, genera avvisi per la vicinanza del prezzo ai livelli di prezzo principali
AlertForMinorLevels
Quando vero, genera avvisi per la vicinanza del prezzo a livelli di prezzo minori
AlertProximityPoints
Quanto deve essere vicino il prezzo corrente a un livello per attivare un avviso. L'avviso viene generato se il prezzo corrente è all'interno dei punti AlertProximityPoints di un livello.
Usa avvisi sonori
Emetti un suono quando viene attivato un avviso.
Usa avvisi di notifica
Invia una notifica utilizzando il sistema di notifiche MT4 quando viene attivato un avviso. Vedere il menu principale Strumenti > Opzioni, quindi selezionare la scheda Notifiche e configurare lì. Avrai anche bisogno dell'app Apple o Android.
MinMinutesBetweenAlerts
Dopo aver attivato un avviso, il sistema attenderà questo numero di minuti prima di consentire l'attivazione di un altro avviso.
Nome file audio
È integrato un suono di avviso, ma se desideri utilizzarne uno diverso, puoi specificare qui il nome del file. I file devono trovarsi nella cartella MQL/Files del terminale.