Continuous Bars Ind
- Indicators
- Version: 1.1
- Updated: 22 March 2020
- Activations: 5
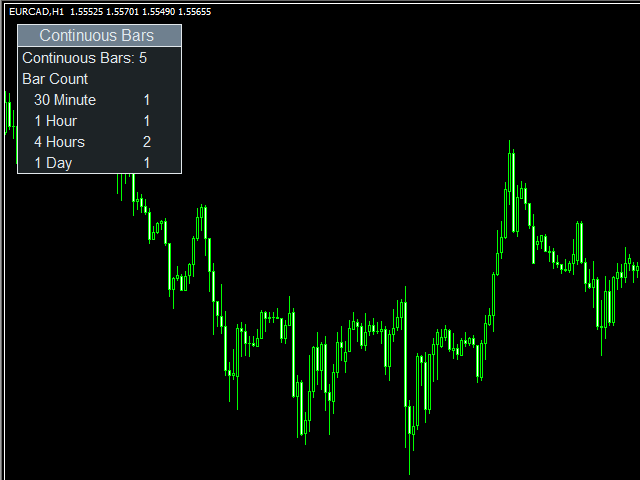
Continuous Bars indicator is used to track the continuous bars closed in one direction.
For example:
Continuous Bars = 3 (we are looking for 3 continuous bars)
Now, if (Open > Close) or (Close > Open) for 3 continuous bars it is notified via email or alert.
You can hide all the information displayed in the chart by setting false to Show On Chart.
Indicator Settings:
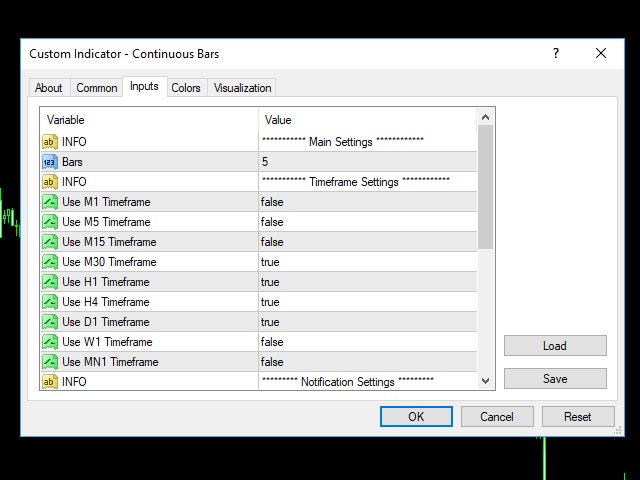
Main Setting
- Bars: Number of continuous bars we are looking
Price Setting
- Use M1 Timeframe: Look for continuous bars in M1 timeframe
- Use M5 Timeframe: Look for continuous bars in M5 timeframe
- Use M15 Timeframe: Look for continuous bars in M15 timeframe
- Use M30 Timeframe: Look for continuous bars in M30 timeframe
- Use H1 Timeframe: Look for continuous bars in H1 timeframe
- Use H4 Timeframe: Look for continuous bars in H4 timeframe
- Use W1 Timeframe: Look for continuous bars in W1 timeframe
- Use MN1 Timeframe: Look for continuous bars in MN1 timeframe
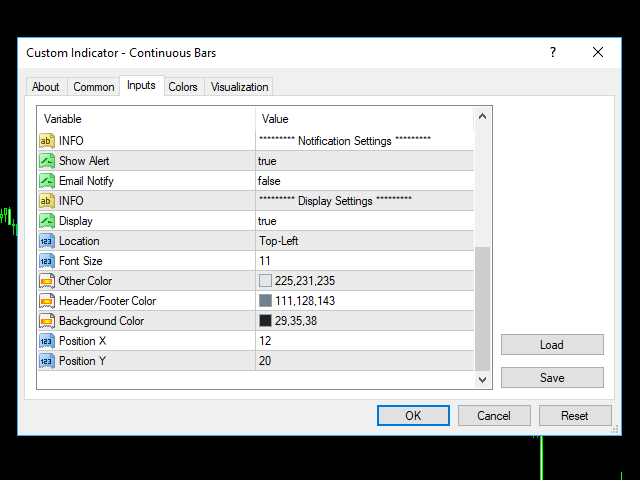
Notification Setting
- Show Alert: Show alert box
- Email Notify: Send an email
Display Setting
- Display: Shows the indicator information on chart
- Location: Location of the display window
- Top-Left: Display all the details in top-left place
- Bottom-Left: Display all the details in bottom-left place
- Font Size: Size of the font
- Other Color: General Color
- Header/Footer Color: Header and footer color of display window
- Background Color: Background color of display window
- Position X: X-axis position of display window
- Position Y: Y-axis position of display window