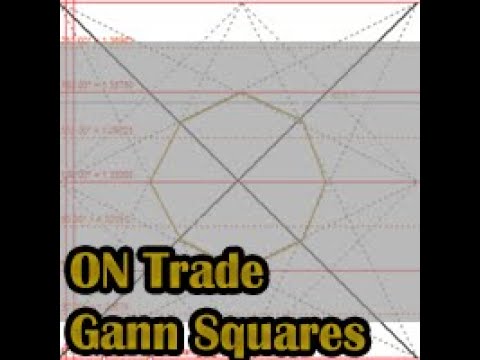
ON Trade Gann Squares
- Indicators
- Version: 1.3
- Updated: 27 May 2024
- Activations: 5

Download user manual from :
MT5 Version :
https://www.mql5.com/en/market/product/30284
Gann Squares Indicator: Analyzing Markets with Geometric Patterns
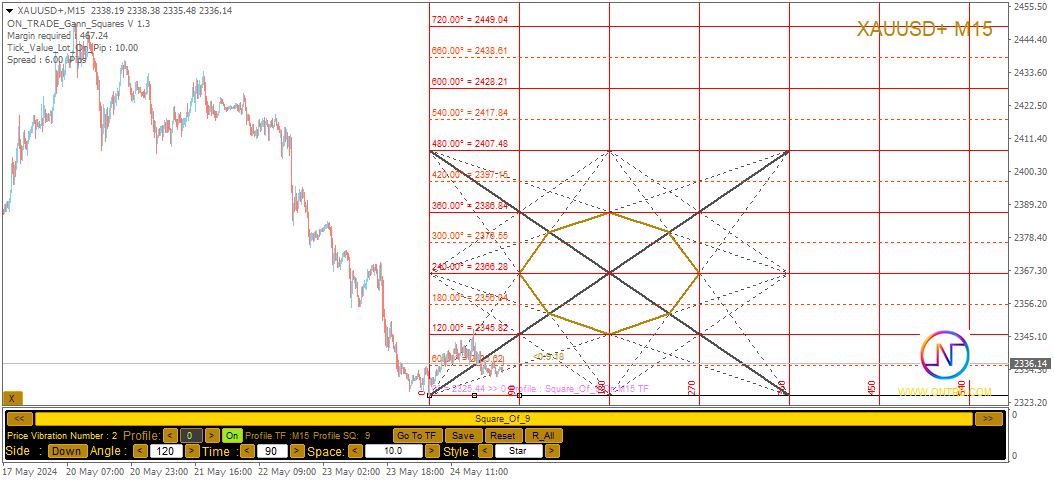
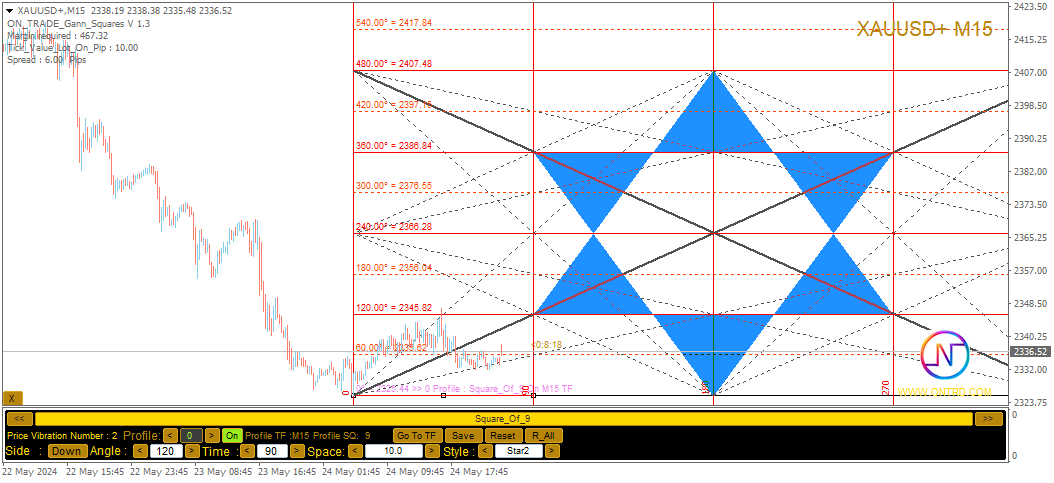
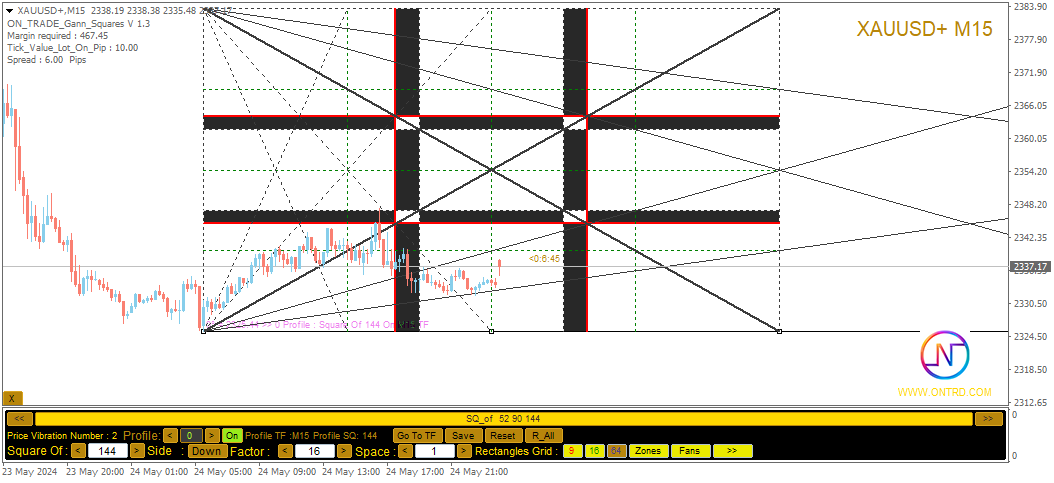
The Gann Squares indicator is a powerful tool for market analysis that draws upon the mathematical concepts introduced by W.D. Gann in his article on "Mathematical Formula for Market Predictions." This indicator incorporates Gann's techniques involving square numbers such as 144, 90, and 52, as well as the Square of 9. Additionally, it incorporates method for utilizing the Square of 9 in conjunction with channels and the star pattern.
User Manual and Usage:
Before using this indicator, we encourage you to read the user manual and contact us for any clarifications. You can find the full user manual on our website.
The indicator offers both a full MT5 version for purchase and a free version for testing on MT4. Links for both versions are provided for your convenience.
Key Features and Functionality:
The Gann Squares indicator brings a comprehensive set of tools to your trading environment, allowing you to make informed decisions based on geometric patterns and Gann's concepts. Here are the key features:
-
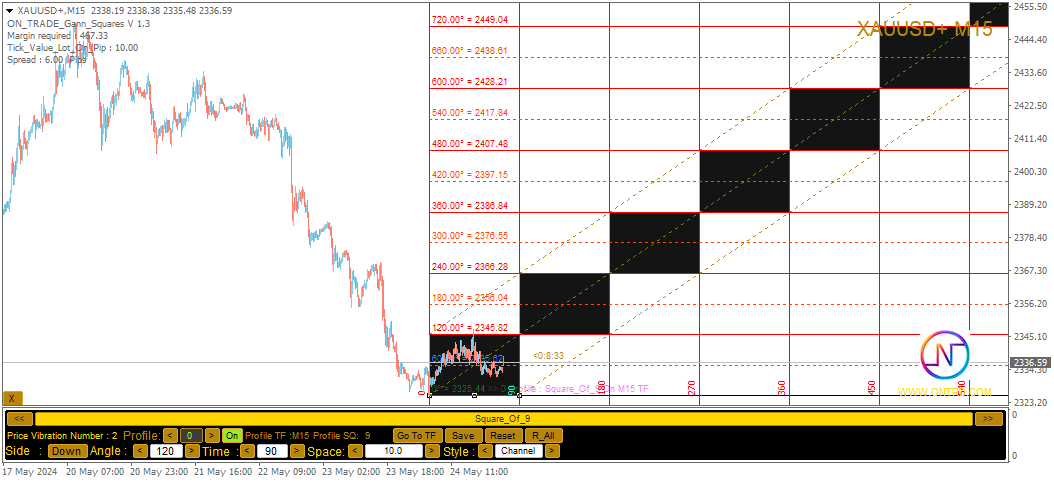
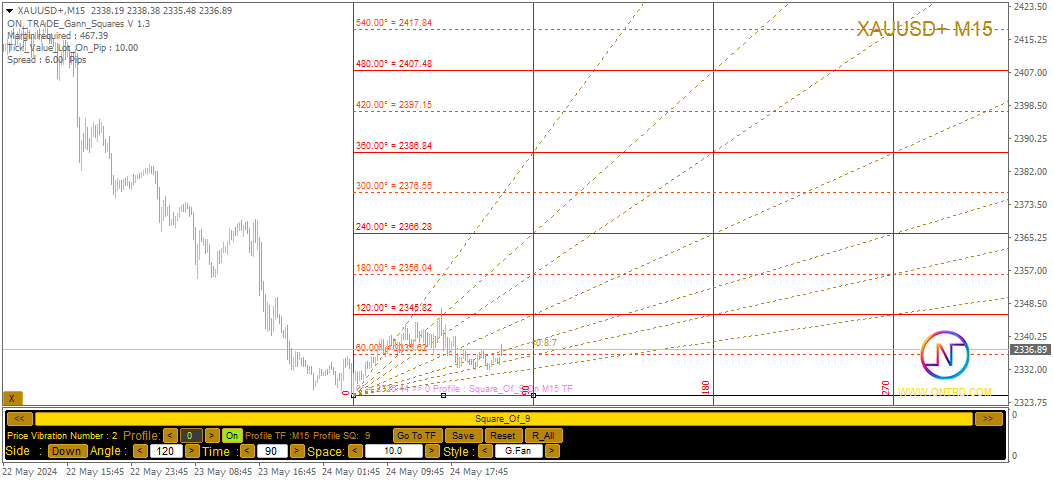
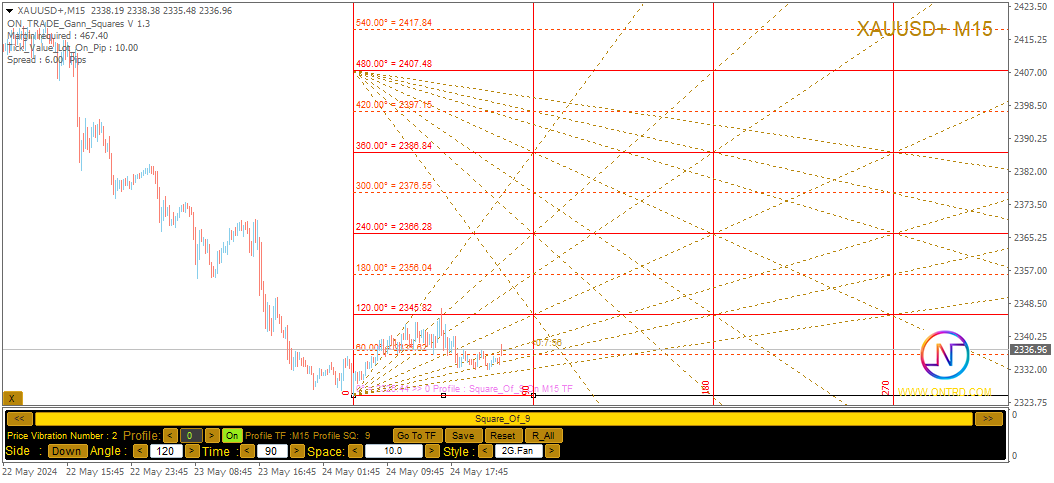
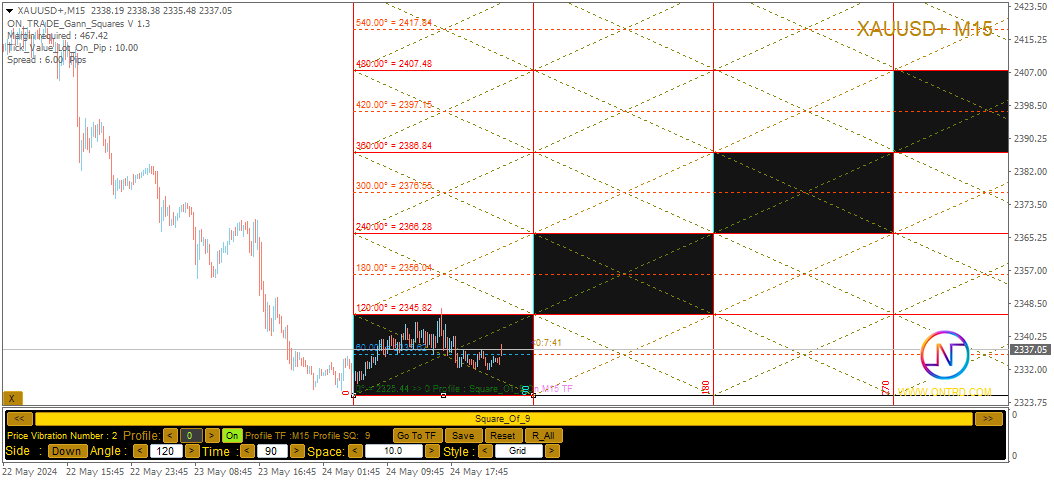
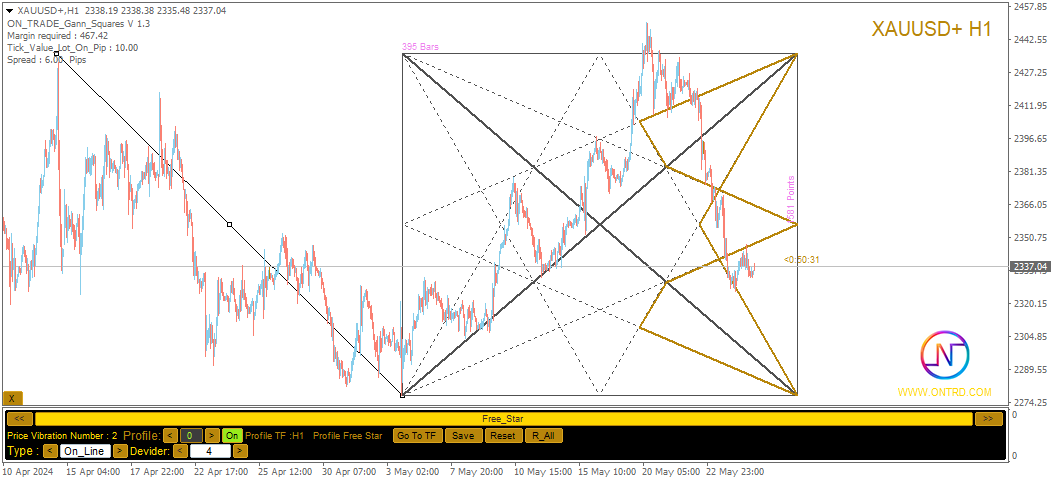
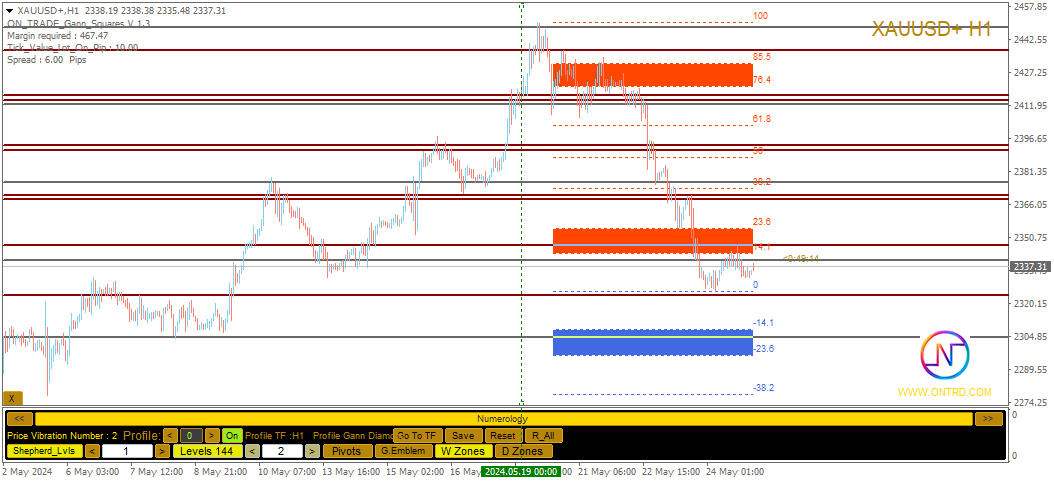
Square of 9 Analysis: The indicator can draw various elements related to the Square of 9, including levels, stars, grids, Gann fans, and more. This provides a visual representation of Gann's geometrical concepts on your chart.
-
Gann Squares: The indicator draws Gann Squares of 52, 90, and 144, allowing you to visualize and analyze their relationships with price movements.
-
Free Gann Star: The indicator enables the drawing of a movable Gann Star directly on the chart, providing a dynamic tool for identifying potential trend changes or reversals.
-
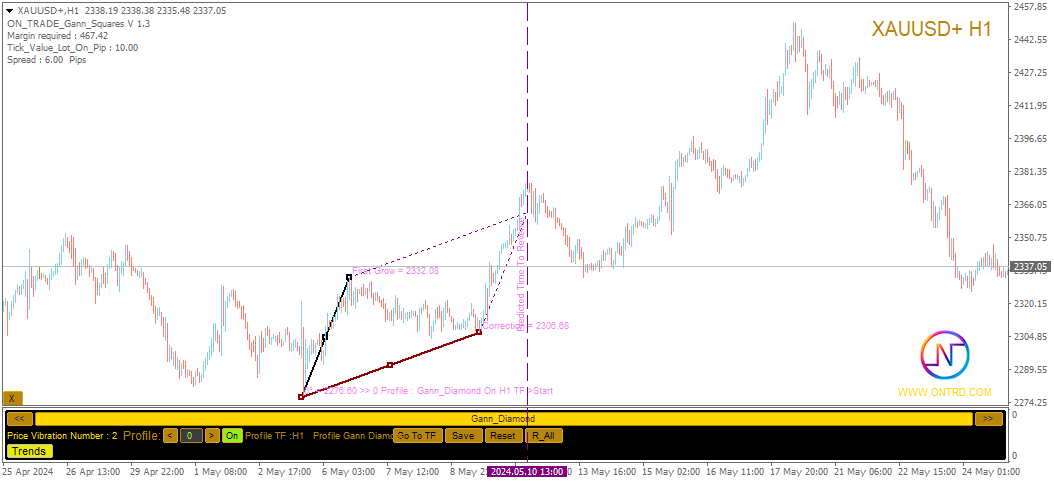
Gann Diamond: In addition to other elements, the indicator also includes the ability to draw Gann Diamonds, enhancing your ability to spot unique patterns.
-
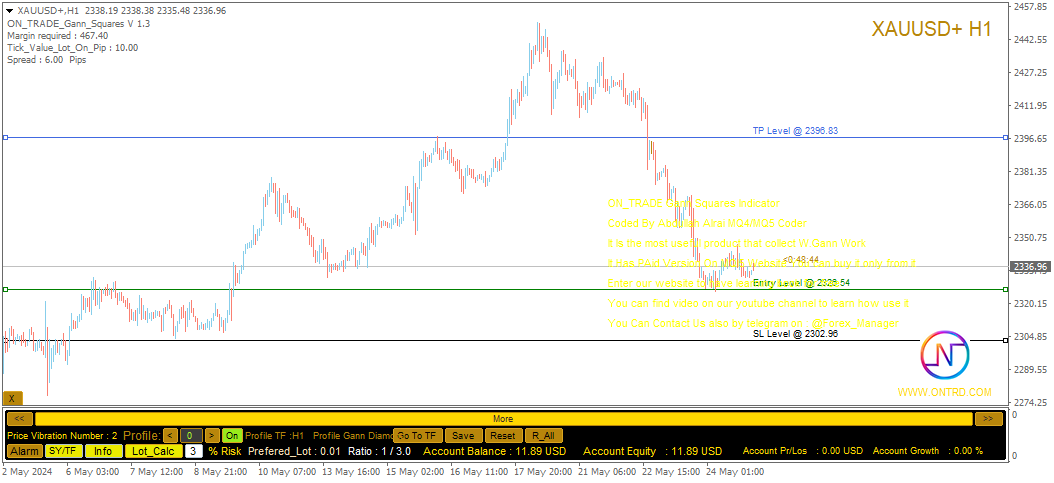
Lot Calculator: The indicator includes a lot calculator that assists you in determining the optimal lot size for your trades.
-
User-Friendly Panel: The indicator comes with a user-friendly panel that allows you to switch between various tools, including Square of 144/90/52, Square of 9, Gann Free Star, Gann Diamond, Numerology tools, Lot calculator, and account information.
-
Data Management: All your work with the indicator is saved on your trading profile, giving you the flexibility to load or unload it at any time. You can also reset your saved data with the press of a button.
Customization and Parameters:
The Gann Squares indicator provides various parameters to customize its appearance and behavior according to your preferences. You can adjust colors, styles, widths, and other settings for different elements such as angles, squares, stars, channels, and levels.
Conclusion:
The Gann Squares indicator serves as a versatile tool for traders interested in Gann analysis and numerology. By incorporating Gann's mathematical principles and geometric patterns, this indicator enhances your ability to identify potential trading opportunities and make well-informed decisions. To maximize the benefits of this indicator, we recommend watching our instructional video and reading the provided PDF resources on our website.
As with any trading tool, understanding how to use the indicator effectively, practicing with historical data, and staying updated with real-time market conditions will contribute to your success. Remember to practice responsible risk management alongside the use of any trading indicator or strategy.