Pivot Point Calculator Ind

Contact us for any custom order, CodeYourTrade.com.

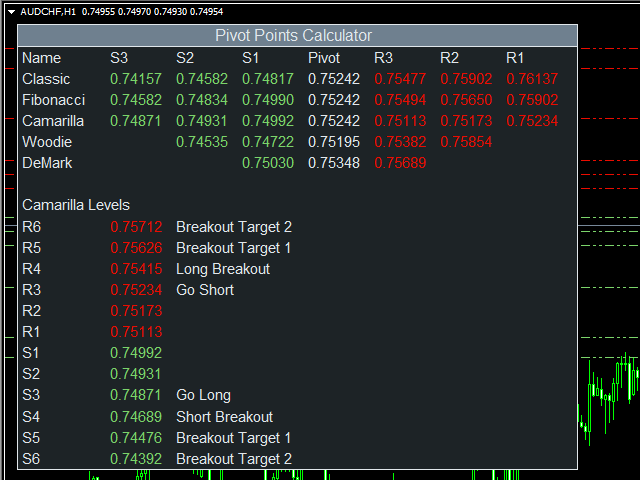
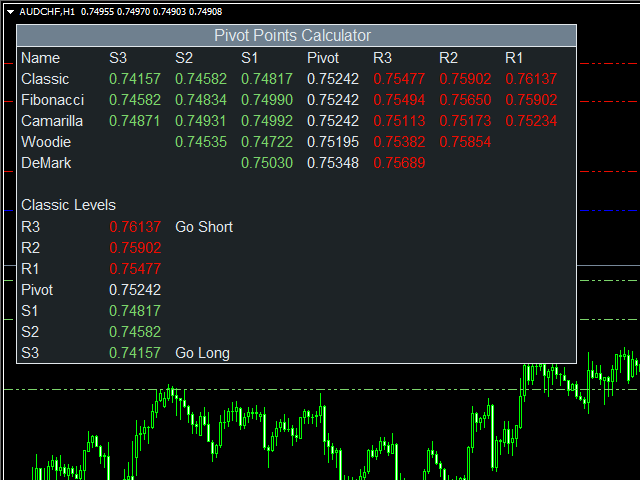
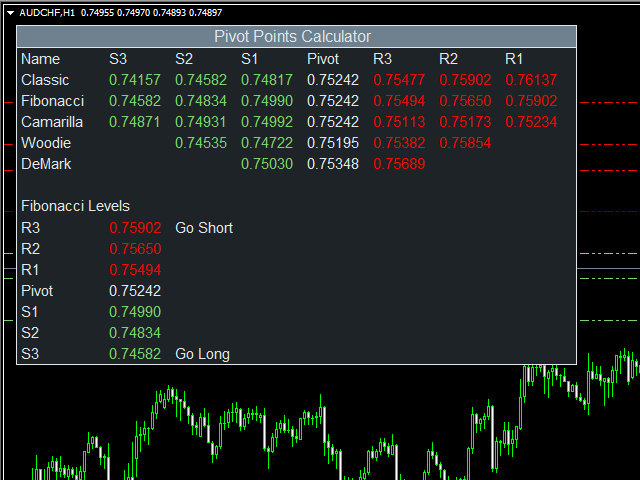
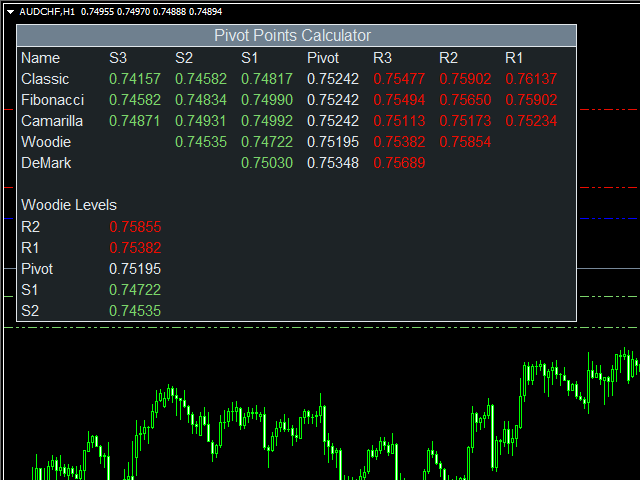
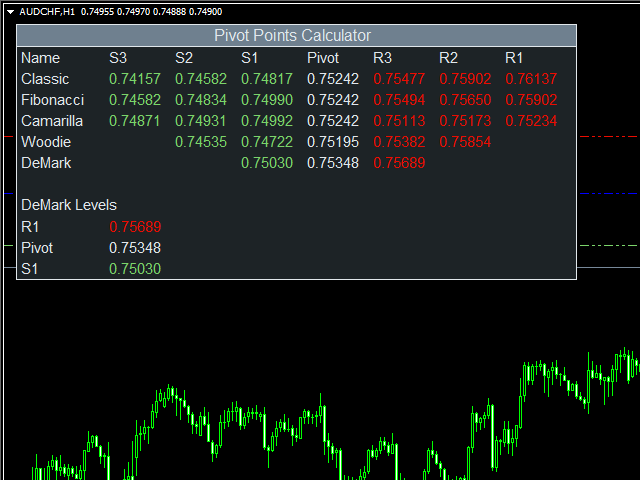
This indicator is used to calculate the pivot points using 5 different methods:

  1. Classic
  2. Fibonacci
  3. Camarilla
  4. Woodie
  5. DeMark

After you attached the indicator to a chart it will show the following information on the chart:

  1. Pivot points levels of the current chart using different methods.
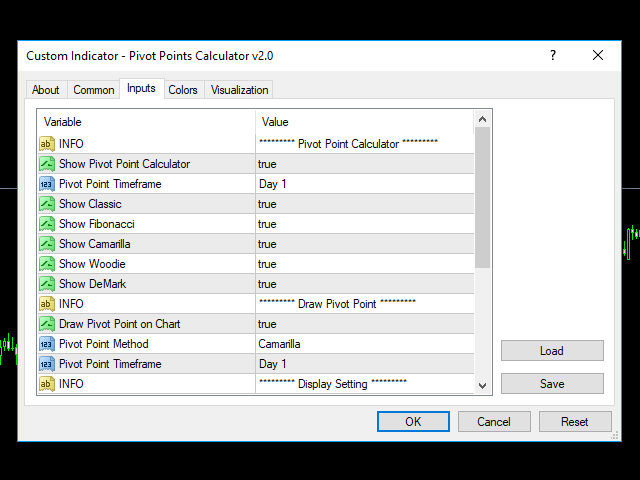
Indicator Setting

Pivot Point Calculator

  • Show Pivot Point Calculator: Show all pivot points on chart
  • Pivot Points Timeframe: It tells which time is used to calculate pivot points
  • Show Classic: Show classic levels
  • Show Fibonacci: Show fibonacci levels
  • Show Camarilla: Show camarilla levels
  • Show Woodie: Show woodie levels
  • Show DeMark: Show demark levels

Draw Pivot Point

  • Draw Pivot Point on Chart
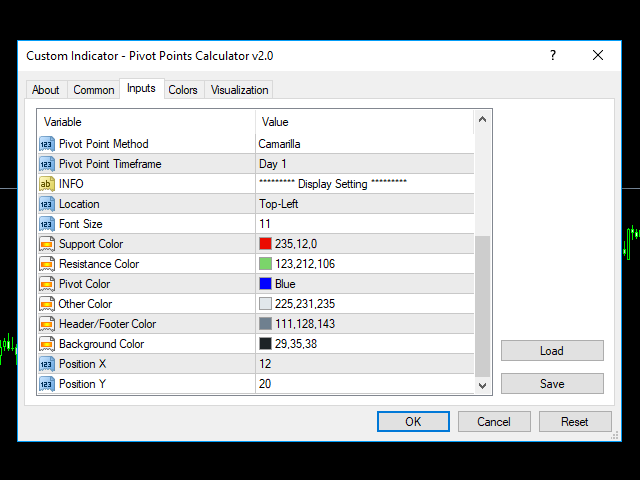
  • Pivot Point Method: Which method is used to draw on charts
    • Classic
    • Fibonacci
    • Camarilla
    • Woodie
    • DeMark
  • Pivot Point Timeframe: It tells which time is used to calculate pivot points

Display Setting

  • Display: Shows the indicator information on chart
  • Location: Location of the display window
    • Top-Left: Display all the details in top-left place
    • Bottom-Left: Display all the details in bottom-left place
  • Font Size: Size of the font
  • Support Color: Color of resistance
  • Resistance Color: Color of support
  • Pivot Color: Color of the pivot point
  • Other Color: General Color
  • Header/Footer Color: Header and footer color of display window
  • Background Color: Background color of display window
  • Position X: X-axis position of display window
  • Position Y: Y-axis position of display window

Recommended products
The Auto Super Pivot indicator is an indicator designed to calculate support points and resistance points for pivot points. this indicator has the ability to calculate standard pivot, fibonacci, camarilla, woodie and demark pivot points. It also allows you to use all time zones with the time frame feature. Another feature of the indicator is the auto time slice feature. This feature allows automatic calculations without having to set any time zone. Features 6 different pivot calculation modes A
Auto AndrewFork
Noor Ghani Rahman
1 (1)
Auto Pitchfork Indicator The indicator calculate the Pitch fork for the previous Day (Selectable) with multiple Support and Resistance lines from the Median price which acts as Magnet for the Price that if price touch the above warning (1) or below warning (1) lines and not cross up or down then there is maximum possibilities that it will return to the Median Line, and thus maintain the Price Action in Cyclic Pattern to the Market Move. You are able to select how many warning lines you want to k
Possible Price reversals levels - based on  Fibonacci + Support +  Resistance Levels Auto levels drawn based on input index (Bars Count )  ---->>> Price Over 50% Fibo line ---> UP TREND ---> BUY when price drop near Support Lines  ---->>> Price Down 50% Fibo line ---> DOWN TREND ---> SELL when price goes up  near Resistance Lines  --->>> The more close price levels ----> the more possibility for price reversals --->>> are you a scalper --> try it on M1 charts with big index like 5000 bars  or
The   Pivot Point indicator   automatically calculates and displays the pivot point line and support and resistance levels. Pivot can be calculated according to the Classic, Floor, Fibonacci, Woodie, Camarilla or DeMark formula. It is also possible to select the period for calculating the indicator. A trader can choose from daily, weekly, monthly, or user-defined periods. Types of pivots Classic Floor Fibonacci Woodie Camarilla DeMark Main features The indicator shows the current and historic
FREE
Fibonacci Wave Bands Indicator The Fibonacci Wave Bands indicator utilizes Fibonacci ratios to create dynamic bands around a central moving average. These bands are derived from key Fibonacci ratios (typically 38.2%, 50%, 61.8%) and adapt to market volatility, offering insights into potential support and resistance zones. Key Features: Fibonacci Levels: The indicator plots multiple bands above and below a central moving average based on Fibonacci ratios. Dynamic Support and Resistance: Bands ser
SWING TRADE CONCEPT WHAT IS IT FOR? An MT4 indicator designed for swing trading. It captures trend reversals using SuperTrend logic and displays TP points with automatic Fibonacci levels. HOW DOES IT WORK? 1. Trend Tracking Uses an ATR-based SuperTrend algorithm. It signals when the price trend breaks. 2. Signal Generation Trend reverses upward → Green BUY box + arrow (below the candle) Trend reverses downward → Red SELL box + arrow (above the candle) 3. Fibonacci Targets Automatically
DMS Fibo
Diogo Mitsunaga Dos Santos
Fibonacci retracements are trend lines drawn between two significant points, usually between absolute lows and absolute highs, plotted on a chart. Intersecting horizontal lines are placed at the Fibonacci levels. Fibonacci retracements are useful tools that help traders identify support and resistance levels. With the information gathered, they can place orders, identify stop-loss levels, and set price targets. Although useful, traders often use other indicators to make more accurate assessments
mql5 version:  https://www.mql5.com/en/market/product/44815 Simple indicator to calculate profit on fibonacci retracement levels with fixed lot size, or calculate lot size on fibonacci levels with fixed profit. Add to chart and move trend line to set the fibonacci retracement levels. Works similar as default fibonacci retracement line study in Metatrader. Inputs Fixed - select what value will be fix, lot or profit Fixed value - value that will be fix on all levels Levels - levels for which to ca
Smart Trendlines
Suvashish Halder
5 (1)
Smart Trendlines – No.1 Trendlines Indicator Smart Trendlines is a precision tool that automatically draws trendlines based on every valid pivot point, helping traders identify key support and resistance zones. It continuously adjusts as new market pivots form, providing a live and accurate reflection of price structure. Whether you’re tracking trends, preparing for reversals, or anticipating breakouts — this indicator keeps you one step ahead. It works seamlessly across all assets including For
Pivot Points MT4
KEENBASE SOFTWARE SOLUTIONS
KT Pivot Points automatically plots the daily, weekly, and monthly pivot levels on a chart with the precise calculation based on the latest data. Pivot points is a widely used indicator in technical analysis, particularly in the Forex market. Features Send alerts when the price touches the pivot level.  It offers complete customization for each kind of pivot level.   Shows daily, weekly, and monthly pivot levels without any fuss. It uses minimum CPU resources for faster calculation. Compatible
KT Auto Trendline MT4
KEENBASE SOFTWARE SOLUTIONS
KT Auto Trendline draws the upper and lower trendlines automatically using the last two significant swing highs/lows. Trendline anchor points are found by plotting the ZigZag over X number of bars. Features No guesswork requires. It instantly draws the notable trendlines without any uncertainty. Each trendline is extended with its corresponding rays, which helps determine the area of breakout/reversal. It can draw two separate upper and lower trendlines simultaneously. It works on all timeframe
Raymond Cloudy Day Indicator for MT4 – Pivot-Based Reversal and Trend Levels Raymond Cloudy Day Indicator is a pivot-based level indicator for MetaTrader 4 (MT4). It was developed by Ngo The Hung based on Raymond’s original idea and is designed to give a structured view of potential reversal zones, trend extensions and support/resistance levels directly on the chart. The default settings are optimised for XAUUSD on the H1 timeframe, but the indicator can be tested and adjusted for other symbols
VaviStar is an indicator based on trend retracements determined by ZigZag segments. It is theorized, and statistics confirm, that stocks react to certain retracement levels. Many use Fibonacci retracement levels (23.6%, 38.2%, 61.8%). It is assumed that once the price goes beyond the 61.8% retracement, we can already speak of a trend reversal. This indicator allows you to comfortably chart a segment of the ZigZag with the relative operating levels chosen. With a reversal mindset , you can use it
MultiFiboDynamicMT4 is a powerful, professional indicator for estimating the most important support and resistance levels. The main advantage is that it plots the Fibonacci levels at all timeframes simultaneously, which allows the trader to see the full picture of the possible price movement of the trading instrument! Advantages of the indicator The indicator is perfect for scalping and trading binary options. Suitable for beginners and experienced traders. Works on all timeframes. Works on any
FREE
FiboZag
Andriy Sydoruk
Indicator FiboZag - transfer the indicator to the chart and the Fibonacci levels will be built automatically on the last ZigZag turn. The main advantage lies in the correct construction of Fibonacci levels and markup of price levels. Simple, visual and effective use. The indicator is not redrawn and does not lag. Works on all currency pairs and on all timeframes.
The price is moving between two curve tunnel lines in a trend. The two lines of a tunnel represent support and resistance. In an uptrend, for instance, a trade might be entered at the support of the trend line (shown by the red line in the chart) and exited at resistance of the upper tunnel line (shown by the blue line). Tunnel show trend direction for any timeframe (if you have enough bars on the chart for higher timeframes). Trend, or price tunnel, can be up, down or sideways. If the current p
Simple supply and demand indicator which should help identify and visualize S&D zones. Settings: Color for supply zones, color for demand zones - default colors are set for dark (black) background. Number of how much zones should be created above and below current price - value "3" means there will be 3 zones above current price and 3 zones below current price. Principle: When price creates "V", reversal zone is registered. Rectangle filled based on zone type (supply / demand) is drawn if price
Classic Fractals indicator for MT4, with additional Trendlines connecting the latest couples of fractals ( fractals are showing highest high, and lowest low on each period) Rules for trendlines: -if new top fractal is below the last one = new resistance line -if new bot fractal is above the last one = new support line -Trendlines can be hidden -Fractals can be hidden Fractal Period = can be both even or uneven number, as it is setting for half (one side) of the bars sequence for findin
BeST_ Classic Pivot Points is an MT4 Indicator that is based on the widely known and definitely classic Pivot Point of a market prices activity. A pivot point is calculated as an average of significant prices (high,low,close) from the performance of a market in the prior trading period. If the market in the following period trades above the pivot point it is usually evaluated as a bullish sentiment, whereas trading below the pivot point is seen as bearish. A pivot point and the associated suppo
FREE
Dynamic Color Fibonacci Indicator This tool is designed to automate the process of drawing and updating Fibonacci levels on your chart. It automatically adjusts to market trends, providing clear visual cues and alerts to help you analyze price movements. Key Features Adaptive Colors: The Fibonacci lines automatically change color to reflect the current trend. They appear blue during uptrends and red during downtrends, giving you an immediate visual sense of the market direction without manual a
AutoPivot
Hafis Mohamed Yacine
This indicator will draw monthly, weekly, and daily pivot. Pivot line will be calculated automatically again when the period ends. Auto Pivot Metatrader 4 Indicator The Auto Pivot indicator for Metatrader 4 automatically updates the pivot point (PP), support (S1,S2,S3) and resistance levels (r1,r2,r3) every day. Price above the pivot point means positive while price below the pivot point means negative. S3 indicates extremely oversold while price above resistance r3 means extremely overbought.
Introduction to Support Resistance Indicator Support and Resistance are the important price levels to watch out during intraday market. These price levels are often tested before development of new trend or often stop the existing trend causing trend reversal at this point. Highly precise support and resistance are indispensable for experienced traders. Many typical trading strategies like breakout or trend reversal can be played well around these support and resistance levels. The Precision Sup
VR Pivot
Vladimir Pastushak
VR Pivot is an indicator of key pivot points. Pivot points are a special type of support and resistance levels that are used to determine the strongest price zones. Professional traders use pivot levels to determine prices at which there is a high probability of a price reversal. The levels are calculated using special mathematical formulas, which include the closing, opening, high, and low prices of the previous time period. The most effective is the daily period. It is important to note that a
Color fibonacci levels
DMITRII KOLOSOV
5 (5)
Индикатор пригодится тем, кто использует кластеры Фибоначчи в торговле и применяет построения с разными наборами уровней. Каждый набор уровней применителен как к уровням Retracement , так и к Expansion (выбирается в настройках). Уровни задаются перечислением в формате "0;50;61.8;100". Настройки индикатора: Fibonacci #1 – Набор уровней #1 Fibonacci – Тип уровней : Retracement или Expansion Levels – Набор уровней в формате "0;23.6;38.2;50;61.8;100" Color line – Цвет линии Style line – Стиль линии
FREE
Fibonacci Of Yesterday
Thushara Dissanayake
As a forex trader, you understand the power of the Fibonacci trading strategy in technical analysis. However, manually drawing and adjusting Fibonacci levels can be time consuming. That's where the Fibonacci Of Yesterday EA comes in to save you valuable time. It's designed specifically for trading using the Fibonacci strategy based on the previous day's price action, this innovative tool automates the identification of entry, stop loss, and take profit levels based on Fibonacci levels. This aut
Strong Pivot trend indicator is a trend indicator that uses standard pivot calculation and some indicators. The purpose of the indicator is to calculate the possible trends using the pivot point. And to give the user an idea about trend direction. You can use this indicator as a trend indicator. Or with other indicators suitable for your strategy. Features The blue bar represents the upward trend. The yellow bar represents the downward trend. The blue pivot point represents the upward trend. T
Pivot Trend
Harun Celik
5 (2)
Pivot trend indicator is a trend indicator that uses standard pivot calculation and some indicators. The purpose of the indicator is to calculate the possible trends using the pivot point. And to give the user an idea about trend direction. You can use this display as a trend indicator. Or with other indicators suitable for your strategy. Features The green bar represents the upward trend. The red bar represents the downward trend. The blue pivot point represents the upward trend. The yellow pi
YK-Fibo Pivot Indicator: Trade Smarter with Fibonacci Pivot Points The YK-Fibo Pivot Indicator is a powerful technical analysis tool that combines the precision of Fibonacci retracements with the insights of Pivot Points. Whether you're a novice or seasoned trader, this indicator empowers you to spot profitable opportunities in the market with ease. Why Choose YK-Fibo Pivot? Pinpoint Support & Resistance: By calculating Fibonacci levels based on the previous day's high, low, and close prices, y
Данная утилита (эксперт который сам не открывает ордера) ищет на графике паттерны Price Action : DBLHC и DBHLC Рельсы CPR Пин-бар HR PPR TBH и TBL OB где каждый паттерн имеет гибкие настройки того, как он должен выглядеть по Вашему мнению. К примеру, возьмём пин-бар, который имеет так называемый нос а также левый и правый глаз. Так вот в настройках Вы можете указать минимальную длину этого самого носа, максимальный размер самого тела и хвоста, и минимальный размер левого глаза, по отношению
Buyers of this product also purchase
Gann Made Easy
Oleg Rodin
4.82 (148)
Gann Made Easy is a professional and easy to use Forex trading system which is based on the best principles of trading using the theory of W.D. Gann. The indicator provides accurate BUY and SELL signals including Stop Loss and Take Profit levels. You can trade even on the go using PUSH notifications. PLEASE CONTACT ME AFTER PURCHASE TO GET TRADING TIPS, BONUSES  AND GANN MADE EASY EA ASSISTANT  FOR FREE! Probably you already heard about the Gann trading methods before. Usually the Gann theory is
M1 Sniper
Oleg Rodin
4.89 (18)
M1 SNIPER is an easy to use trading indicator system. It is an arrow indicator which is designed for M1 time frame. The indicator can be used as a standalone system for scalping on M1 time frame and it can be used as a part of your existing trading system. Though this trading system was designed specifically for trading on M1, it still can be used with other time frames too. Originally I designed this method for trading XAUUSD and BTCUSD. But I find this method helpful in trading other markets a
Game Changer Indicator
Vasiliy Strukov
5 (7)
Game Changer is a revolutionary trend indicator designed to be used on any financial instrument to transform your metatrader in a powerful trend analyzer.  The indicator does not redraw and does not lag.  It works on any time frame and assists in trend identification, signals potential reversals, serves as a trailing stop mechanism, and provides real-time alerts for prompt market responses.  Whether you’re a seasoned, professional or a beginner seeking an edge, this tool empowers you to trade wi
Meravith
Ivan Stefanov
5 (1)
Market makers' tool. The indicator analyzes volume from every point and calculates exhaustion market levels for that volume. ( This is a manual indicator and contains features that may not supported by the MetaTrader current testing environment ) Meravith main lines: - Bullish volume exhaustion line   - serves as a target. - Bearish volume exhaustion line   - serve as a target. -   A line indicating the market trend. It changes color depending on whether the market is bullish or bearish and s
Scalper Inside PRO
Alexey Minkov
4.74 (69)
An exclusive indicator that utilizes an innovative algorithm to swiftly and accurately determine the market trend. The indicator automatically calculates opening, closing, and profit levels, providing detailed trading statistics. With these features, you can choose the most appropriate trading instrument for the current market conditions. Additionally, you can easily integrate your own arrow indicators into Scalper Inside Pro to quickly evaluate their statistics and profitability. Scalper Inside
Year-End Trading SALE – Save 50% While It Lasts! Best Solution for any Newbie or Expert Trader! This dashboard software is working on 28 currency pairs plus one. It is based on 2 of our main indicators (Advanced Currency Strength 28 and Advanced Currency Impulse). It gives a great overview of the entire Forex market plus Gold or 1 indices. It shows Advanced Currency Strength values, currency speed of movement and signals for 28 Forex pairs in all (9) timeframes. Imagine how your trading will imp
Currency Strength Exotics
Bernhard Schweigert
4.88 (33)
CURRENTLY 20% OFF ! Best Solution for any Newbie or Expert Trader! This Indicator is specialized to show currency strength for any symbols like Exotic Pairs Commodities, Indexes or Futures. Is first of its kind, any symbol can be added to the 9th line to show true currency strength of Gold, Silver, Oil, DAX, US30, MXN, TRY, CNH etc. This is a unique, high quality and affordable trading tool because we have incorporated a number of proprietary features and a new formula. Imagine how your trading
Advanced Supply Demand
Bernhard Schweigert
4.91 (296)
Year-End Trading SALE – Save 50% While It Lasts! Best Solution for any Newbie or Expert Trader! This indicator is a unique, high quality and affordable trading tool because we have incorporated a number of proprietary features and a new formula. With this update, you will be able to show double timeframe zones. You will not only be able to show a higher TF but to show both, the chart TF, PLUS the higher TF: SHOWING NESTED ZONES. All Supply Demand traders will love it. :) Important Information Re
Trend indicator AI
Ramil Minniakhmetov
5 (74)
Trend Ai indicator is great tool that will enhance a trader’s market analysis by combining trend identification with actionable entry points and reversal alerts.  This indicator empowers users to navigate the complexities of the forex market with confidence and precision Beyond the primary signals, Trend Ai indicator identifies secondary entry points that arise during pullbacks or retracements, enabling traders to capitalize on price corrections within the established trend. Important Advantage
M1 Arrow
Oleg Rodin
5 (19)
M1 Arrow is an indicator which is based on natural trading principles of the market which include volatility and volume analysis. The indicator can be used with any time frame and forex pair. One easy to use parameter in the indicator will allow you to adapt the signals to any forex pair and time frame you want to trade. The Arrows DO NOT REPAINT and DO NOT LAG! The algorithm is based on the analysis of volumes and price waves using additional filters. The intelligent algorithm of the indicator
New Update of Smart Trend Trading System MT5 For  2026 Market: If You Buy this Indicator you will Get my Professional   Trade Manager + EA  for   FREE . First of all Its worth emphasizing here that this Trading System is   Non-Repainting   , Non Redrawing and Non Lagging Indicator   Which makes it ideal from both manual and robot trading .  [Online course] ,   [manual]   and   [download presets] . The Smart Trend Trading System MT5 is a comprehensive trading solution tailored for   new   and   e
This indicator is an indicator for automatic wave analysis that is perfect for practical trading! Case... Note:   I am not used to the Western name for wave classification. Influenced by the naming habit of Chaos Theory (Chanzhongshuochan), I named the basic wave as   pen   , the secondary wave band as   segment   , and the segment with trend direction   as main trend segment   (this naming method will be used in future notes, let me tell you in advance), but the algorithm is not closely relat
PRO Renko System
Oleg Rodin
5 (29)
PRO Renko System is a highly accurate trading system specially designed for trading RENKO charts. The ARROWS and Trend Indicators DO NOT REPAINT! The system effectively neutralizes so called market noise giving you access to accurate reversal signals. The indicator is very easy to use and has only one parameter responsible for signal generation. You can easily adapt the tool to any trading instrument of your choice and the size of the renko bar. I am always ready to provide extra support to help
FX Power MT4 NG
Daniel Stein
4.95 (20)
FX Power: Analyze Currency Strength for Smarter Trading Decisions Overview FX Power is your go-to tool for understanding the real strength of currencies and Gold in any market condition. By identifying strong currencies to buy and weak ones to sell, FX Power simplifies trading decisions and uncovers high-probability opportunities. Whether you’re looking to follow trends or anticipate reversals using extreme delta values, this tool adapts seamlessly to your trading style. Don’t just trade—trade
SMC Easy Signal
Mohamed Hassan
4.73 (15)
3 copies left at $65, next price is $120 SMC Easy Signal was built to remove the confusion around the smart money concept by turning structural shifts like BOS (Break of Structure) and CHoCH (Change of Character) into simple buy and sell trading signals. It simplifies market structure trading by automatically identifying breakouts and reversals as they happen, allowing traders to focus on execution rather than analysis. Whether the market is continuing its trend or preparing to reverse, the i
Looking for a powerful yet lightweight swing detector that accurately identifies market structure turning points? Want clear, reliable buy and sell signals that work across any timeframe and any instrument? Buy Sell Arrow MT Swing is built exactly for that — precision swing detection made simple and effective. This indicator identifies Higher Highs (HH) , Higher Lows (HL) , Lower Highs (LH) , and Lower Lows (LL) with remarkable clarity. It is designed to help traders easily visualize market str
Dynamic Forex28 Navigator
Bernhard Schweigert
4.43 (7)
Specials Discount now. The Next Generation Forex Trading Tool. Dynamic Forex28 Navigator is the evolution of our long-time, popular indicators, combining the power of three into one: Advanced Currency Strength28 Indicator (695 reviews) + Advanced Currency IMPULSE with ALERT (520 reviews) + CS28 Combo Signals (recent Bonus) Details about the indicator  https://www.mql5.com/en/blogs/post/758844 What Does The Next-Generation Strength Indicator Offer? Everything you loved about the originals, now
ACB Breakout Arrows
KEENBASE SOFTWARE SOLUTIONS
4.15 (34)
The ACB Breakout Arrows indicator provides a crucial entry signal in the market by detecting a special breakout pattern. The indicator constantly scans the chart for a settling momentum in one direction and provide the accurate entry signal right before the major move.  Get multi-symbol and multi-timeframe scanner from here - Scanner for ACB Breakout Arrows MT4 Key features Stoploss and Take Profit levels are provided by the indicator. Comes with a MTF Scanner dashboard which tracks the breako
Currency Strength Wizard is a very powerful indicator that provides you with all-in-one solution for successful trading. The indicator calculates the power of this or that forex pair using the data of all currencies on multiple time frames. This data is represented in a form of easy to use currency index and currency power lines which you can use to see the power of this or that currency. All you need is attach the indicator to the chart you want to trade and the indicator will show you real str
Year-End Trading SALE – Save 50% While It Lasts! Best Solution for any Newbie or Expert Trader! This Indicator is a unique, high quality and affordable trading tool because we have incorporated a number of proprietary features and a new formula. With only ONE chart you can read Currency Strength for 28 Forex pairs! Imagine how your trading will improve because you are able to pinpoint the exact trigger point of a new trend or scalping opportunity? User manual: click here That's the first one, th
Trend Screener
STE S.S.COMPANY
4.79 (95)
Unlock the Power of Trends Trading with the Trend Screener Indicator: Your Ultimate Trend Trading Solution powered by Fuzzy Logic and Multi-Currencies System! Elevate your trading game with the Trend Screener, the revolutionary trend indicator designed to transform your Metatrader into a powerful Trend Analyzer. This comprehensive tool leverages fuzzy logic and integrates over 13 premium features and three trading strategies, offering unmatched precision and versatility. LIMITED TIME OFFER : Tre
SMC Blast Signal with FVG, BOS and trend Breakout The SMC Blast Signal  is a  Precise trading system for Meta Trader 4 that uses Smart Money Concepts (SMC) , including Fair Value Gaps (FVG) and Break of Structure (BOS) , to identify high-probability trades. It incorporates a Trend Filter using a higher timeframe moving average, ensuring trades align with the prevailing market trend. TREND SIGNAL-FVG DETECTION-BOS DETECTION-TRADE CONFIRMED-Precise Signal entries on m15  Best TF-M15 AND ABOVE Be
Day Trader Master is a complete trading system for traders who prefer intraday trading. The system consists of two indicators. The main indicator is the one which is represented by arrows of two colors for BUY and SELL signals. This is the indicator which you actually pay for. I provide the second indicator to my clients absolutely for free. This second indicator is actually a good trend filter indicator which works with any time frame. THE INDICATORS DO NOT REPAINT AND DO NOT LAG! The system is
Market Structure Break Out
Ashkan Hazegh Nikrou
5 (8)
Detect Indirection Break Out Signal with high success rate. Introduction to Market Structure Break Out (MSB) , this indicator is an advanced tool designed for both MT4 and MT5 platforms , helping traders view market movement through the lens of price structure. It identifies and highlights key trading signals using arrows and alerts, both in the direction of the trend and against it (reversal signals). One of its standout features is the ability to draw unbroken supply and demand zones , giving
Entry Points Pro
Yury Orlov
4.62 (172)
Top indicator for MT4 providing accurate signals to enter a trade without repainting! Watch  the video  (6:22) with an example of processing only one signal that paid off the indicator! It can be applied to any financial assets:  forex, cryptocurrencies, metals, stocks, indices.  MT5 version is here   It will provide pretty accurate trading signals and tell you when it's best to open a trade and close it. Most traders improve their trading results during the first trading week with the help of t
Hidden Cycles
Lev Vladimirovic Marushkin
5 (1)
Black Friday Sale – Limited Time! Grab Hidden Cycles for only $129 (regular price $179 ). This is your chance to boost your strategy with a powerful, easy-to-use cycle-based trading tool. Offer ends soon — don’t miss it! Based on Universal Laws — NOT Some Guy’s Algorithm: Let the market adjust to the Hidden Cycles Geometry — not the other way around. Most indicators are based on a man-made formula. They often lag, fail over time, or need constant re-optimization.  Hidden Cycles is different.
Adaptive Volatility Range [AVR] is a powerful tool for identifying key trend reversal points. AVR accurately reflects the Average True Range (ATR) of volatility, taking into account the Volume-Weighted Average Price (VWAP). The indicator adapts to any market volatility by calculating the average volatility over a specific period, ensuring a stable rate of profitable trades. You receive not just an indicator but a professional automated trading system , AVR-EA . Advantages: Automated Trading Sys
Advanced Currency IMPULSE with ALERT
Bernhard Schweigert
4.91 (489)
Year-End Trading SALE – Save 50% While It Lasts! Best Solution for any Newbie or Expert Trader! This indicator is a unique, high quality and affordable trading tool because we have incorporated a number of proprietary features and a secret formula. With only ONE chart it gives Alerts for all 28 currency pairs. Imagine how your trading will improve because you are able to pinpoint the exact trigger point of a new trend or scalping opportunity! Built on new underlying algorithms it makes it even e
Binary Trader Master is an arrow based indicator that predicts the close of the candle. It does its analysis within one candle only. When the candle opens it requires a few moments to make the analysis and predict the close of the candle. Then it generates a signal. The indicator also allows you to apply time limits that it can use for the analysis which means that you can actually tell the indicator how much time it is allowed to have for the analysis within the candle. The indicator monitors s
Royal Wave Pro M4
Vahidreza Heidar Gholami
5 (3)
Royal Wave is a Trend-Power oscillator which has been programmed to locate and signal low-risk entry and exit zones. Its core algorithm statistically analyzes the market and generates trading signals for overbought, oversold and low volatile areas. By using a well-designed alerting system, this indicator makes it easier to make proper decisions regarding where to enter and where to exit trades. Features Trend-Power Algorithm Low risk Entry Zones and Exit Zones Predictions for Overbought and Over
More from author
Contact us for any custom order,   CodeYourTrade.com . Channel Breakout indicator shows the channels based on the number of bars. It is used to trades the breakouts or reversals. Breakout is quite efficient, since it tries making profit when the market crashes!! You can also invent your own technique out of it. After you attach the indicator to a chart it will show the following information on the chart: 1.     Channel 1 and channel 2 information 2.     Alert and email information   You can hid
Contact us for any custom order,   CodeYourTrade.com . Candle Close Time indicator is used to track the time remaining or passed on a current candle at any point of time. To get notified set the time in format DD:HH:MM:SS. For example : EnableNotify = true & (Day Left : Hour Left : Minute Left : Second Left) = 00:02:20:20. Let’s say remaining time to close candle is 00:03:23:21 (DD:HH:MM:SS). Now, when the time remaining reaches below 00:02:20:20, it shows an Alert box. You can hide all the inf
Continuous Bars indicator is used to track the continuous bars closed in one direction. For example : Continuous Bars = 3 (we are looking for 3 continuous bars) Now, if (Open > Close) or (Close > Open) for 3 continuous bars it is notified via email or alert. You can hide all the information displayed in the chart by setting  false  to  Show On Chart . Indicator Settings: Main Setting Bars : Number of continuous bars we are looking Price Setting Use M1 Timeframe: Look for continuous bars in M1 ti
Contact us for any custom order,   CodeYourTrade.com . Currency Sessions Highlight indicator is used to highlight the sessions. The maximum number of sessions visible at a time is 3. A user has to input the input the start and end time of the session in the format HH:MM. You can hide all the information displayed in the chart by setting  false  to  Show On Chart . Indicator Settings: Main Setting Show Session 1 : Draw Session 1 on chart or not Session 1 Start : Start time of the session 1 Sessi
This indicator provides the technical overview using following tools: Pivot Points Technical Indicators Moving Averages Pivot Points are calculated using five different methods: Classic Fibonacci Camarilla Woodie DeMark With the technical indicator , you can find the trading signals using the combination of different indicators. It supports the following technical indicators: RSI Stochastic Stochastic RSI MACD ADX CCI ATR Ultimate Oscillator ROC Bull/Bear Power Moving Averages is used to find th
Contact us for any custom order,   CodeYourTrade.com . Keltner Channels are volatility-based envelopes. Moving average dictates direction and the ATR sets the channel width. It’s a trend following indicator used to identify reversals. Channels can also be used to identify overbought and oversold levels when the trend is flat. Trading Strategy We have created 2 zones SELL ZONE and BUY ZONE using the Keltner channels. In SELL ZONE (upper) we take only sell orders and in BUY ZONE (lower) we take
Contact us for any custom order,   CodeYourTrade.com . The MACD Histogram measures the distance between the MACD line and the MACD signal line. Two important terms are derived from the MACD histogram are: ·          Convergence : The MACD histogram is shrinking in height. This occurs because there is a change in direction or a slowdown in the trend. When that occurs, the MACD line is getting closer to the MACD signal line. ·          Divergence : The MACD histogram is increasing in height (eith
Contact us for any custom order,   CodeYourTrade.com . Multiple Moving Average (MA) indicator is used to find the direction of the trend using multiple Moving Average indicators. It calculates using the following rules: ·          Ask < MA, it is SELL ·          Bid > MA, it is BUY ·          Ask > MA > Bid, it is None (no signal) After you attached the indicator to a chart it will show the following information on the chart: Multiple MAs arranged by their method Buy and Sell count Summary: Con
Contact us for any custom order,   CodeYourTrade.com . The Stochastic RSI indicator is essentially an indicator of an indicator. It is used in technical analysis to provide a stochastic calculation to the RSI indicator. This means that it is a measure of RSI relative to its own high/low range over a user-defined period of time. This indicator is primarily used for identifying overbought and oversold conditions. You can hide all the information displayed in the chart by setting  false  to  Show
Spread & Swap Indicator is used to check the spread and swap for the current pair. You can hide all the information displayed in the chart by setting  false  to  Show On Chart . Indicator Settings: Main Setting Display Spread : Shows the spread of the current pair. Display Swap (per lot) : Show the swap charges per lot for the current pair. Display Setting Display : Shows the indicator information on chart Location : Location of the display window Top-Left : Display all the details in top-left p
With the Technical Analysis indicator, you can find the trading signals using the combination of different technical indicators. It supports the following technical indicators: 1.     RSI 2.     Stochastic 3.     Stochastic RSI 4.     MACD 5.     ADX 6.     CCI 7.     ATR 8.     Ultimate Oscillator 9.     ROC 10.   Bull/Bear Power After you attached the indicator to a chart it will show the following information on the chart: 1.     Technical indicators, their values and the signal generated fro
Contact us for any custom order,   CodeYourTrade.com . With the Technical Indicator Multi-Timeframe, you can easily identify the oversold/overbought levels or buy/sell levels points on several different timeframes by using only one chart. You can confirm Short Term trades by higher timeframe Levels. It supports 4 technical indicators as of now Stochastic, RSI, Parabolic SAR & Heiken Ashi. After you attached the indicator to a chart it will show the following information on the chart: Timeframe:
Contact us for any custom order,   CodeYourTrade.com . Trade Notifier indicator is used to notify opening or closing of the trades via email or alert. It can also send regular trade updates via email. After you attached the Indicator to a chart, it will show the following information on the chart: 1.     Alert information 2.     Email information 3.     Details to include in email body You can hide all the information displayed in the chart by setting  false  to  Display . Indicator Settings Al
Contact us for any custom order,   CodeYourTrade.com . Trend Direction indicator finds the direction of the trend using 2 indicators ADX and Parabolic SAR. Change the color of the Sell and Buy strength from the Colors tab in indicator settings. After you attached the indicator to a chart it will show the following information on the chart: 1.     Parabolic SAR: Input values of Parabolic SAR Indicator 2.     ADX: Input values of ADX Indicator 3.     Trend Strength: Direction of the trend
Contact us for any custom order,   CodeYourTrade.com . Martingale EA is a multicurrency Expert Advisor using martingale or grid technique to trade the market. Trading strategy: Manual Entry + Automated Trade Management Manual Entry : User can input the starting trade type in the EA based on their analysis. The EA has no intelligence of its own to decide the entry trade type. Intelligence can be added in the EA upon request. Automated Trade Management : It manages the trade using martingale or gr
Contact us for any custom order, CodeYourTrade.com . Timed Close EA is used to close all the trades automatically at your specific time. You can set the EA using any of the 3 options: 1.     OneTime: In this option EA will run only once. Execute at that date-time and stops. 2.     Weekly: In this option EA will run at specific day-time every week. For example if you wanted to close all the trades before market close at Friday, you can use this option. 3.     Daily: In this option EA will run da
Straddle EA
HITESH ARORA
5 (2)
Contact us for any custom order,   CodeYourTrade.com . The main use of Straddle EA is to trade at the major fundamental news events. It opens 2 pending orders Buy Stop and Sell Stop to capture the market single direction movements at the time of news. The EA will run from "News Time – Seconds before News Time" to "Expiration Time". These are the sequence of states in the EA: Waiting : Before "News Time – Seconds before News Time". The EA is waiting to start. Passed : The EA started and trade ex
Contact us for any custom order,   CodeYourTrade.com . Profit and Loss Manager EA is to close the running or pending trades when reached to a specified profit or loss. EA works fully on virtual mode i.e. no hard Stop Loss or Take profit set. You can run the EA in any of the 3 modes: 1.     Per Trade : In this mode, actions are applied to all the trades separately. Rules are applied on a single trade separated, it’s profits/loss not combined with any other trades. 2.     Per Pair : In this mode
Contact us for any custom order,   CodeYourTrade.com . Partial Close EA is used to partially close running trades. EA has an option to filter out the trades and works only on specific trades. Following are the filters for the EA: 1.     Magic Number: Have an option to works on all orders with the given magic number 2.     Order Number: Can work specifically on the single order with the given order number 3.     Chart: Can work for all the trades of the current attached chart Example : Let’s say
Contact us for any custom order,   CodeYourTrade.com . Brent Wti spread indicator shows the difference of Brent and Wti value. Trading Strategy: Identify the range of spread movement. To buy the difference execute these 2 trades “Buy BRENT and Sell WTI” To sell the difference execute these 2 trades “Sell WTI and Buy BRENT”   Indicator Settings: Main Setting Indicator Maximum : Maximum level to show in indicator Indicator Minimum : Minimum level to show in indicator Brent Symbol Name : Symbol na
Filter:
No reviews
Reply to review