Continuous Bars Ind
- Indikatoren
- Version: 1.1
- Aktualisiert: 22 März 2020
- Aktivierungen: 5
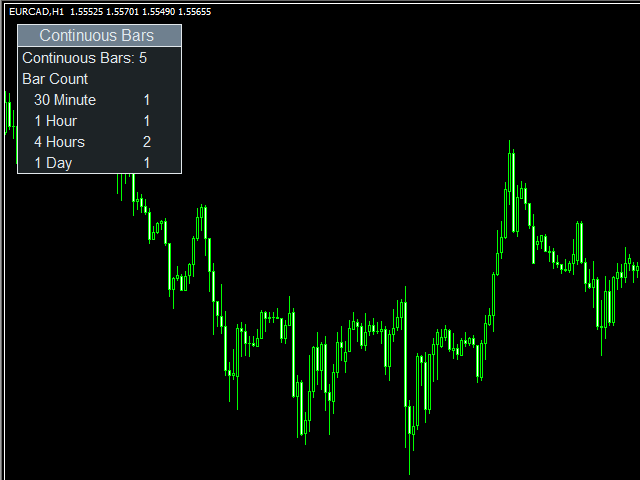
Der Indikator Kontinuierliche Balken wird verwendet, um die kontinuierlichen Balken zu verfolgen, die in einer Richtung geschlossen sind.
Zum Beispiel:
Kontinuierliche Balken = 3 (wir suchen nach 3 kontinuierlichen Balken)
Wenn nun (Open > Close) oder (Close > Open) für 3 fortlaufende Bars, wird dies per E-Mail oder Alarm mitgeteilt.
Sie können alle im Chart angezeigten Informationen ausblenden, indem Sie für Show On Chart die Einstellung false wählen.
Einstellungen des Indikators:
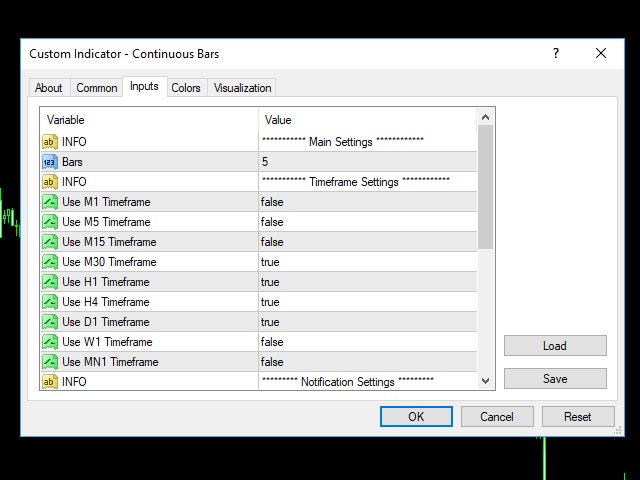
Haupt-Einstellung
- Bars: Anzahl der angezeigten Balken
Preis-Einstellung
- M1-Zeitrahmen verwenden: Suche nach kontinuierlichen Balken im M1-Zeitrahmen
- M5-Zeitrahmen verwenden: Suche nach durchgehenden Balken im M5-Zeitrahmen
- M15-Zeitrahmen verwenden: Suche nach fortlaufenden Balken im M15-Zeitrahmen
- M30-Zeitrahmen verwenden: Suche nach fortlaufenden Balken im M30-Zeitrahmen
- H1-Zeitrahmen verwenden: Suche nach durchgehenden Balken im H1-Zeitrahmen
- H4-Zeitrahmen verwenden: Suche nach durchgehenden Balken im H4-Zeitrahmen
- W1-Zeitrahmen verwenden: Suche nach durchgehenden Balken im W1-Zeitrahmen
- MN1-Zeitrahmen verwenden: Nach fortlaufenden Leisten im MN1-Zeitrahmen suchen
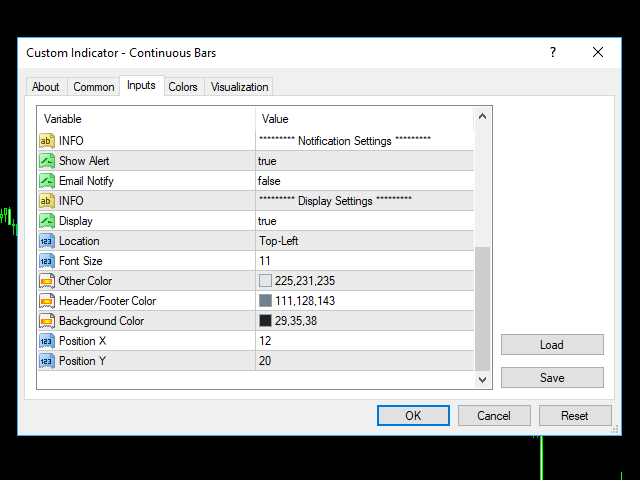
Einstellung der Benachrichtigung
- Show Alert: Benachrichtigungsfeld anzeigen
- E-Mail-Benachrichtigung: Eine E-Mail senden
Display-Einstellung
- Display: Zeigt die Indikatorinformationen im Chart an
- Position: Position des Anzeigefensters
- Oben-links: Alle Details werden oben-links angezeigt
- Unten-links: Anzeige aller Details unten-links
- Schriftgröße: Größe der Schriftart
- Andere Farbe: Allgemeine Farbe
- Kopf-/Fußzeilenfarbe: Kopf- und Fußzeilenfarbe des Anzeigefensters
- Hintergrundfarbe: Hintergrundfarbe des Anzeigefensters
- Position X: Position des Anzeigefensters auf der X-Achse
- Position Y: Position der Y-Achse des Anzeigefensters