Currency Pulse MT5
- Indicators
-
Evgeniy Zhdan
 ➖➖➖➖➖➖➖➖➖➖➖➖➖➖➖➖➖➖➖➖➖➖
Products: https://www.mql5.com/en/users/trendhunter/seller
➖➖➖➖➖➖➖➖➖➖➖➖➖➖➖➖➖➖➖➖➖➖ - Version: 1.0
- Activations: 5
CURRENCY PULSE — CURRENCY STRENGTH BOARD FOR METATRADER
OVERVIEW
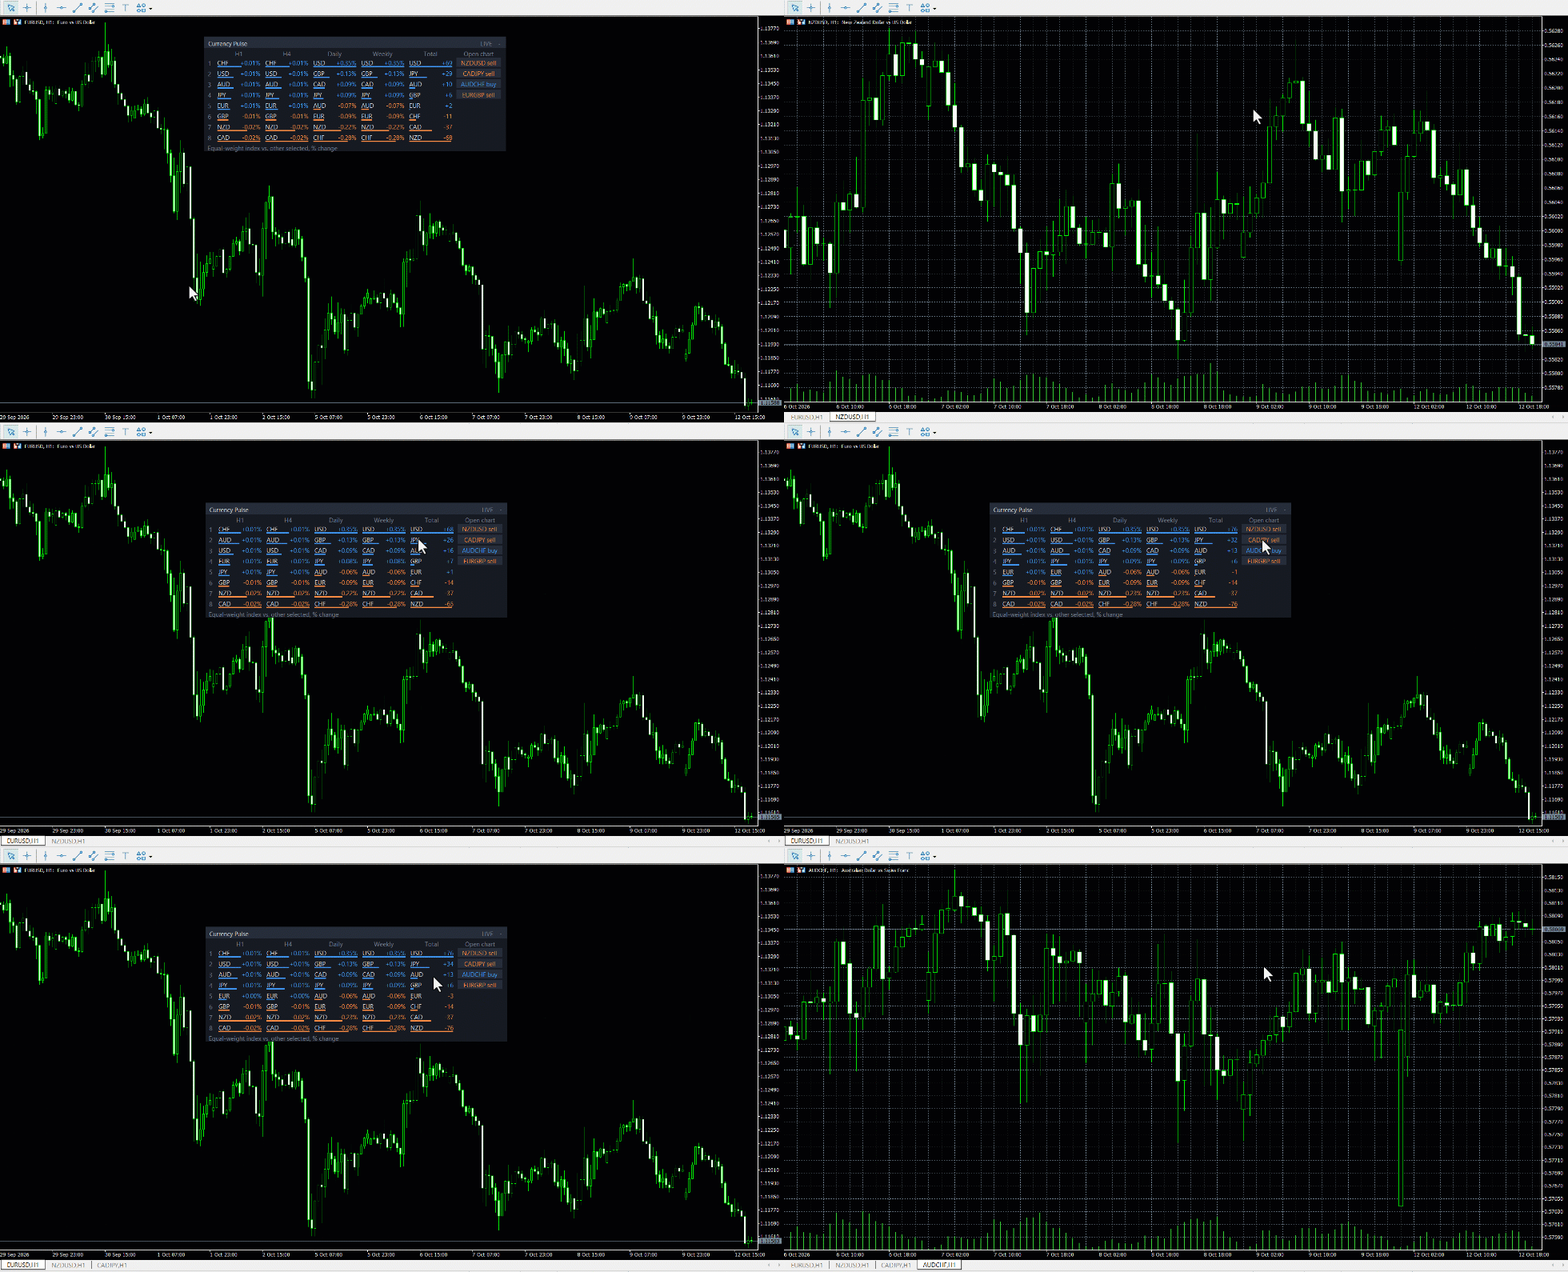
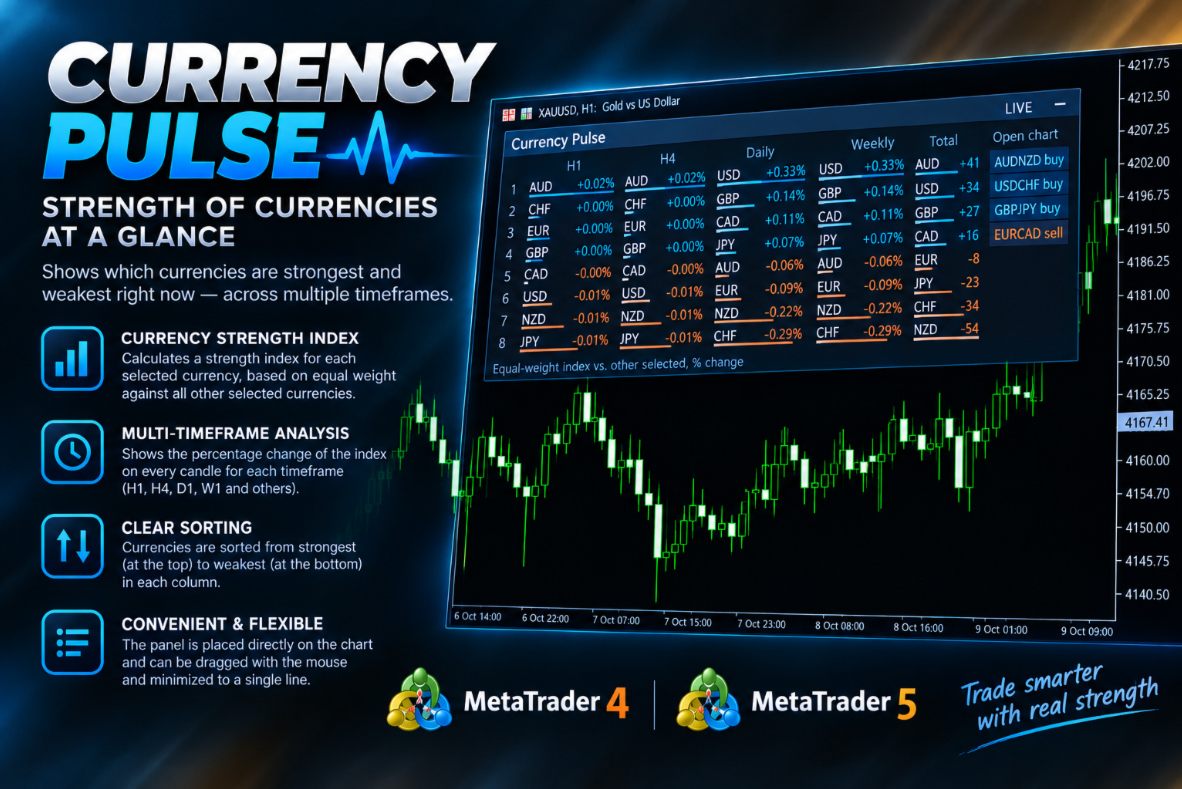
Currency Pulse shows the strength of currencies on several timeframes at once: which ones are leading right now and which ones are lagging. For every selected currency the indicator builds a strength index against all the other selected currencies (all currencies carry equal weight) and shows by how many percent this index has changed over the candle of each timeframe. In every column the currencies are lined up from the strongest (top) to the weakest (bottom). The board sits right on the chart: you can drag it with the mouse and collapse it to a single line.
HOW IT WORKS
- Each currency is valued through its pair with USD (EURUSD, USDJPY, etc.). The indicator picks the required symbols by itself from the broker's symbol specification, so prefixes and suffixes in the names do not matter. If a symbol is not in Market Watch, it is added automatically and any missing history is loaded.
- A currency's index reflects its average performance against the other selected currencies, so it does not depend on any single pair.
- The number in a cell is the percentage change of the index over one candle of that column's timeframe.
- The bar under the number shows how strong the move is compared with the other currencies in the column: the longer the bar, the stronger the move. Blue means rising, orange means falling.
- The number on the left is the currency's rank.
- The "Total" column combines all enabled timeframes into one overall ranking. In each column a currency's move is divided by the largest move in that column, then the average over all columns is taken and multiplied by 100. The result is a score from -100 to +100 in which every timeframe has the same weight. Currencies at the top and bottom of "Total" are consistently strong or weak on several timeframes at once. While a column is still loading, "Total" shows "...".
- The "Open chart" column builds pairs from the ranking: the strongest currency against the weakest, the second strongest against the second weakest, and so on. Each button shows your broker's symbol with a buy or sell mark, and a click opens the chart of that pair. If your broker does not offer such a pair, the button is inactive and marked "n/a".
- Data is refreshed by a timer, even when no new ticks arrive.
HOW TO USE IT
- Choosing a pair. The strongest currency against the weakest gives the pair with the biggest divergence. The "Open chart" column picks such pairs for you.
- Confirmation across timeframes. If a currency stays near the top of the ranking on H4, Daily and Weekly, the trend is stable. You can then look for an entry on H1 and below.
- Spotting pullbacks. A currency that is strong on H1 but weak on Daily may be pulling back against the higher-timeframe move.
- Finding the source of a move. If USD is first in every column, it is the dollar itself that is moving, not a single pair.
- Weekly preparation. Switch "Measure" to "Last closed candle" and look at the Daily and Weekly columns: they show which currencies led on the previous candle.
- Filtering out flat markets. Pairs in which both currencies sit near zero usually do not give a noticeable move.
- Quick overview. The "Total" column gives the overall picture across all timeframes at a glance.
SETTINGS
- Currencies (comma-separated) — list of currencies separated by commas, for example USD,EUR,GBP,JPY. At least two are required. Any three-letter code that has a pair with USD at your broker will work. Wrong or non-existent currencies are not shown on the board, and an alert is issued.
- Measure — what to measure. "Current candle (live)" is the move of the current, still forming candle (today, this week, etc.), updated in real time. "Last closed candle" is the move of the last finished candle, convenient for analysis and preparation.
- Timeframe M1, M5, M15, M30, H1, H2, H4, H6, H8, H12, Daily, Weekly, Monthly — timeframe check boxes. Each enabled box adds a column; columns run from left to right from the lowest timeframe to the highest. H1, H4, Daily and Weekly are enabled by default. If none is enabled, the defaults are used and an alert is issued.
- Show Total column — show the "Total" column with the overall ranking.
- Show Open chart column — show the "Open chart" column with buttons that open the chart of a pair.
- Open chart: rank by Total column — if enabled (default) and the "Total" column is shown, the pairs for "Open chart" are built from the overall "Total" ranking. If it is disabled or the "Total" column is hidden, the "Open chart: rank by timeframe" setting is used.
- Open chart: rank by timeframe — which timeframe's ranking is used to build the pairs for "Open chart" (H4 by default). If this timeframe is not among the columns, the first column on the left is used.
- Open chart: chart timeframe — the timeframe on which the pair chart is opened. By default it is the same as the current chart.
- Refresh interval, sec — how often the values are recalculated, in seconds.
- Start collapsed — start the board in the collapsed state.
- Start position X, px and Start position Y, px — initial position of the board's top-left corner relative to the top-left corner of the chart. After dragging, the new position is remembered for this chart.
- Font size and Font — font size and font name.
- Panel color, Header color, Text color, Rising color, Falling color — colors of the board background, header and text, plus the colors for rising and falling.
- Alerts about wrong / missing currencies — enables pop-up alerts: wrong currency code, required symbol not found, no history for a timeframe, no timeframe selected. Each message is shown once.
CONTROLS
Drag the board by its header with the mouse. The "−" / "+" button in the right corner of the header collapses and expands the board.