Backtest Reality Check
- Utilities
- Version: 1.0
- Activations: 10

Backtest Reality Check reads a Strategy Tester report and measures ten things in it, then measures the same ten things on the live trades the expert behind that report has since taken in your account, and sets the two side by side. Until the live side reaches 30 closed trades, the gap is not called a difference: it is still printed, and the panel says on screen that there are too few trades to judge it. It places no orders, and it modifies and closes nothing; there is no trading call anywhere in the source.
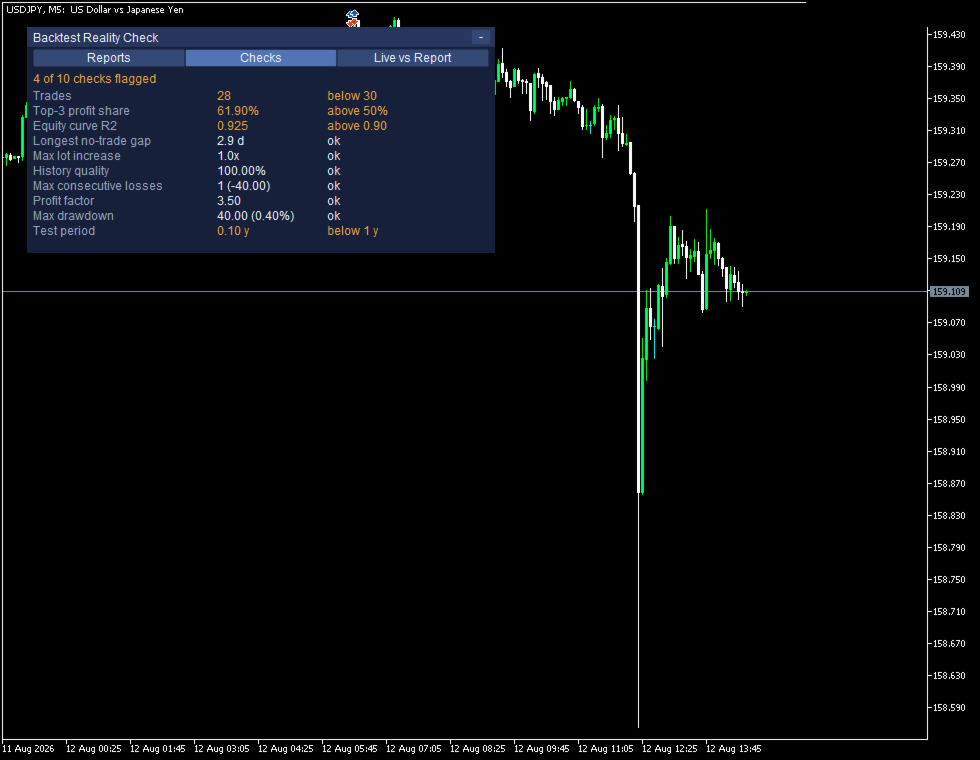
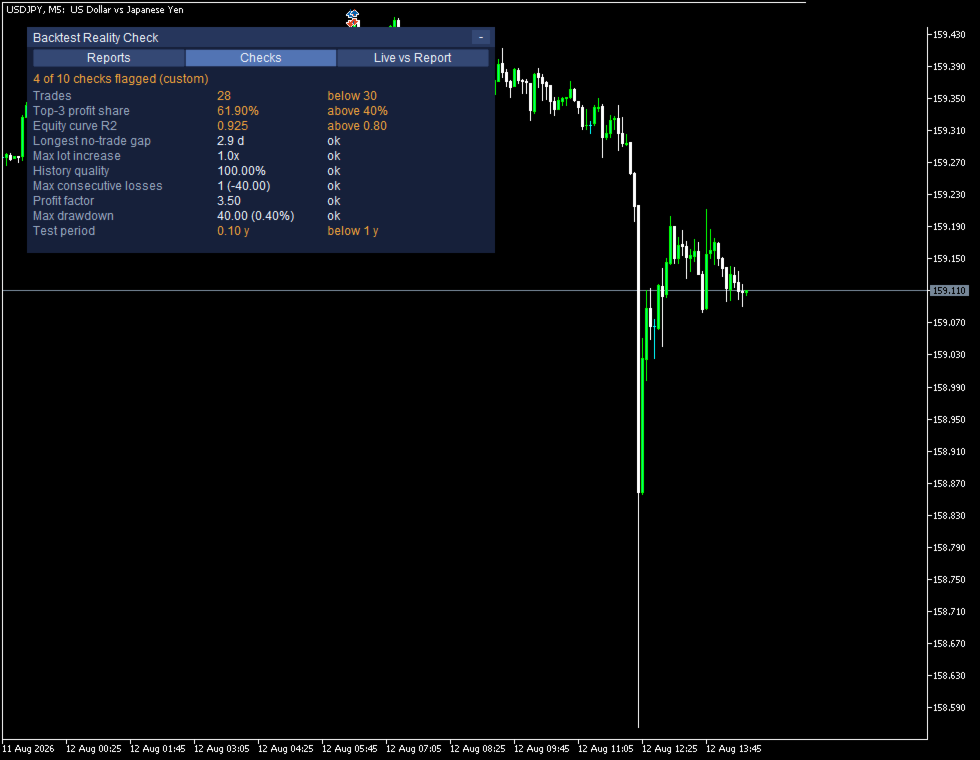
Seven of the ten checks carry a line. When a value crosses one the row is flagged, and that is all the flag says: it is not a verdict on the expert, and it does not say why the number looks that way, since curve fitting, a market that moved on, a different broker and plain luck all leave similar traces.
THE LIVE SIDE, NEXT TO THE REPORT
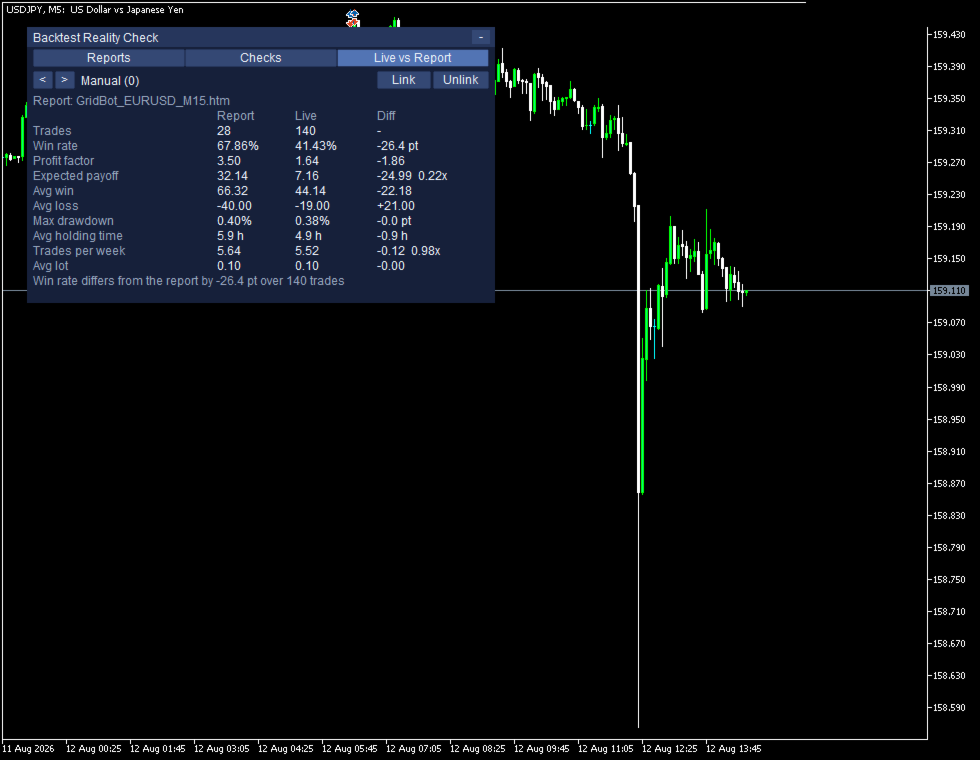
Manual (0) Link Unlink
Report: GridBot_EURUSD_M15.htm
Report Live Diff
Trades 28 140 -
Win rate 67.86% 41.43% -26.4 pt
Profit factor 3.50 1.64 -1.86
Expected payoff 32.14 7.16 -24.99 0.22x
Avg win 66.32 44.14 -22.18
Avg loss -40.00 -19.00 +21.00
Max drawdown 0.40% 0.38% -0.0 pt
Avg holding time 5.9 h 4.9 h -0.9 h
Trades per week 5.64 5.52 -0.12 0.98x
Avg lot 0.10 0.10 -0.00
Win rate differs from the report by -26.4 pt over 140 trades
The live column is not a second implementation: your closed deals are assembled into the same data structure that a parsed report produces, then handed to the same measuring functions.
Trades is the only row with no Diff, because months of tester history and weeks of live trading are not meant to reach the same count. Gaps between percentages are given in points, because the difference between two percentages is not itself a percentage.
Grouping by expert needs no configuration. The tool collects the magic numbers in your trade history and gives each one its own row, and it groups deals with no magic number under Manual (0), since in the deal record a position you opened by hand and one from an expert whose magic number was never set look exactly the same. Link and Unlink pair a report with an expert, and the pairing is stored per account.
WHEN IT SAYS IT CANNOT TELL YET
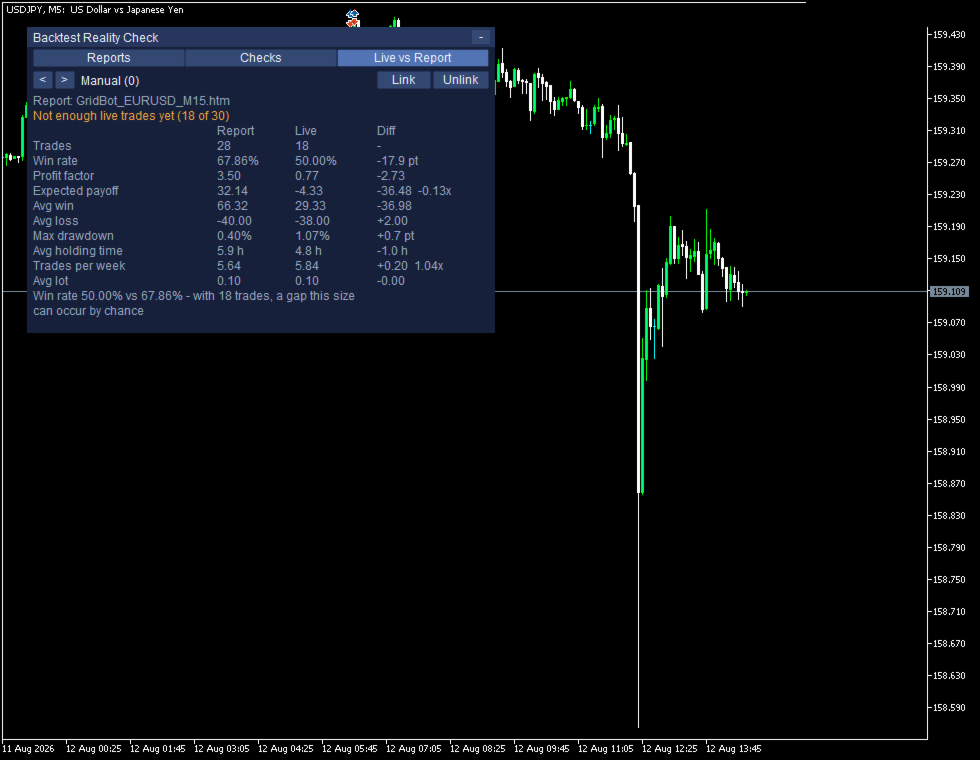
Not enough live trades yet (18 of 30)
Win rate 50.00% vs 67.86% - with 18 trades, a gap this size can occur by chance
Below 30 live trades the figures are dimmed - the Report and Live columns along with Diff - and the panel prints the wording quoted here. The gap is still shown, because hiding it would be its own kind of dishonesty; it is simply not called a difference yet.
For Win rate the question is not whether a line was crossed but whether the gap is within reach of chance. Take the proportion from the report side, multiply it by one minus itself, divide by the number of live trades and take the square root: that is the standard error, and while the gap stays inside a band of 1.96 standard errors it is treated as something that can occur by chance.
Both screens quoted here are measured against the same report, so the only thing moving that band is the number of live trades, and you can redo the arithmetic yourself. With the smaller count the band comes out wider than the gap, and the panel says so. With the larger count it comes out narrower; the wording is dropped, and the screen states the gap on its own, which is the sentence printed under the Live vs Report comparison.
Being able to say that it cannot tell yet is the point of this tool.
GETTING A REPORT IN
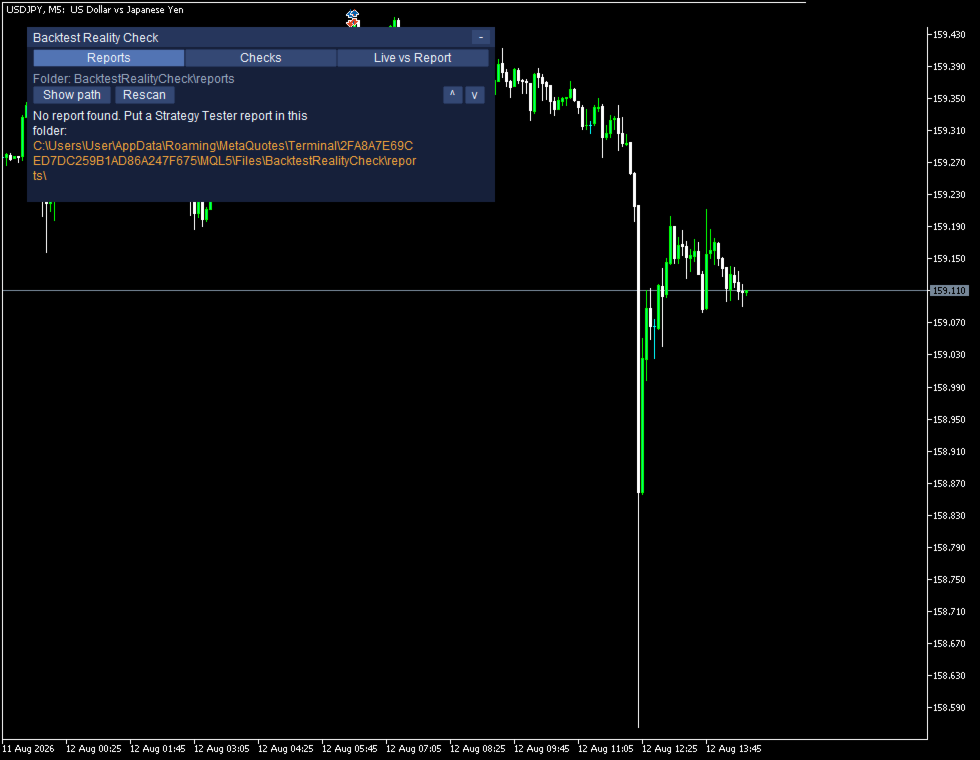
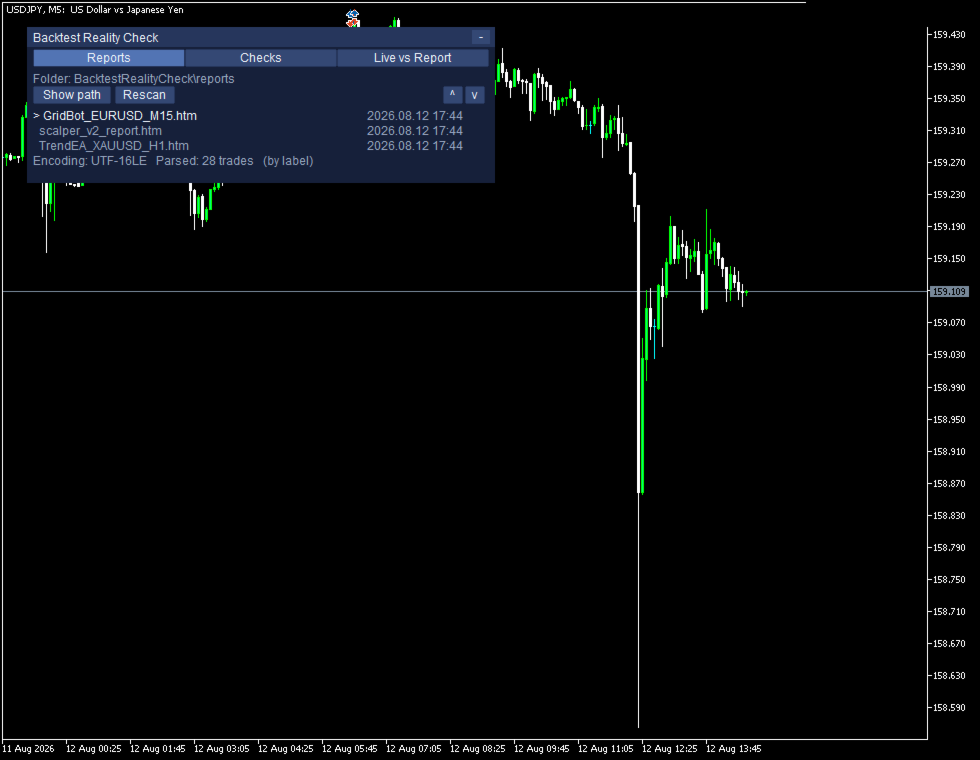
In the Strategy Tester, save the result as HTML. The dialog offers HTML and XML and preselects neither, and what it calls XML is a spreadsheet file this product cannot read. If you save that instead, the panel names the file on screen and asks you to save the report again as HTML. Reports go in MQL5\Files\BacktestRealityCheck\reports, and while that folder is empty the panel prints the full path to it.
WHAT LEAVES YOUR MACHINE
Figures come from the deal list rather than from the summary lines of the report, so a report saved on a terminal set to any interface language yields the same figures. Your file is read on your own machine, and nothing goes out: it makes no outbound request of any kind.
WHAT IT CANNOT DO
- It opens, closes and modifies nothing, and it cannot start or stop the expert it is measuring.
- It is built for hedging accounts: on a netting account the terminal merges positions per symbol, and the per-expert figures can be merged along with them.
THE FREE DEMO
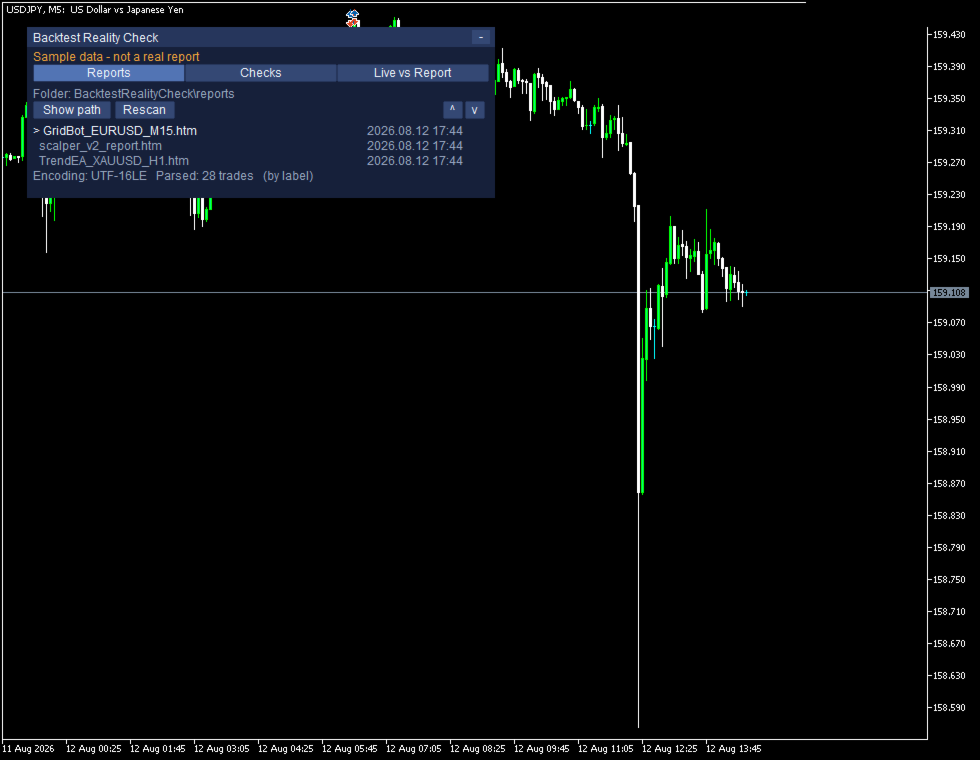
Sample data - not a real report
The demo runs in the Strategy Tester on a sample built into the product, so there is something to read from the first second instead of an empty panel. The notice Sample data - not a real report stays on screen throughout and goes to the terminal journal as well, and the sample never appears on a live chart.
PARAMETERS AND ENVIRONMENT
InpReportFolder InpUseCommonFolder InpRescanSeconds InpMinTradesForStats
InpFlagTopTradeShare InpFlagEquityR2 InpFlagMinTrades InpIncludeSwapCommission
InpHistoryDays InpPanelX InpPanelY InpFontSize InpShowTesterSelfDemo
There are thirteen inputs, listed in the order the dialog shows them, and every one works at its default. You need MetaTrader 5, one spare chart and a hedging account. The source is checked by machine before release and carries no trading calls, no DLL imports and no outbound requests.
Backtest Reality Check reads trades that have already closed and counts them; about what comes next, it says nothing, and it makes no claim about your results. Trading carries the risk of loss; try the demo first.