Win Streak Size Creep Mirror

Win Streak Size Creep Mirror reads your own account's closed trade history and counts one specific pattern: opening a new position during a run of wins, at a lot size larger than your own recent normal. It does not predict, and it does not advise. Every number on the panel is something that already happened on this account.

How the numbers are built: it reads up to 31 days of closed deals across every symbol and every magic number - this is an account-wide picture, not a chart-specific one. From the 30 days before today it takes the median lot size of new entries and shows it as the 30d median lot; it also shows the 30d daily median, the median number of new entries per day over that same window. Both use the median, not the average, so one unusually large trade does not shift the whole baseline. With fewer than 5 entries in that 30-day window there is not enough history to set a fair baseline, and the panel prints "Collecting history" instead of a number built on too little.

Current win streak counts consecutive winning exits, walking back from the most recent one until it reaches a loss or a breakeven close. There is no time limit on this count - a streak stays open for as long as it keeps winning, however long that takes. When the most recent closed trade was not a win, there is no streak running, and the panel states No win streak active instead of guessing at an elapsed time. Largest lot in streak shows the biggest new-entry lot size since the current streak began, next to the 30d median lot, with the ratio between them. Entries during streak, above 30d median lot: counts new entries opened while a streak was running, at a lot size above the 30d median lot, split into This streak and Last 7 days.

Screenshot 1, EURUSD M15, a demo account that already had real trading history: the headline shows the largest entry of the current streak measured against the 30-day median lot, and because the trade that opened this streak falls outside the 31-day window the lot behind it cannot be measured, so it reads n/a over the line Largest lot in streak - vs 30d median lot 0.02 lots. Below that, Current win streak reads 1, the 30d daily median reads 0, Largest lot in streak shows a dash, the 30d median lot is 0.02 lots, Streak started reads 53h 07m, and under Entries during streak, above 30d median lot: both This streak and Last 7 days read 0. State reads OK. Every figure there is what this account's own closed history held at the moment of capture - not a placeholder, not an estimate.

Screenshots 2 to 4 are the same panel, on the same account, at the same moment, read three ways. Screenshot 2 enlarges the block below the headline, so the two pairs of numbers, the elapsed time and the two counts can be read at full size. Screenshot 3 puts font size 7 and font size 12 side by side, which is one of the four display inputs. Screenshot 4 sets out what the tool does not do. Those inputs move only where the panel sits, how large its text is and what colour it has - the figures themselves come from the whole account's history rather than from the symbol on the chart in front of it, so switching symbols or timeframes never changes what the panel reports.

What it does not do: it never places, closes or modifies an order - there is no connection to the trade side of the terminal at all. It uses no technical indicator and no other timeframe; the only material is each closed deal's own type, time, volume and net result. It never tells you to reduce your position size or to stop opening trades - the panel states counts, ratios and elapsed time, and nothing else. It does not show a hit rate, a net result, or any forecast of future results. It does not merge history across multiple accounts or terminals - only the one the chart is running on. Deposits, withdrawals and other non-trade balance operations are excluded from every count. It does not judge whether a running streak is a problem - a long streak with no size increase produces the same This streak count of 0 as no streak at all.

Four inputs, all of them about how the panel looks: show or hide it, which corner it sits in, its font size, and its text color. There is no numeric threshold anywhere in the settings, because the tool is not asking you to tune anything - load it on any chart and it reads that account's own trade history.

One condition worth knowing before testing it: the Strategy Tester's account history only contains deals made during that specific test run, so on a fresh test the panel will normally show No win streak active or Collecting history throughout. This is a property of how the Tester works, not a fault in the tool - loaded on a live account or a demo account with real trading history, the panel fills in with that account's own measured numbers from the first tick. A second point worth knowing: the streak count only reflects what is visible in the 31-day lookback - a streak that started earlier than that is still measured, but only from where the visible history begins, not from its true start.

This is one of a small set of free, no-advice account-history tools from the same author, alongside Trade Behavior Mirror, which reads the same kind of history to show entries placed shortly after a loss. The author's MQL5 profile lists these free tools together with several paid MT5 indicators and utilities for gold-specific signals, trade risk limits and backtest-versus-live auditing, for traders who want more building blocks beyond this free measurement tool.

Free, with no reduced or trial version behind it - what is described above is the whole tool.
Recommended products
The indicator builds current quotes, which can be compared with historical ones and on this basis make a price movement forecast. The indicator has a text field for quick navigation to the desired date. Options: Symbol - selection of the symbol that the indicator will display; SymbolPeriod - selection of the period from which the indicator will take data; IndicatorColor - indicator color; Inverse - true reverses quotes, false - original view; Next are the settings of the text field, in w
Boom Crash SMC
Israr Hussain Shah
Here   our more valuable tools SMC Trend Trading   ,  Easy SMC Trading  ,  Institutional SMC Architect Volume Analysis Tools  ,  Volume flow Profile  ,  Market volume profile  , FVG with Volume  , Liquidity Heatmap Profile  ,  Volume Spread Analysis Deriv boom and crash index spike killer system you can use it only on m5 timeframe  follow the structure and get signal with alert on phone open trade set sl tp and enjoy easy analysis and trading made simple 
Order Book, known also as Market Book, market depth, Level 2, - is a dynamically updated table with current volumes of orders to buy and to sell specific financial instument at price levels near Bid and Ask. MetaTrader 5 provides the means for receiving market book from your broker, but in real time only, without access to its history. The indicator OrderBook Cumulative Indicator accumulates market book data online and visualizes them on the chart. In addition, the indicator can show the market
VR Grid Mt5
Vladimir Pastushak
3.25 (8)
The VR Grid indicator is designed to create a graphical grid with user-defined settings. Unlike the standard grid , VR Grid is used to build circular levels . Depending on the user's choice, the step between the round levels can be arbitrary. In addition, unlike other indicators and utilities, VR Grid maintains the position of the grid even when the time period changes or the terminal is rebooted. You can find settings, set files, demo versions, instructions, problem solving, at [blog] You can
FREE
Here   our more valuable tools SMC Trend Trading   ,  Easy SMC Trading  ,  Institutional SMC Architect Volume Analysis Tools  ,  Volume flow Profile  ,  Market volume profile  , FVG with Volume  , Liquidity Heatmap Profile  ,  Volume Spread Analysis Boom: Take SELL signals only (price spikes up then crashes) Crash: Take BUY signals only (price drops then spikes up) SL goes beyond the line as labeled Interactive Market Watch Panel : A left-side sidebar showing real-time strength indicators (po
An ICT fair value gap is a trading concept that identifies market imbalances based on a three-candle sequence. The middle candle has a large body while the adjacent candles have upper and lower wicks that do not overlap with the middle candle. This formation suggests that there is an imbalance where buying and selling powers are not equal. Settings Minimum size of FVG (pips) -> FVGs less than the indicated pips will be not be drawn Show touched FVGs Normal FVG color -> color of FVG that hasn't
FREE
Here   our more valuable tools SMC Trend Trading   ,  Easy SMC Trading  ,  Institutional SMC Architect Volume Analysis Tools  ,  Volume flow Profile  ,  Market volume profile  , FVG with Volume  , Liquidity Heatmap Profile  ,  Volume Spread Analysis The    Liquidity Heatmap   is a sophisticated institutional trading tool designed to reveal where over-leveraged traders are trapped. By calculating estimated liquidation levels based on volume spikes and leverage, this indicator draws a dynamic "h
Volume Candle Indicator
Pablo Filipe Soares De Almeida
Volume Color Histogram for MetaTrader 5. This indicator displays volume as a histogram in a separate window. The bars are colored based on the direction of the price candle: green for bullish (close > open) and red for bearish (close < open). Key Features Volume source: Tick volume or real volume (user-selectable). Optional moving average line over the volume histogram, which can be enabled via input. Supported average types: SMA, EMA, SMMA, LWMA. Average period is configurable. Compatible with
Here   our more valuable tools SMC Trend Trading   ,  Easy SMC Trading  ,  Institutional SMC Architect Volume Analysis Tools  ,  Volume flow Profile  ,  Market volume profile  , FVG with Volume  , Liquidity Heatmap Profile  ,  Volume Spread Analysis Transform Your Trading with Intelligent Market Insights! The 2025 Spike Killer Dashboard is a powerful MQL5 indicator that combines cutting-edge signal generation with an intuitive crystal dashboard for real-time market analysis. Designed for tra
BoxChart MT5
Evgeny Shevtsov
5 (7)
The market is unfair if only because 10% of participants manage 90% of funds. An ordinary trader has slim changes to stand against these "vultures". This problem can be solved. You just need to be among these 10%, learn to predict their intentions and move with them. Volume is the only preemptive factor that faultlessly works on any timeframe and symbol. First, the volume appears and is accumulated, and only then the price moves. The price moves from one volume to another. Areas of volume accumu
This indicator allows you to enjoy the two most popular products for analyzing request volumes and market deals at a favorable price: Actual Depth of Market Chart Actual Tick Footprint Volume Chart This product combines the power of both indicators and is provided as a single file. The functionality of Actual COMBO Depth of Market AND Tick Volume Chart is fully identical to the original indicators. You will enjoy the power of these two products combined into the single super-indicator! Below is
Volume Profile Delta
Juan Eduardo Verdala
Volume Profile Delta — Indicator for MetaTrader 5 Volume Profile Delta is an indicator that displays the difference between buying volume and selling volume recorded on each bar, represented as a histogram at the bottom of the chart. What this indicator does On each bar it calculates the difference between the volume associated with upward movements and the volume associated with downward movements. The result is shown as a bar in the lower histogram, making it possible to observe whether buying
FREE
Smart trend pro
Israr Hussain Shah
Here   our more valuable tools SMC Trend Trading   ,  Easy SMC Trading  ,  Institutional SMC Architect Volume Analysis Tools  ,  Volume flow Profile  ,  Market volume profile  , FVG with Volume  , Liquidity Heatmap Profile  ,  Volume Spread Analysis Professional trend-following indicator with comprehensive visualization and control panel Key Features: Advanced Trend Detection Reliable Half Trend algorithm for precise trend identification Color-coded trend lines (Blue for bullish, Orange for
Risk Control Tool
Israr Hussain Shah
Here   our more valuable tools SMC Trend Trading   ,  Easy SMC Trading  ,  Institutional SMC Architect Volume Analysis Tools  ,  Volume flow Profile  ,  Market volume profile  , FVG with Volume  , Liquidity Heatmap Profile  ,  Volume Spread Analysis Overview (Short Description) A professional risk management indicator that helps traders calculate lot size, risk percentage, and reward ratio in real time. Perfect for Forex, Indices, Gold, and Synthetic Indices traders who want precise control ov
Volume Profile Multiple — Multi-Block Volume Profiles with Buffers for Algorithmic Trading Tired of drawing Volume Profile block by block, redrawing and recalculating every time you change timeframe? Volume Profile Multiple automatically plots several consecutive volume profiles on the chart, revealing where institutional interest actually sat in each segment of the market — not just in the last visible range. What it does for you The indicator splits the price history into blocks of N candles e
Blahtech Supply Demand MT5
Blahtech Limited
4.57 (14)
Was: $299  Now: $99  Supply Demand uses previous price action to identify potential imbalances between buyers and sellers. The key is to identify the better odds zones, not just the untouched ones. Blahtech Supply Demand indicator delivers functionality previously unavailable on any trading platform. This 4-in-1 indicator not only highlights the higher probability zones using a multi-criteria strength engine, but also combines it with multi-timeframe trend analysis, previously confirmed swings a
VOLUME PROFILE SAF-XII                            Professional Market Profile Analysis for MT5   (The Definitive Tool for Grid & Mean-Reversion Traders)         WHAT IS VOLUME PROFILE? Volume Profile is a professional institutional tool that displays trading activity at specific price levels, unlike traditional volume indicators that show volume over time. It reveals WHERE trading occurred, within your window of choice, helping identify:   • FAIR VALUE AREAS (VAH/VAL) - Price levels wh
This indicator acts as an advanced chart analysis assistant for traders who love trading Chart Patterns. It is designed to reduce the burden of visual analysis and increase accuracy in making a profit. Main features of this indicator from a practical usage perspective: 1. Automated Pattern Detection Saves time and reduces bias: You don't need to manually draw trendlines. The indicator will search for price swings (Pivot High/Low) and automatically draw Rising Wedge and Falling Wedge structures w
Volume Profile Canvas - Professional Volume Profile Indicator for MetaTrader 5 DESCRIPTION Volume Profile Canvas is a professional volume profile indicator for MetaTrader 5 that renders directly on the chart using a high-performance Canvas engine. It calculates and displays the volume distribution across price levels, identifying the Point of Control (POC), Value Area High (VAH) and Value Area Low (VAL) in real time. This is a pure analysis tool. It does not trade. It gives you an instant vi
Volume Profile is one of the most powerful analytical tools used by professional and institutional traders. Unlike traditional volume indicators that only show when trades occurred at the bottom of your screen, Volume Profile shows exactly at what price levels those trades happened. This gives you a clear, X-ray vision of the market structure, allowing you to see exactly where smart money and institutions are accumulating or distributing their positions. How Volume Profile Detects Institutional
Was: $249  Now: $99   Market Profile defines a number of day types that can help the trader to determine market behaviour. A key feature is the Value Area, representing the range of price action where 70% of trading took place. Understanding the Value Area can give traders valuable insight into market direction and establish the higher odds trade. It is an excellent addition to any system you may be using. Inspired by Jim Dalton’s book “Mind Over Markets”, this indicator is designed to suit the
Deriv Synthetic HTF Candle Projection GMT2 Higher Timeframe Candle Projection & Previous Levels Tool for Deriv Synthetic Indices (MT5) Overview Deriv Synthetic HTF Candle Projection GMT2 is a professional MetaTrader 5 indicator built specifically for Deriv Synthetic indices . It projects the current forming Higher Timeframe (HTF) candle onto the chart and automatically draws key reference levels from previous candles. This indicator is designed to help traders maintain higher timeframe context
FREE
Overview Candle Timer Countdown Pro displays a smooth, accurate countdown to the close of the current candle, accompanied by a circular progress arc that gives you an instant visual sense of time remaining. Unlike other timers that freeze between ticks or drift out of sync, this indicator uses server time interpolation to deliver a stutter-free countdown on every timeframe from M1 to MN. Whether you trade scalping setups on the 1-minute chart or swing positions on H4, knowing exactly when the cu
Price Magnet — Price Density and Attraction Levels Indicator Price Magnet is a professional analytical tool designed to identify key support and resistance levels based on statistical Price Density. The indicator analyzes a specified historical period and detects price levels where the market spent the most time. These zones act as “magnets,” attracting price action or forming a structural base for potential reversals. Unlike traditional Volume Profile tools, Price Magnet focuses on price-time d
This Volume Delta Profile is an advanced MetaTrader 5 indicator that visualizes   volume delta (order flow imbalance)   using a volume profile-style histogram. It shows the difference between buying and selling pressure at specific price levels, helping traders identify supply and demand zones. This indicator provides a unique perspective on market dynamics by visualizing the imbalance between buying and selling pressure, offering insights beyond traditional volume analysis. Core Concept Positiv
Volume Profile displays a per-price volume histogram for each trading session, built from real tick history — every tick lands on its exact price level, so you see where trading activity actually concentrated. POC and Value Area are calculated from volume. Designed to work standalone or side by side with the TPO Market Profile indicator. Key Features: Real tick-data volume — exchange symbols (futures/stocks) use actual traded volume; forex/CFD symbols count one per quote tick at its exact price
FREE
VolumeDeltaBars
Stanislav Korotky
This indicator is a conventional analytical tool for tick volumes changes. It calculates tick volumes for buys and sells separately, and their delta on every bar, and displays volumes by price clusters (cells) within a specified bar (usually the latest one). The algorithm used internally is the same as in the indicator VolumeDeltaMT5 , but results are shown as cumulative volume delta bars (candlesticks). Analogous indicator for MetaTrader 4 exists - CumulativeDeltaBars . This is a limited substi
Koryu Delta Koryu Delta is a MetaTrader 5 indicator. It identifies trend reversal points using pivot point analysis and delta volume data. It detects Market Shift patterns and shows signals based on market dynamics. This tool can be used by traders who scalp, swing trade, or invest long-term. It analyzes up to 500 historical bars to find past patterns. It uses closed-bar logic for signals. Features of Koryu Delta Pattern Detection : It identifies bullish and bearish Market Shift patterns using
FREE
Money Flow Profile MT4  HERE   Use Guide Here our more valuable tools SMC Trend Trading   ,  Easy SMC Trading  ,  Institutional SMC Architect Volume Analysis Tools  ,  Volume flow Profile  ,  Market volume profile  , FVG with Volume  , Liquidity Heatmap Profile  ,  Volume Spread Analysis  Master Edition is a professional-grade analytical tool designed to visualize market structure through the lens of volume and money flow. Unlike standard volume indicators, this tool displays a Daily Vo
POC level MT5
Mikhail Nazarenko
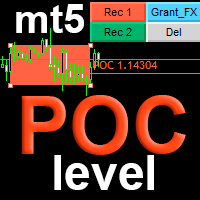
The indicator automatically calculates       and displays the level of the maximum       real   volume Point Of Control (POC) of the Market Profile for the   array of candles   highlighted by a rectangular area. This will significantly increase the accuracy of your position entries when trading POC bounces and reversals. Attention when testing the demo version!   In the MT5 strategy tester , there is no possibility of dragging a rectangle and this is a problem of limitations of the MT5 strategy
Buyers of this product also purchase
Trend Sniper X
Sarvarbek Abduvoxobov
4.9 (39)
Trend Sniper X is a multi-timeframe trend-following indicator for MetaTrader 5 that helps traders identify trend direction and potential reversal points with clarity and precision. for MT4: https://www.mql5.com/en/market/product/193245 Price Information: The current price is promotional and is subject to change as upcoming updates and new features are released. Bonus Offer: To get the FREE Auto-Trade Assistant EA for this indicator, please message the author after purchasing. Code2Profit Channe
SMART TREND TRADING SYSTEM — SPECIAL OFFER Your trading system. Your automation EA. Your training and support. Get Smart Trend Trading System for MT5 for $99 and receive Smart Universal Expert Advisor FREE to automate its signals. STTS brings trend direction, entry and exit signals, reversal zones, and important price levels together on your chart. Follow the system manually, or connect the included EA for automated execution using your chosen settings. The current $99 price applies to the next
ARIPoint
Temirlan Kdyrkhan
1 (4)
ARIPoint is a powerful trading companion designed to generate high-probability entry signals with dynamic TP/SL/DP levels based on volatility. Built-in performance tracking shows win/loss stats, PP1/PP2 hits, and success rates all updated live. Key Features: Buy/Sell signals with adaptive volatility bands Real-time TP/SL/DP levels based on ATR Built-in MA Filter with optional ATR/StdDev volatility Performance stats panel (Success, Profit/Loss, PP1/PP2) Alerts via popup, sound, push, or email Cu
Zoryk Gold
Reda El Koutbane
5 (15)
discount ends SOON next price 69 $ ZORYK — Advanced XAUUSD Signal System for MetaTrader 5 You know the feeling. You spend time analyzing gold. You wait for the entry. You finally open the trade, and price immediately moves against you. You close too early, move the Stop Loss or hesitate for a few seconds. Then the market reaches the exact destination you originally expected without you. The direction was not always the problem. The real problem was uncertainty. You did not know exactly where th
SuperScalp Pro
Van Minh Nguyen
4.66 (35)
SuperScalp Pro - Professional Multi-Layer Confluence Scalping System SuperScalp Pro is an advanced scalping indicator that upgrades classic Supertrend with multiple intelligent confirmation filters. It helps you identify higher-probability Buy/Sell opportunities while significantly reducing false signals. Clear Buy and Sell arrows appear directly on the chart, with automatic ATR-based Stop Loss and Take Profit levels calculated in real time. After purchase, contact me for setup guidance and reco
GoldenX Entry MT5
VividMind Digital Solutions
5 (16)
Price will increase by $20 every 10 buyers to maintain premium value. After purchase, contact via   MQL5 inbox   to receive your buyer kit and bonus. You have probably tested dozens of indicators before. But we are not here to be “just another signals indicator.” Behind GoldenX Entry is intensive research & development focused on building sophisticated algorithms designed to adapt to the real behavior of every instrument — not generic signals recycled everywhere else. From advanced Auto Optim
SMC Intraday Formula
VividMind Digital Solutions
5 (26)
Secure the Lowest Price Today. After purchase, contact via   MQL5 inbox   to receive your buyer kit and bonus. Let's be honest first. No indicator will make you profitable on its own. If someone tells you otherwise, they're selling you a dream. Every indicator that shows perfect buy/sell arrows can be made to look flawless — just zoom into the right window of history and screenshot the winners. We won't do that. SMC Intraday Formula is a tool. It reads the market structure for you, maps the hig
Neuro Poseidon MT5
Daria Rezueva
4.75 (52)
Neuro Poseidon is a new indicator by Daria Rezueva. It combines precise trading signals with adaptive TP/SL levels - creating best possible trades as a result! Message me and get  Neuro Poseidon Assistant  as a gift to automize your trading process! What makes it stand out? 1. Proven profitability on all assets and timeframes 2. Only confirmed BUY and SELL signals present on the chart 3. Adaptive TP & SL levels generated by the software for each trade 4. Easy to understand - suitable for al
Gann Made Easy   is a professional and easy to use Forex trading system which is based on the best principles of trading using the theory of W.D. Gann. The indicator provides accurate BUY and SELL signals including Stop Loss and Take Profit levels. You can trade even on the go using PUSH notifications. PLEASE CONTACT ME AFTER PURCHASE TO GET TRADING  INSTRUCTIONS   AND GREAT EXTRA INDICATORS  FOR FREE! Probably you already heard about the Gann trading methods before. Usually the Gann theory is a
M1 Sniper MT5
Oleg Rodin
5 (7)
M1 SNIPER  is an easy to use trading indicator system. It is an arrow indicator which is designed for M1 time frame. The indicator can be used as a standalone system for scalping on M1 time frame and it can be used as a part of your existing trading system. Though this trading system was designed specifically for short-term trading, it still can be helpful for all traders. This trading system can be used with any forex pair and time frame, though lower time frames are recommended from M1 up to M
FiboSniper Pro
Van Minh Nguyen
5 (3)
FiboSniper Pro - Multi-Filter Fibonacci System with Auto SL/TP and Control Panel FiboSniper Pro is a technical indicator that combines dynamic Fibonacci Envelopes with multiple confirmation filters to generate selective Buy and Sell signals. Fibonacci levels are calculated from Moving Average and ATR, then filtered by ADX, EMA, RSI, ATR, Volume, Time and Candle structure. The indicator displays automatic ATR-based Stop Loss and Take Profit levels directly on the chart, along with an interactive
A new King in town - Indicator + Order management indications(tp1+tp2+tp3) + Optional Telegram Signal sender   INCLUDED (FREE) ( FULL TRADING  and SIGNAL SYSTEM ) Our best EA for Gold: Gold Slayer TRY Reversion Queen NEW Free Automation EA link < click here ( disclaimer: this is new and still on testing and phase , use at your risk on demo) Free Telegram Bridge < click here  This indicator includes an advanced Strategy, a trading system with customisable order management and a mean reversion sy
Entry Points Pro 10 — the legend of the MQL5 Market. Three years in the Market's Top-3. 595 reviews across two versions. Over 31,000 demo downloads. Thousands of traders open their charts with it every morning. Built and traded by an author who has been in the market since 1999. Version 10 is the biggest rebuild in the indicator's history: I read every review from five years — and built the answers into the code. WHAT IT DOES It shows the entry point in advance — strictly without repainting. The
Auto Optimized SpeedAngle is an institutional-grade momentum vectoring system that eliminates curve-fitting through continuous Walk-Forward Optimization (WFO). Rather than relying on static inputs that degrade when market regimes shift, the indicator dynamically recalibrates its parameters using Out-of-Sample (OOS) validation, ensuring the displayed signals represent genuine statistical edges rather than historical anomalies. By shifting the focus from subjective visual angles to normalized, qua
Unix Scalper
Issam Kassas
4 (4)
UNIX SCALPER — SPECIAL OFFER Find the setup. See the plan. Choose how to trade it. Get UNIX Scalper for MT5 for $99 and receive Smart Universal Expert Advisor FREE to automate its signals. UNIX Scalper brings market analysis, BUY/SELL/WAIT decisions and Entry, Stop Loss, TP1 and TP2 levels into one organized panel. Follow the trade plan manually or connect the included EA for automated execution using your chosen settings. The current $99 price applies to the next 30 purchases. After that, the p
Welcome to ENTRY IN THE ZONE AND SMC MULTI TIMEFRAME / SPECIAL BENEFIT FOR OUR MQL5 CUSTOMERS  FREE ACCESS TO THE NEW TOOL —COMING SOON —   Learn More on Our Official Website : https://www.fableedge.net Entry In The Zone and SMC Multi Timeframe is a real-time market analysis tool based on Smart Money Concepts (SMC), designed to analyze market structure, price direction, and key trading zones. It supports both Single-Timeframe Analysis and Multi-Timeframe Analysis, providing a clearer view of the
Gold Entry Sniper
Tahir Mehmood
5 (21)
Gold Entry Sniper – Professional Multi-Timeframe ATR Dashboard for Gold Scalping & Swing Trading Gold Entry Sniper is a cutting-edge MetaTrader 5 indicator designed to give traders precise buy/sell signals for XAUUSD and other symbols, powered by ATR Trailing Stop logic and a multi-timeframe analysis dashboard . Built for both scalpers and swing traders, it combines real-time market direction , dynamic stop levels , and professional visual dashboards to help you identify high-probability gold en
Tokyo mt5 Indicator
Vasiliy Strukov
5 (2)
Tokyo Indicator provides a clear visual overview of trend direction, potential trading signals, and market conditions. Its colour-coded, stepped trend line distinguishes bullish phases in blue from bearish phases in magenta. Matching directional arrows highlight potential buying and selling opportunities when the displayed trend changes. An integrated dashboard brings together the current signal, market bias, momentum, volatility, and signal quality in one convenient view. This allows traders t
Atomic Analyst MT5
Issam Kassas
4.47 (60)
ATOMIC ANALYST — SPECIAL OFFER Your market analysis. Your automation EA. Your training and support. Get Atomic Analyst for MT5 for $99 and receive Smart Universal Expert Advisor FREE to automate its signals. Atomic Analyst brings price action, trend direction, entry and exit signals, Stop Loss and multiple Take Profit levels together on your chart. Trade manually using its analysis, or connect the included EA for automated execution using your chosen settings. The current $99 price applies to t
SMART PRICE ACTION CONCEPTS — SPECIAL OFFER See the structure. Identify the zones. Build your trading plan. Get Smart Price Action Concepts for MT5 for $49 and receive Smart Universal Expert Advisor FREE. Bring Smart Money Concepts (SMC), ICT-style analysis and price action together in one organized chart. Identify market structure, order blocks, liquidity reference levels and imbalances, then choose which elements to display through the Smart Panel. The current $49 price applies to the next 30
FX Trend MT5 NG
Daniel Stein
5 (6)
FX Trend NG: The Next Generation Multi-Market Trend Intelligence Overview FX Trend NG is a professional multi-timeframe trend and market monitoring tool designed to give you a complete structural overview of the market in seconds. Instead of switching between dozens of charts, you instantly see which symbols are trending, where momentum is fading, and where strong alignment exists across timeframes. This tool is part of the Stein Investments ecosystem - 18+ tools plus Max, your 1-on-1 AI tradi
Adaptive Price Action Engine Buy Indicator- Get EA Based on it for FREE. Self-Optimizing Multi-Timeframe Trend & Candlestick Intelligence Markets do not behave the same way all the time—and not every price-action pattern has the same value in every market regime. Adaptive Price Action Engine is designed to adapt to changing market conditions by combining trend structure, multi-timeframe analysis, candlestick patterns, and statistical optimization into one analytical framework. Two Adaptive Mode
FX Power MT5 NG
Daniel Stein
5 (33)
FX Power: Analyze Currency Strength for Smarter Trading Decisions Overview FX Power is your go-to tool for understanding the real strength of currencies and Gold in any market condition. By identifying strong currencies to buy and weak ones to sell, FX Power simplifies trading decisions and uncovers high-probability opportunities. Whether you’re looking to follow trends or anticipate reversals using extreme delta values, this tool adapts seamlessly to your trading style. Don’t just trade—trade
Power Candles MT5
Daniel Stein
4.58 (12)
Power Candles - Self-Optimizing Strength Indicator Strength usually lives in a sub-window. The line runs below, the candle above, and your eye keeps connecting the two. Power Candles puts the strength into the candle itself, colored from dark red to dark green, so the chart reads at a glance and the sub-window stays closed. The indicator also finds its own settings for the symbol and timeframe in front of you. One click on [ Apply Best ] draws entry, Stop Loss and Take Profit at the exact prices
SkyHammer Signal Pro Professional No-Repaint Trend Signal Indicator with Locked Entry, SL and TP Levels SkyHammer Signal Pro is a structured trend and momentum signal indicator designed for traders who want clear, fixed, and verifiable trading signals. It works best on lower timeframes such as M1 and M5 . The indicator does not try to predict tops or bottoms. Instead, it waits for confirmed market structure, trend direction, momentum strength, volatility quality, and target space before generati
M1 Quantum MT5
Hamed Dehgani
4.2 (10)
Live Trading Signals Using M1 Quantum : Signal  (Trade executed automatically by the Quantum Trade Assistant , included free with this product.) Latest News : Version 1.64 has been released, All trades now have a Stop Loss placed behind the relevant Support/Resistance zones. The Smart Close function has also been improved to increase the EA’s performance in this version. Since August 9, the live signal has been running on Version 1.64. Price Plan: Current Price: $169 (Early Adopter Offer) Next
Market Structure Order Block Dashboard MT5 is an MT5 indicator designed for traders who want to read market structure and the main price reaction zones directly on the chart. It combines BOS, ChoCH, Order Blocks, Fair Value Gaps (FVG), Liquidity, Kill Zones, Volume Profile, and a compact dashboard for quick analysis. This indicator targets traders who use market structure, ICT and Smart Money concepts as a decision framework. It can help spot trend continuations, possible reversals, price imbala
Currency Strength Wizard   is a very powerful indicator that provides you with all-in-one solution for successful trading. The indicator calculates the power of this or that forex pair using the data of all currencies on multiple time frames. This data is represented in a form of easy to use currency index and currency power lines which you can use to see the power of this or that currency. All you need is attach the indicator to the chart you want to trade and the indicator will show you real s
Scalper Vault   is a professional scalping system which provides you with everything you need for successful scalping. This indicator is a complete trading system which can be used by forex and binary options traders. The recommended time frame is M5. The system provides you with accurate arrow signals in the direction of the trend. It also provides you with top and bottom signals and Gann market levels. The indicator provides all types of alerts including PUSH notifications. PLEASE CONTACT ME A
Smc Pro ToolKit
Talal N Z Aljarusha
5 (13)
SMC PRO TOOLKIT — SMART MONEY ANALYSIS & STRUCTURED TRADE PLANNING SMC Pro ToolKit is a professional Smart Money Concepts analysis workspace for MetaTrader 5. It combines market structure, multi-timeframe analysis, institutional price zones, setup evaluation, confirmation tools, volume context, alerts, and risk planning inside one organized chart environment. One workspace. Multiple layers of confirmation. One structured trading plan. OPEN COMPLETE USER GUIDE MULTI-CONDITION SETUP ENGINE At
More from author
Trade Pause Scheduler keeps your account out of the hours you'd rather sit out. You choose the windows; during one, it cancels pending orders that get placed and closes positions that get opened, and when the window ends everything goes back to normal. It doesn't open trades, choose entries, or send signals. Windows can be set three ways. By economic release: pick the importance (high only, high and medium, or all) and the countries that matter, then say how many minutes before and after a rele
Trade Behavior Mirror reads your own account's closed trade history and counts one specific pattern: opening a new position shortly after a loss, at a lot size larger than your own recent normal. It does not predict, and it does not advise. Every number on the panel is something that already happened on this account. How the numbers are built: it reads up to 31 days of closed deals across every symbol and every magic number - this is an account-wide picture, not a chart-specific one. From the 3
FREE
Multi-Symbol Chase Mirror reads your own account's closed trade history and counts one thing: how many different symbols you opened new positions on. It does not predict, and it does not advise. Every number on the panel is something that already happened on this account. How the numbers are built: it reads up to 31 days of closed deals across every symbol and every magic number - this is an account-wide picture, not a chart-specific one. Symbols traded today counts the distinct symbols with at
FREE
Hourly Spread Profile reads your own account's closed bars and shows, hour by hour, what the spread actually cost on the symbol and timeframe you have open. It does not predict, and it does not advise. Every number on the panel already happened. How the numbers are built: for each of the 24 server-time hours it takes the median spread across up to 5,000 closed bars, whichever the terminal holds. Median, not average, so one wide spike during a news release does not relabel a whole hour. An hour
FREE
Drawdown Guard watches your account against loss limits you set, and closes what needs closing when a limit is reached - that's all it does. It doesn't decide when to buy or sell, and it doesn't give advice. Set a daily loss limit, a total loss limit, or both. As the loss nears a limit, the tool warns you; once the limit is reached, it closes any position or pending order that opens from that point on, and - only if that option is turned on - the positions already open as well. It's worth sayi
You place the stop; the panel works out the size. Risk Lock Trade Panel is a manual trading panel for MetaTrader 5 that sizes every order from the risk you set, sends it with the stop already attached, and manages the position from the same window. It does not open trades on its own, does not give advice, and does not send signals. Enter your risk as a percent of balance or equity, or as a fixed amount, and set the stop distance in points - or press Show line and drag the stop line on the chart
Most risk tools work on the whole account: trip one limit and every EA on it stops, even the ones that did nothing wrong. EA Circuit Breaker works on one EA at a time - its own row, its own four limits, its own outcome. By default nothing closes or stops, and it places no order of its own on a real account. = EA Circuit Breaker Account 75584608 Hedging JPY Today -242056.00 Open 4 / 0.27 lots NAME TODAY OPEN LIMIT STATE Trend bot -19200.00 0/0.00 -22725.48 [#####-] WARN Range bot -61250.00 0/0.0
Most panels show only trades they placed, or the chart's own symbol. Trade Control Center puts every position and pending order - manual, phone, another terminal, any EA - into one table, across every symbol. Nothing closes or stops until a button is pressed or a limit and action are set. TRADES = Trade Control Center Trades Guards Guards Account OK [###---] EA 69 Window OFF Today (comm/swap incl.) -15162.00 Open 11 / 0.40 lots Pending 1 Group: None All Buys Sells Losing Winning Symbol EA    

Backtest Reality Check reads a Strategy Tester report and measures ten things in it, then measures the same ten things on the live trades the expert behind that report has since taken in your account, and sets the two side by side. Until the live side reaches 30 closed trades, the gap is not called a difference: it is still printed, and the panel says on screen that there are too few trades to judge it. It places no orders, and it modifies and closes nothing; there is no trading call anywhere in
CALCULATED VALUES, NOT RECOMMENDATIONS The prices drawn here are calculated values, not recommendations, and the panel says so at all times. When nothing is drawn, the panel says why. You set one session start time. The high and low of the minutes that follow are the opening range, drawn as a box labelled Opening range. The indicator then waits for a bar closing beyond it by a margin taken from ATR. The first such bar in each direction gets an arrow and four reference prices. No orders are pla
Runaway Guard
Wataru Tsuboya
Runaway Guard measures rate only: how many deals, how quickly, from which source. It acts when a rate you set is exceeded, and it does not rank, score or judge any expert. Each crossing writes one file holding the real deal tickets, to match against your terminal history. FOUR RATE LIMITS Rolling windows: at every check the tool looks back over the last 5 or 15 minutes and counts again from scratch. Set any limit to 0 to switch that metric off. - Deals in the fast window: 20 in 5 minutes. - R
Gold ADX ATR Dashboard marks the closed bar where a pullback inside an ADX trend has finished. Two standard indicators and nothing else: ADX(14) for direction, ATR(14) for size. There is no threshold, period or multiplier to set. Those inputs do not exist. Every number the rule needs is measured on your own account, and every one of them is printed on the chart. It draws. It does not trade. No orders are opened, modified or closed. WHAT THE PANEL SHOWS Gold ADX ATR Dashboard Account calibrat
Gold EMA RSI Alignment reads M5, M15, H1 and H4 on gold, and marks the first closed bar on which all four point the same way. Every row of its panel says which bar it read: a higher timeframe bar closed long before the bar you are watching, and a row with no time on it points at the wrong candle. When the four do not agree, the Blocking line names each timeframe still out of line, and repeats the three readings that held it back: whether its close sits above or below EMA50, the sign of its slop
Gold Net Range Signals draws an arrow on a closed bar when its move cleared the last 20 bars after the spread on that bar was subtracted. No repainting, no thresholds to set, and no other indicator used - only the open, high, low and close of closed bars, and the spread recorded on each. It draws; it does not trade. The panel shows the subtraction it just made, and when no arrow is printed it names what is missing: body 260 - spread 40 = 220 net, needs > 1933. WHAT THE PANEL SHOWS Gold Net Ra
Trading Cost Ledger reads this account's own closed deal history and adds up exactly two things: commission and swap. It does not predict and it does not advise. Every figure it shows already happened on this account. SETUP 1. Drag the EA onto any chart. The symbol and timeframe do not matter - it reads the whole account, not the chart. 2. A panel appears in the top-left corner and fills in from the first tick. 3. The CSV report is written automatically at startup. Its full path is printed on t
Trading Discipline Trend Dashboard reads this account's own closed deal history and reports four measured patterns for this week against last week, plus a day-by-day row. It does not predict and it does not advise. Every figure already happened on this account. SETUP 1. Drag the indicator onto any chart. The symbol and timeframe do not matter - it reads the whole account, not the chart. 2. One panel appears in the top-left corner and fills in from the first tick. 3. All three alerts are off by
Contract Change Watch reads this account's own broker-connected symbol settings and records them the moment they change. It does not predict and it does not advise. Every entry in its log already happened - a value this account's broker actually set was different a moment ago. WHY THIS EXISTS A broker can change a symbol's swap rate, stop level, volume step, margin requirement or six other settings at any time, without a notice you will see in the terminal. The specification dialog always shows
Order Type Ledger reads this account's own order history - not its trade history - and counts what happened to every order that was placed. It does not predict and it does not advise. It never looks at trade results; it only counts outcomes: filled, cancelled, expired, rejected. WHY THIS EXISTS Most trading tools only look back at trades that filled. A pending order that expired untouched, a stop order that got rejected, an order that sat for hours before it filled - none of that shows up in a
Trade Duration Profile reads this account's own closed-trade history and shows how long positions were actually held - as a distribution, not a single average. It does not predict and it does not advise. It never looks at trade results; it only measures time. WHY THIS EXISTS Most traders have a rough idea of their own style - "I'm mostly a scalper", "I tend to hold a while" - but no real number behind it. The account's history tab lists trades one by one; it never adds up how long they were act
Weekend Hold Report reads this account's own closed-trade history and counts how often positions were carried across a weekend - as a plain count, by symbol, and by how long those weekend-crossing positions were held. It does not predict, judge or advise, and it never looks at trade results; it only counts and times. WHY THIS EXISTS Carrying a position across the weekend is rarely a deliberate plan - it is something a trader notices only after the fact. The account's history tab lists trades on
Partial Close Tracker reads this account's own closed-trade history and counts how often positions were closed in more than one step - as a plain count, a rate, and how many steps those partial closes typically took. It does not predict, judge or advise, and it never looks at trade results; it only counts. WHY THIS EXISTS Closing half a position to lock something in, then managing the rest, is a habit many traders intend to follow but rarely check against. The account's history tab lists trades
Stop Distance Ledger reads this account's own closed-trade history and shows how often a stop-loss or take-profit was actually set when a position was opened, and how far away it was placed - as a percentage of the opening price. It does not predict, judge or advise, and it never looks at trade results; it only measures what was set. WHY THIS EXISTS Deciding to always set a stop-loss before entering a trade is a rule many traders intend to follow, but rarely check against. The account's history
Margin Usage History reads this account's own closed-trade history and shows how much of the account balance was typically committed as margin at the moment each position was opened - as a percentage. It does not predict, judge or advise, and it never looks at trade results; it only measures how much of the account was put on the line each time. WHY THIS EXISTS The same lot size means something very different depending on how large the account balance is at the time. If the balance shrinks and
Tick Value Reference reads every symbol on this account's Market Watch and lines them up side by side by how much a single 1.00-lot tick is worth in this account's own currency. It does not calculate lot sizes, place trades or judge risk - it only shows what the terminal already knows about each symbol, arranged so the differences between symbols are easy to see. WHY THIS EXISTS The same 1.00 lot means something very different depending on the symbol. A tick on a FX major can be worth a few cen
Filter:
No reviews
Reply to review