Trade Duration Profile
- Utilities
- Version: 1.10
- Updated: 6 September 2026
- Activations: 10

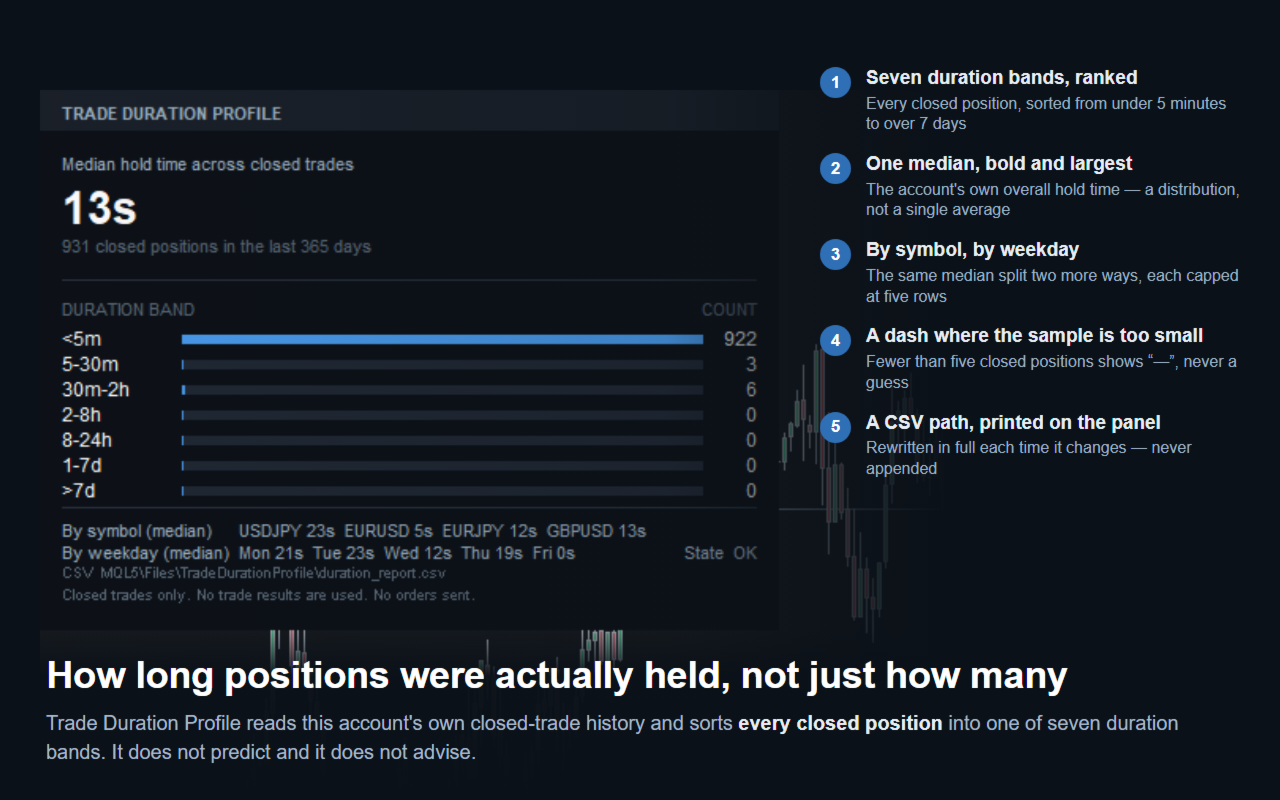
Trade Duration Profile reads this account's own closed-trade history and shows how long positions were actually held - as a distribution, not a single average. It does not predict and it does not advise. It never looks at trade results; it only measures time.
WHY THIS EXISTS
Most traders have a rough idea of their own style - "I'm mostly a scalper", "I tend to hold a while" - but no real number behind it. The account's history tab lists trades one by one; it never adds up how long they were actually held, which symbols get held longest, or whether Monday trades run longer than Friday ones. "My median hold is 42 minutes, but XAUUSD alone is closer to three hours" is a fact this account already has - it is just never counted.
SETUP
1. Drag the EA onto any chart. The symbol and timeframe do not matter - it reads the account's whole closed-trade history, not the chart it is running on.
2. A panel appears in the top-left corner and fills in from this account's own history.
3. It recalculates only when the number of closed deals changes, checked every 60 seconds. Nothing needs to be started or configured.
4. Nothing else is required. There are no numeric settings to tune.
INPUTS (four, in this order)
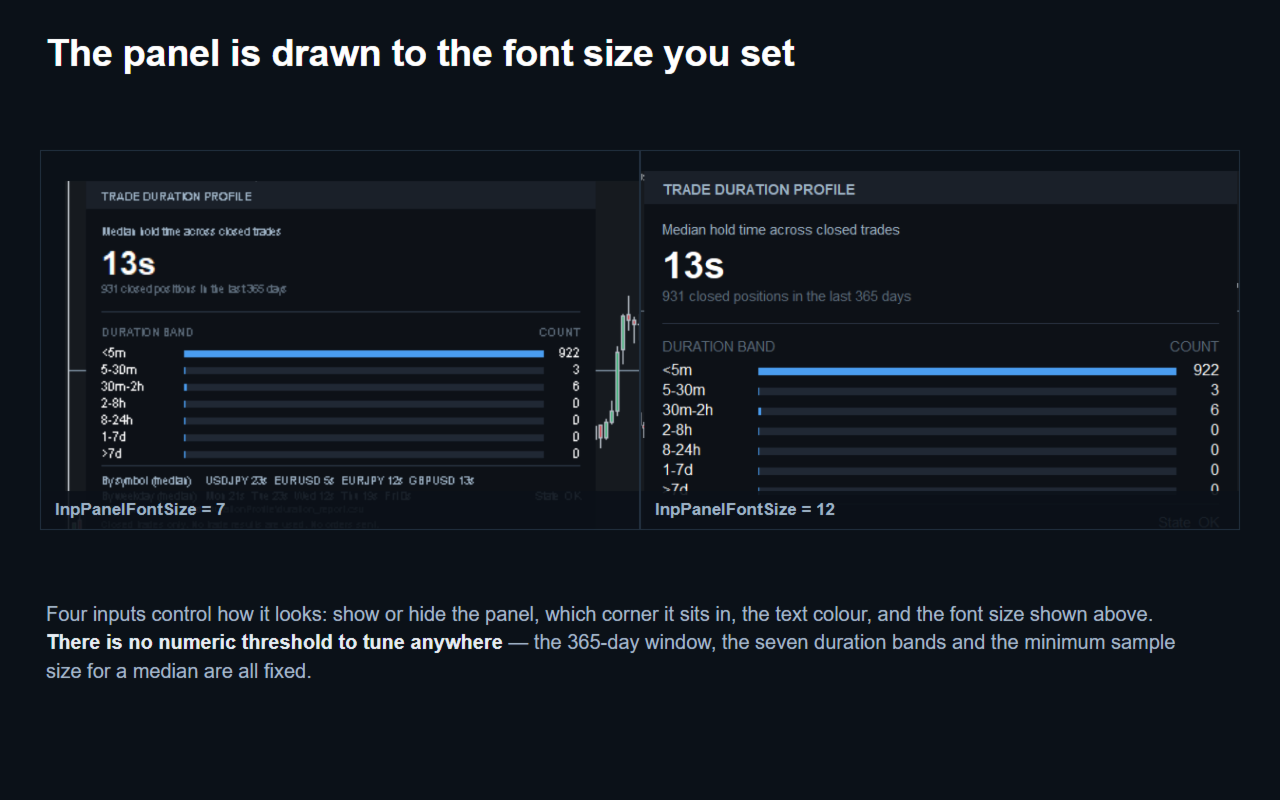
- InpShowPanel (true) - show or hide the panel.
- InpPanelCorner (top-left) - which of the four chart corners the panel sits in.
- InpPanelFontSize (9) - panel text size. Display only.
- InpColorText (white) - panel text colour.
There is no numeric threshold anywhere. The 365-day window, the seven duration bands, and the minimum sample size for a median are all fixed and cannot be changed.
WHAT THE PANEL SHOWS
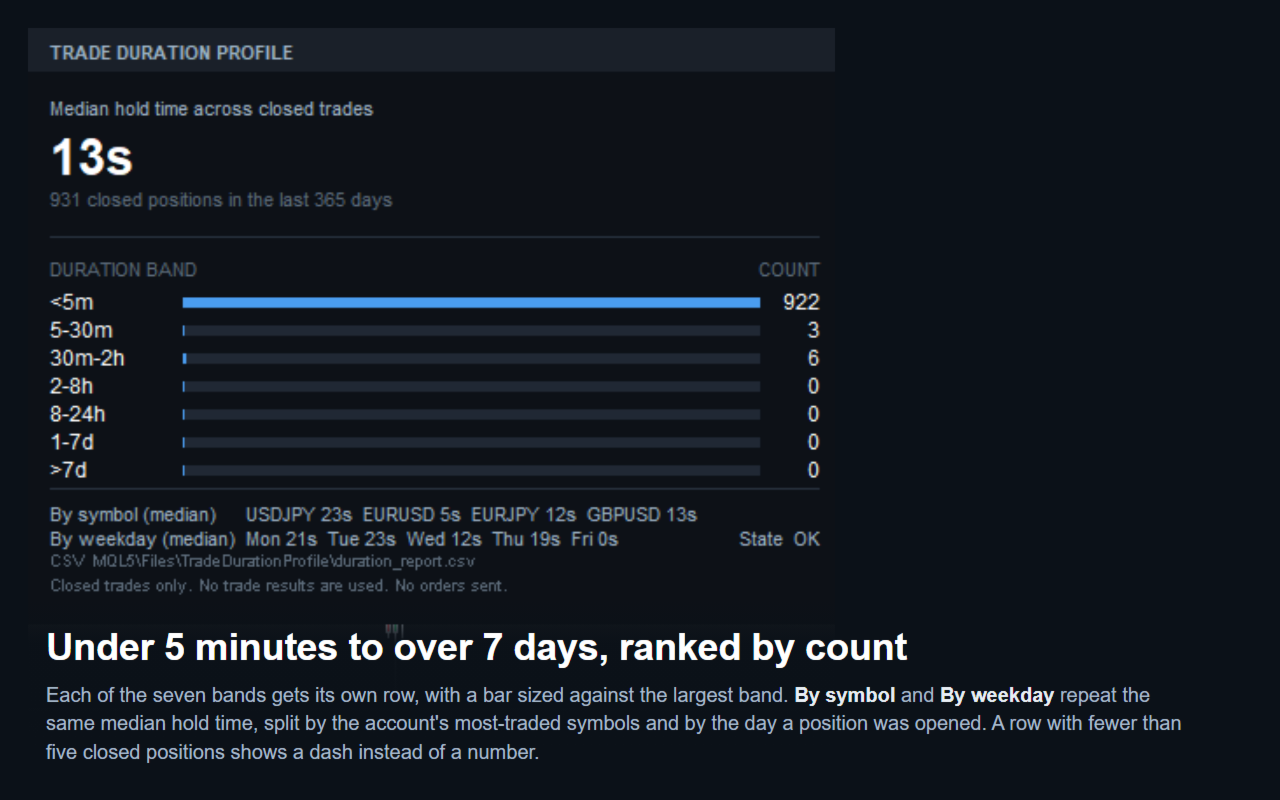
Every closed position from the last 365 days is placed into one of seven bands by how long it was held, open to close: under 5 minutes, 5 to 30 minutes, 30 minutes to 2 hours, 2 to 8 hours, 8 to 24 hours, 1 to 7 days, and over 7 days. The panel shows the count in each band next to the account's overall median hold time.
Below that, By symbol lists the median hold time for the account's most-traded symbols (up to five, by trade count; anything beyond that is not shown rather than guessed at). By weekday breaks the same median down by the day the position was opened - Monday through Friday. A symbol or weekday with fewer than five closed positions shows a dash instead of a number - too small a sample to mean anything.
THE REPORT FILE
A CSV file is written to MQL5\Files\TradeDurationProfile\duration_report.csv, broken down by month with three kinds of rows - an overall row, one row per symbol, and one row per weekday - with columns: Month, Symbol, Weekday, Count, MedianDurationSeconds. It is rewritten in full each time, not appended, so it never contains duplicates. Its full path is printed on the panel.
BEFORE YOU TEST IT
The Strategy Tester only has the closed-trade history from that one test run, so what you see there reflects the test period, not this account's real trading history. It is useful for confirming the EA runs without errors, not for reading its numbers as if they were real account data.
WHAT IT DOES NOT DO
It never places, closes or modifies a trade - it has no connection to the trade side of the terminal at all. It does not use trade results anywhere - only when a position opened and when it closed. It does not include open positions - only fully closed ones count, so nothing here reflects a trade that is still running. It does not judge whether a hold time is too long or too short, and it does not suggest changing how long you hold a trade. It reads one account on one terminal, going back only as far as this account's own trade history reaches.