Hourly Spread Profile
- Indicators
- Version: 1.0

Hourly Spread Profile reads your own account's closed bars and shows, hour by hour, what the spread actually cost on the symbol and timeframe you have open. It does not predict, and it does not advise. Every number on the panel already happened.
How the numbers are built: for each of the 24 server-time hours it takes the median spread across up to 5,000 closed bars, whichever the terminal holds. Median, not average, so one wide spike during a news release does not relabel a whole hour. An hour with fewer than 20 samples prints a dash and the count instead of a number - a median from three bars is not a fact worth publishing. Bars with no spread recorded at all are dropped rather than counted as zero cost, and an hour with no bar anywhere in the history says so in plain words instead of guessing.
Cheapest and Most costly name the three lowest and three highest hours measured, and the same hour never appears in both lists. On a symbol whose spread never moves, the two lists collapse into one line that says so, instead of ranking 24 identical numbers.
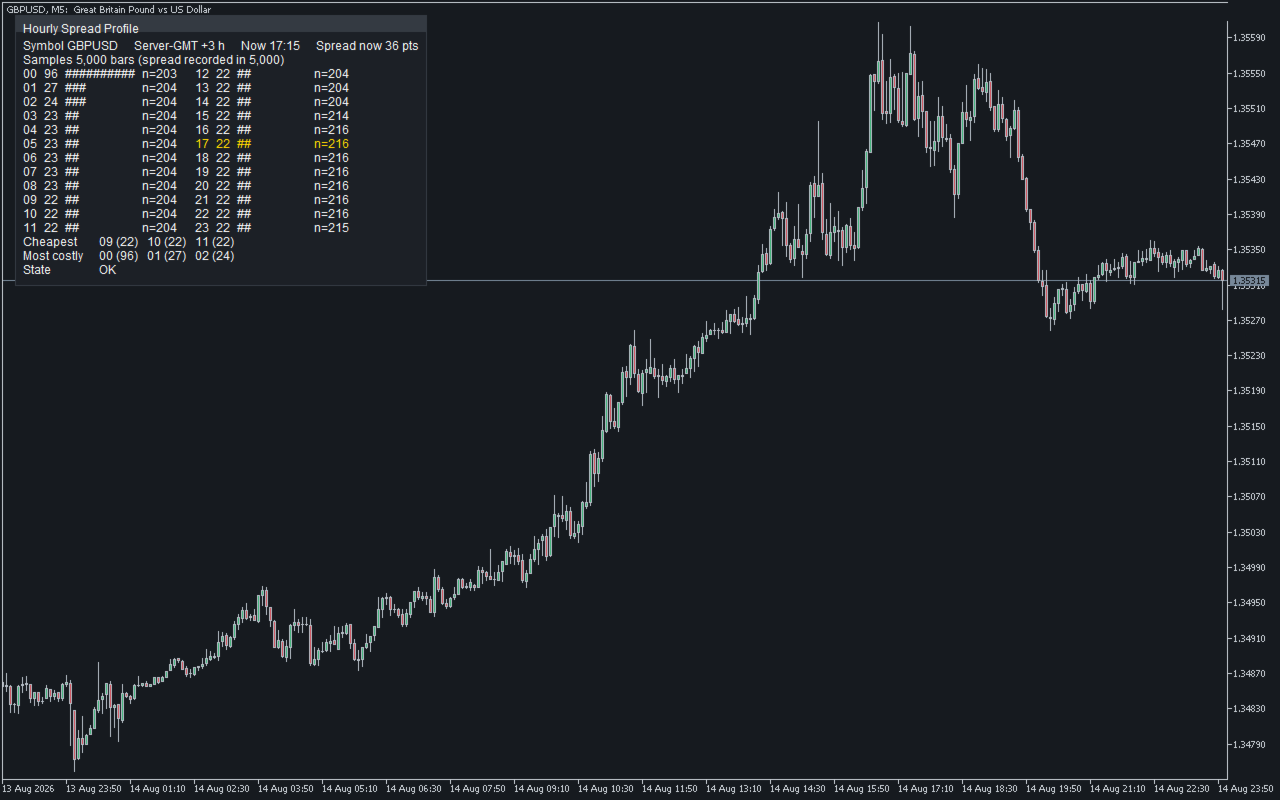
Screenshot 1, GBPUSD M5, one demo account: hour 00 measures 96 points while every hour around it sits in the low-to-mid 20s. That gap is what this panel exists to show - a measurement on this account, not a claim about every broker or every account.
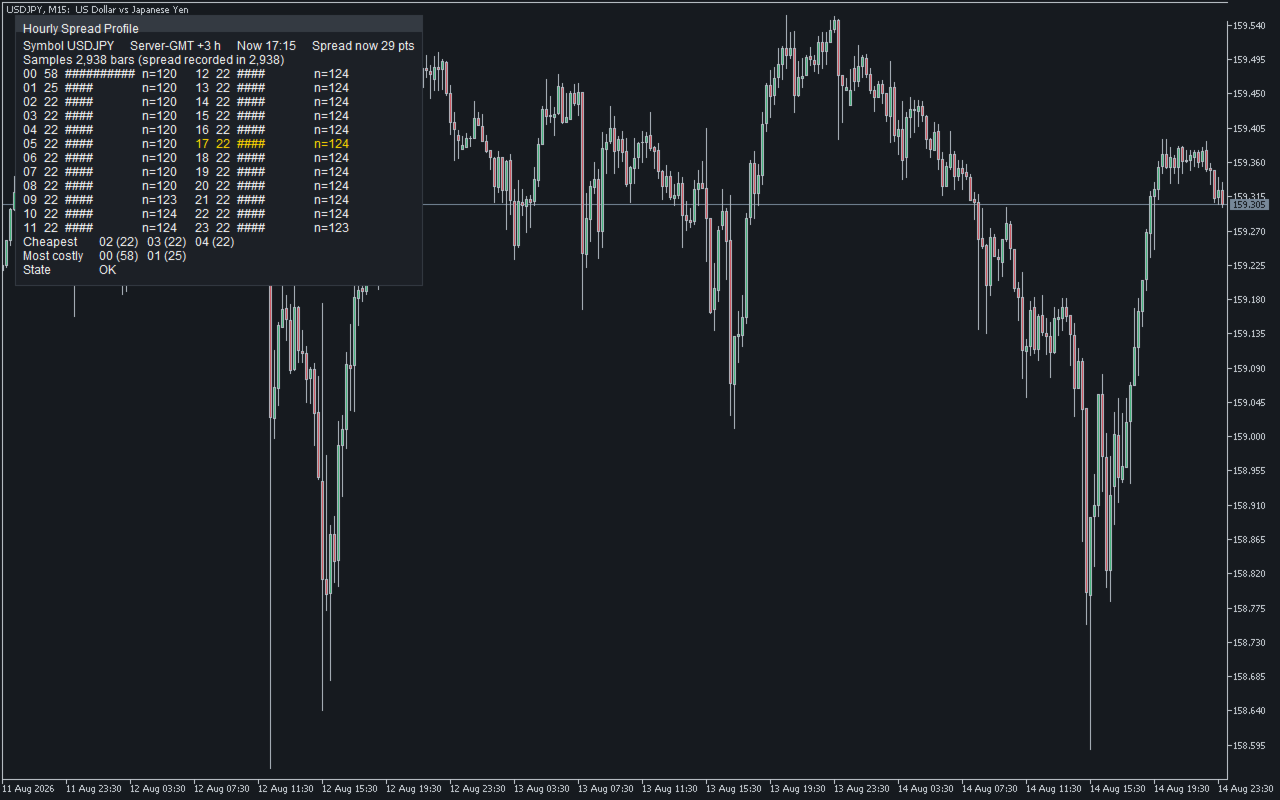
Two things worth reading before comparing hours across charts. First, the lookback is fixed at 5,000 bars, so the calendar span behind the panel depends on the chart's own timeframe: a few days on M1, roughly a year on H1, close to two decades on D1. The Samples line always states how many bars went into it, and how many of those carried a recorded spread - screenshot 2 (USDJPY M15) shows a newer history at 2,938 bars, still measured the same way. Second, some instruments price with a fixed spread. There the panel measures 24 identical numbers and prints "All hours are the same" rather than a false ranking - that is the broker's pricing, not a gap in the count.
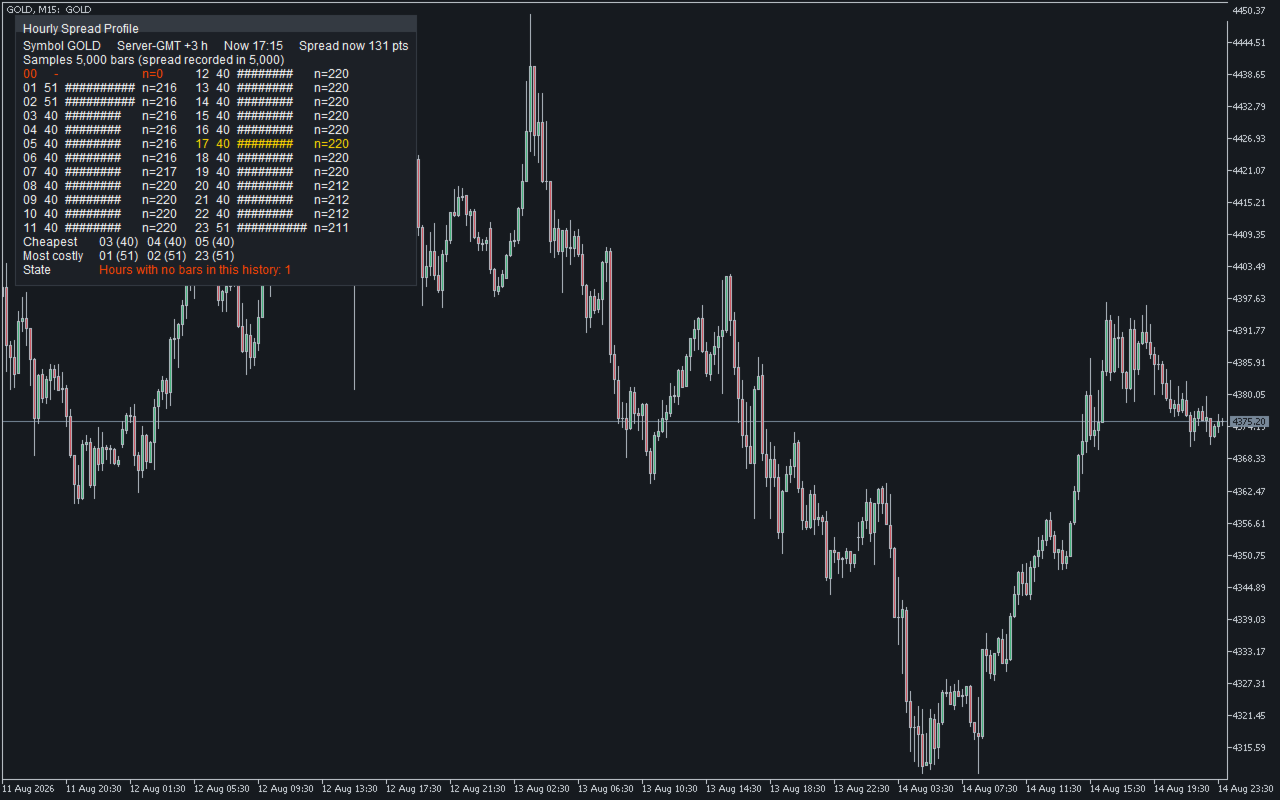
Screenshot 3, GOLD M15: hour 00 shows a dash and n=0 - not "not enough samples," but no closed bar at all in that hour on this history, and the State line names it (Hours with no bars in this history: 1) instead of leaving a blank row. Screenshot 4, EURUSD H1, 5,000 bars: at one bar per hour that is roughly 310 days of history, and Most costly still returns a single hour rather than repeating one that already sits in Cheapest.
What it does not do: it never places, closes or modifies an order - it has no connection to the trade side of the terminal at all. It uses no technical indicator - ADX, RSI, moving averages, none of that; the only inputs are each closed bar's own spread and timestamp. It reads only the chart's own symbol and timeframe, nothing else. It does not tell you which hour to trade - what an hourly cost difference is worth to a strategy is the trader's call, never the panel's. And the Server-GMT line only states the current gap between the trade server's clock and GMT; it does not correct for it, so a broker's daylight-saving shift moves that number rather than the hours in the table.
Six inputs, all of them about how the panel looks, none about what it measures: show or hide the panel, its corner, font size, text color, the color for the current hour, and the color for a warning row. There is no threshold, period or multiplier anywhere in the settings, because there is nothing here to tune - load it on any symbol and timeframe and read that account's own history.
Plenty of free indicators already show today's current spread. This one is different: it measures closed history, hour by hour, rather than just the instant on screen. An hour with too few samples is never hidden - it is marked with a dash. A bar with no recorded spread is never folded in as zero cost. Loading it is simple: drop it on any symbol and timeframe and the panel fills in with that account's own measured history, no setup and nothing to learn first.
This is one of a small set of free, no-advice measurement tools from the same author. The other three read account history rather than spread: Trade Behavior Mirror, which shows entries placed shortly after a loss, Win Streak Size Creep Mirror, which tracks lot size growth during a run of wins, and Multi Symbol Chase Mirror, which counts how many different symbols new positions were opened on. The author's MQL5 profile lists these free tools together with several paid MT5 indicators and utilities for gold-specific signals, trade risk limits and backtest-versus-live auditing, for traders who want more building blocks beyond this free measurement tool.
Free, with no reduced or trial version behind it - what is described above is the whole tool.