Backtest Reality Check
- Utilitários
- Versão: 1.0
- Ativações: 10

Backtest Reality Check lê o relatório salvo pelo Testador de Estratégia, mede o que está dentro desse arquivo e aplica as mesmas funções ao que o mesmo robô fez de fato na sua conta, para mostrar as duas medições lado a lado na mesma tela. Enquanto a conta não chegar a 30 negócios fechados, a coluna das diferenças fica acinzentada e a própria tela avisa que ainda não dá para tratar aquilo como diferença: os números continuam à vista, mas não recebem esse nome. A ferramenta não abre, fecha ou modifica posições e não envia ordem nenhuma: não há nenhuma chamada a funções de negociação no código-fonte.
O que significa uma marcação
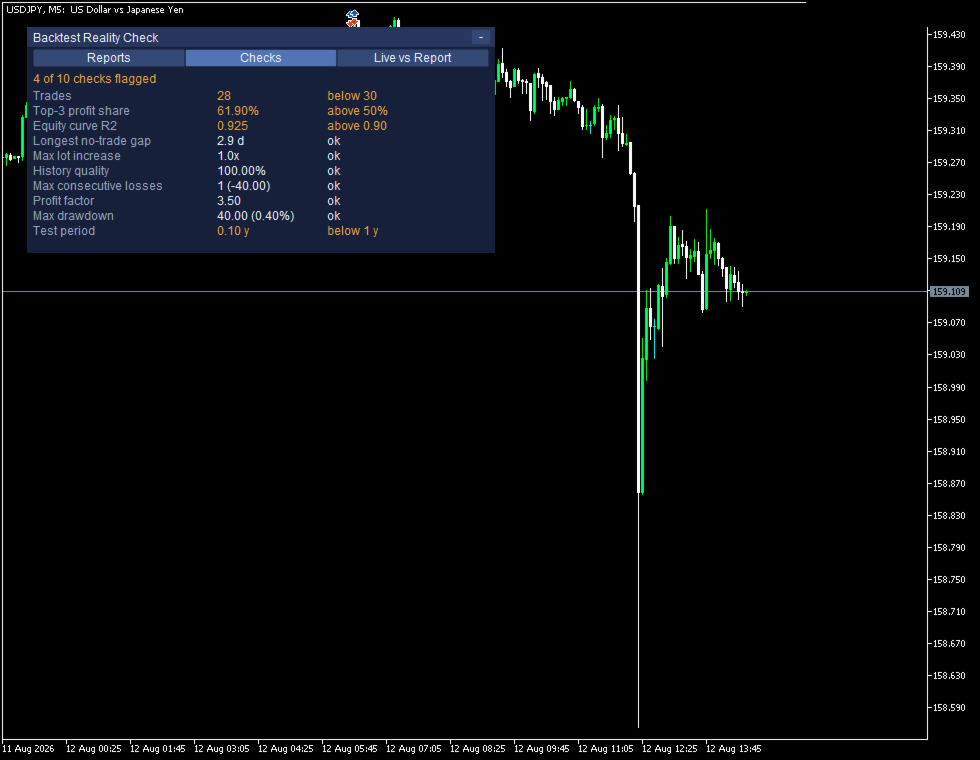
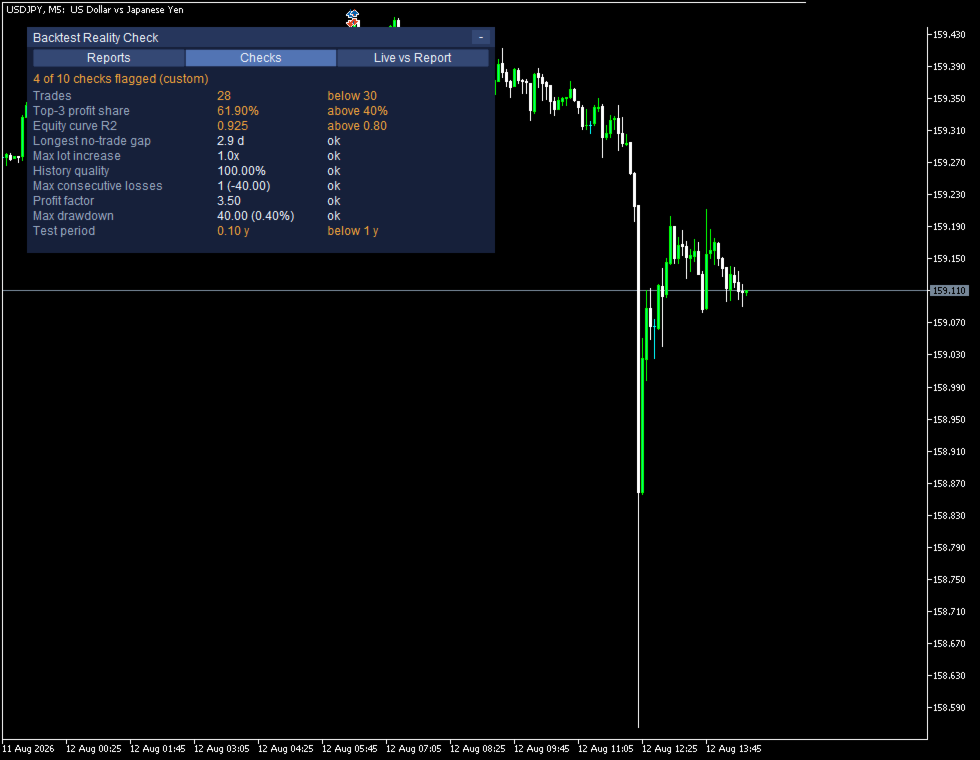
Nos itens que têm uma linha de referência, a marcação diz uma coisa só: o valor medido passou daquela linha. A ferramenta não afirma que o robô é bom nem que ele é ruim, e não sabe por que o número ficou daquele jeito, já que o overfitting, a mudança de mercado, a diferença entre corretoras e a simples sorte deixam marcas parecidas. É medição, não é julgamento.
A conta ao lado do relatório
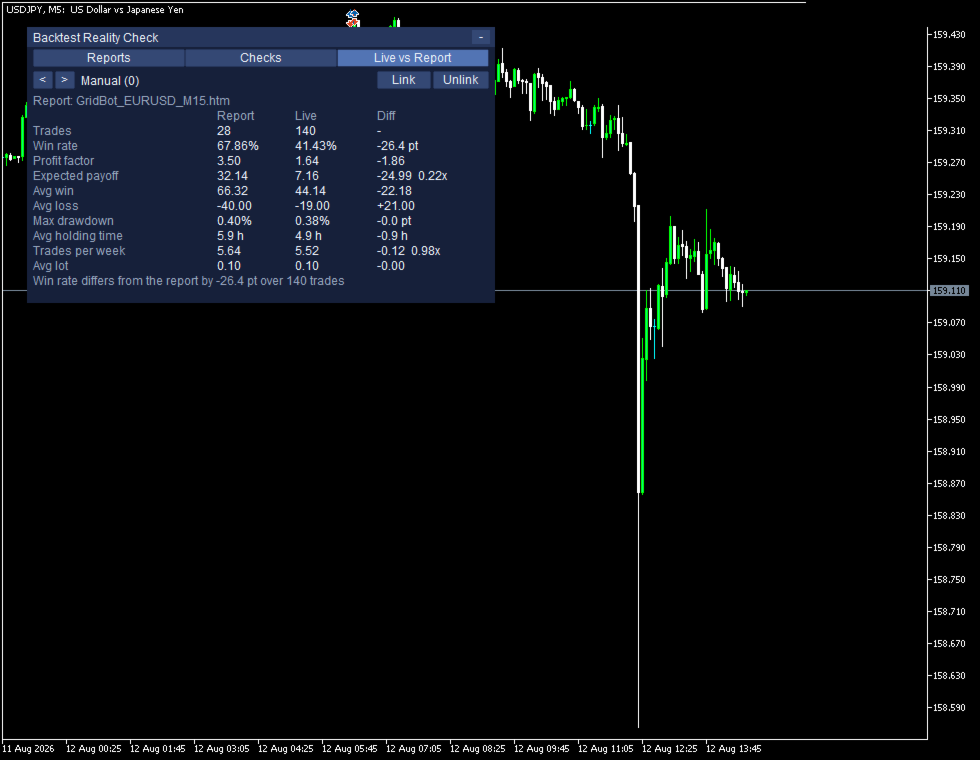
Manual (0) Link Unlink
Report: GridBot_EURUSD_M15.htm
Report Live Diff
Trades 28 140 -
Win rate 67.86% 41.43% -26.4 pt
Profit factor 3.50 1.64 -1.86
Expected payoff 32.14 7.16 -24.99 0.22x
Avg win 66.32 44.14 -22.18
Avg loss -40.00 -19.00 +21.00
Max drawdown 0.40% 0.38% -0.0 pt
Avg holding time 5.9 h 4.9 h -0.9 h
Trades per week 5.64 5.52 -0.12 0.98x
Avg lot 0.10 0.10 -0.00
Win rate differs from the report by -26.4 pt over 140 trades
A aba Live vs Report põe as duas medições na mesma linha. A ferramenta reorganiza os negócios da conta na mesma estrutura usada para ler o relatório e só depois passa tudo pela mesma função de medição. Não são dois cálculos escritos em dois lugares diferentes: para um lado divergir do outro, seria preciso mexer na função que os dois usam. A linha Trades é a única que fica sem diferença, porque um teste de vários meses e algumas semanas de conta real não têm por que resultar no mesmo número de negócios, e a subtração ali não diria nada. Nas linhas em que a divisão diz mais que a subtração, ela vem ao lado: divida o valor da coluna Live pelo da coluna Report e você chega ao número que está logo à direita. A distância entre dois percentuais é expressa em pontos percentuais, e não em porcentagem, porque a diferença entre dois percentuais não é um percentual. Os robôs são detectados automaticamente, sem que você precise configurar nada: a ferramenta reúne os números mágicos presentes no histórico da conta e monta uma linha para cada um. Os negócios que não trazem número mágico ficam numa linha chamada Manual (0), porque, vistos de fora, uma ordem enviada por uma pessoa e um robô que ficou sem número mágico não se distinguem.
Quando ainda não dá para falar em diferença
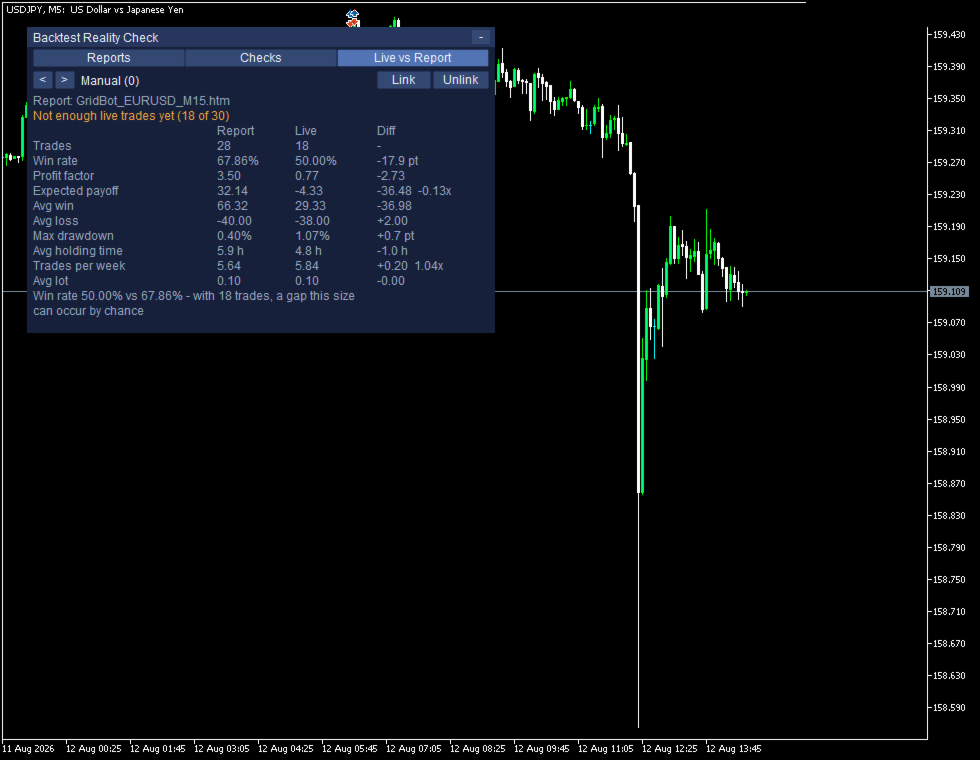
Not enough live trades yet (18 of 30)
Win rate 50.00% vs 67.86% - with 18 trades, a gap this size can occur by chance
Enquanto a conta não chegar a 30 negócios, os números ficam acinzentados - as colunas Report e Live junto com Diff - e a tela exibe a mensagem Not enough live trades yet. Os números não ficam escondidos, porque esconder também seria uma forma de faltar com a verdade: continuam onde estão, apenas sem o nome de diferença. A linha Win rate recebe um tratamento próprio, que não é o de passar ou não passar de um limite. O erro padrão sai da proporção medida no relatório e da quantidade de negócios da conta, e é multiplicado por 1,96, o valor usual em um teste bilateral. Enquanto a distância entre as duas proporções couber nessa faixa, a ferramenta a trata como algo que pode acontecer por acaso. Quem tem as duas telas à frente refaz essa conta sozinho: as duas usam o mesmo relatório como referência, de modo que o que muda a largura da faixa é a quantidade de negócios reais. Na tela com menos negócios, a faixa é mais larga que a distância entre as duas proporções, e por isso a mensagem diz que uma distância desse tamanho pode aparecer por acaso. Na tela com mais negócios, a faixa fica mais estreita que a distância, e então a mensagem deixa de citar o acaso e apenas relata a distância medida. Dizer que ainda não dá para responder é parte do que esta ferramenta se propõe a fazer; uma ferramenta que tem sempre uma resposta pronta não está medindo coisa alguma.
Como salvar o relatório para que ele seja lido
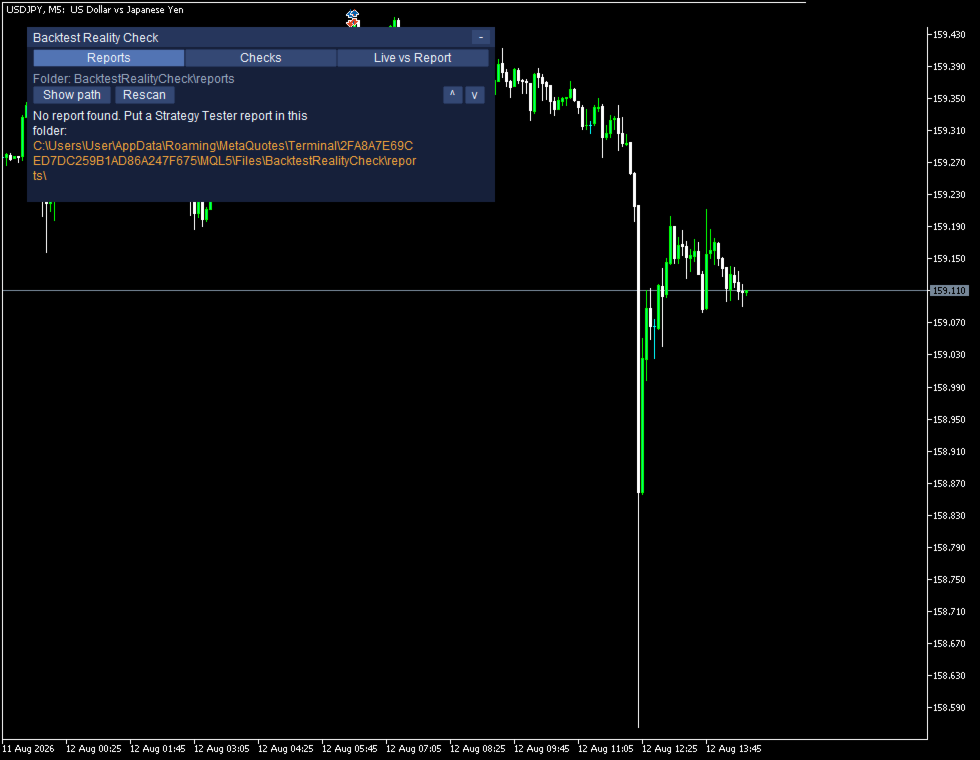
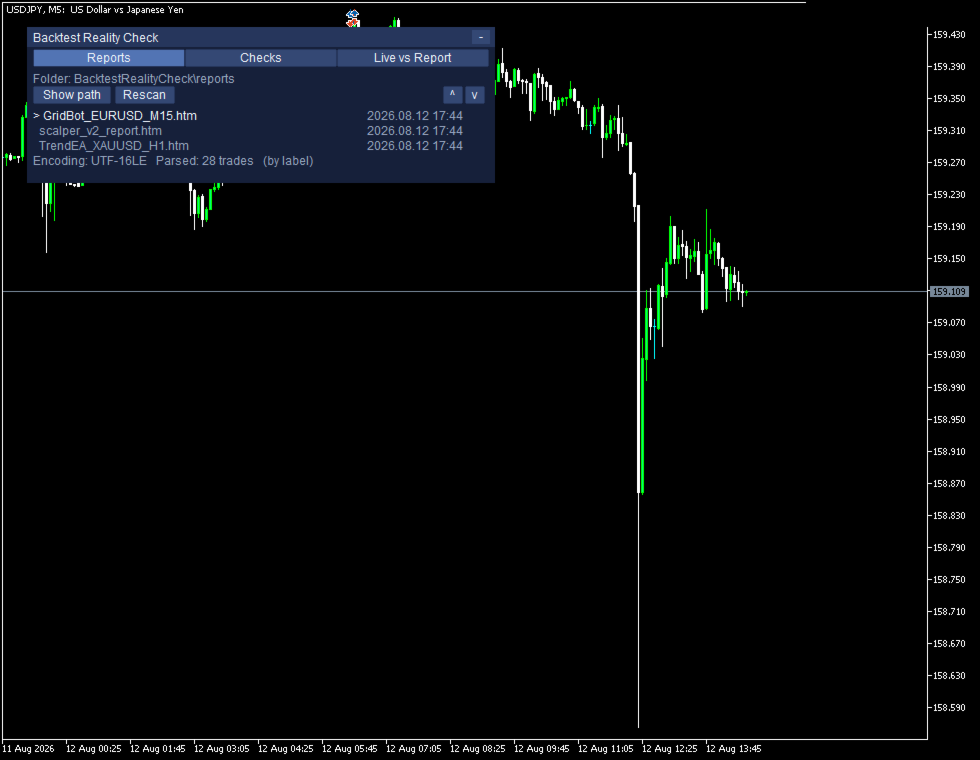
Na hora de salvar o relatório do Testador de Estratégia, aparecem dois formatos, HTML e XML, e nenhum dos dois vem marcado: escolha HTML, porque é esse o arquivo que a ferramenta abre. O que o terminal salva como XML é, na verdade, uma planilha compactada que esta versão não lê; em vez de deixar o arquivo sumir da lista sem explicação, a ferramenta varre a pasta, mostra o nome do arquivo na tela e o motivo ao lado dele. Os relatórios ficam em MQL5\Files\BacktestRealityCheck\reports, uma pasta criada assim que a ferramenta é iniciada, e enquanto ela estiver vazia o caminho completo da pasta aparece na tela, para que você saiba exatamente onde salvar.
O que é lido e o que sai do seu computador
Os números vêm do extrato de negócios que está dentro do relatório, e não dos rótulos dos cabeçalhos. É por isso que o mesmo backtest salvo em terminais de idiomas diferentes produz os mesmos números: salve o mesmo teste duas vezes, trocando o idioma do terminal entre um salvamento e outro, e compare as duas telas. A leitura do arquivo acontece no seu computador e nada sai dele, porque não existe uma única requisição de rede no código-fonte.
O que esta ferramenta não faz
- Não abre, fecha ou modifica posições, não envia ordens e não inicia nem interrompe robô algum.
- Funciona em conta hedge; em conta netting, as posições são somadas pelo terminal, e os números de cada robô podem aparecer somados também.
Versão demo grátis
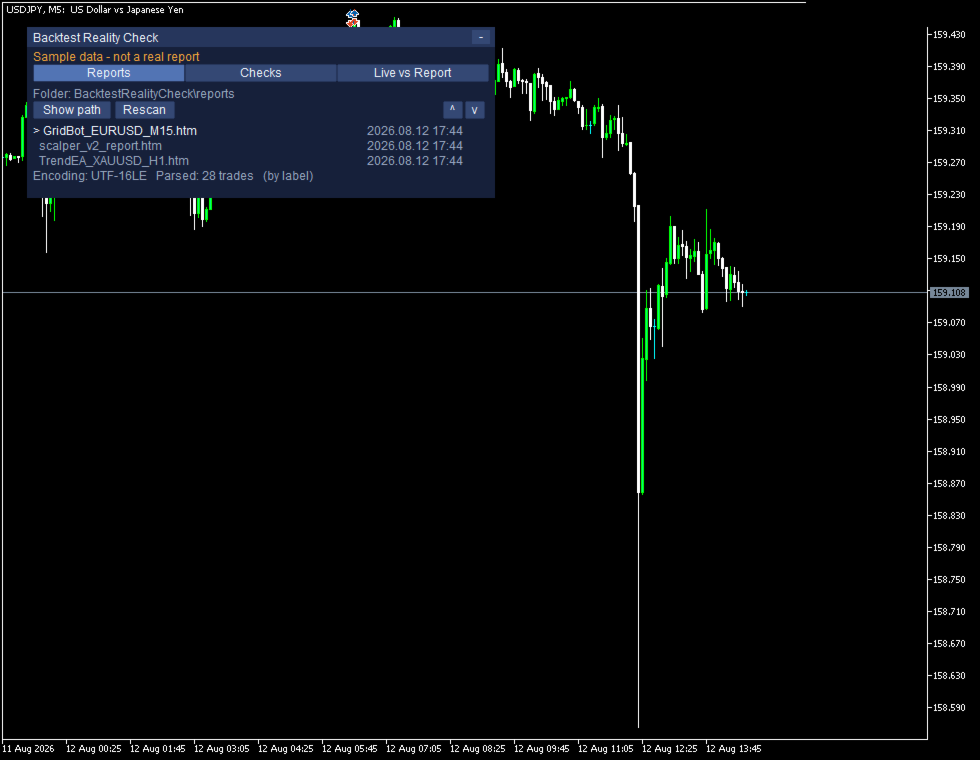
Sample data - not a real report
A versão demo funciona dentro do Testador de Estratégia e já vem com uma amostra embutida, de modo que a tela aparece preenchida no primeiro segundo, mesmo que não haja nenhum relatório salvo no terminal. O aviso de que se trata de uma amostra fica visível o tempo todo, do começo ao fim, e a mesma linha é registrada no diário do terminal, para que nenhum número de exemplo seja confundido com um número seu. Num gráfico real, essa linha nunca aparece.
Parâmetros e ambiente
InpReportFolder InpUseCommonFolder InpRescanSeconds InpMinTradesForStats
InpFlagTopTradeShare InpFlagEquityR2 InpFlagMinTrades InpIncludeSwapCommission
InpHistoryDays InpPanelX InpPanelY InpFontSize InpShowTesterSelfDemo
São treze parâmetros, e todos podem ficar como estão: os valores padrão já servem. É um utilitário do MetaTrader 5 e vai no gráfico como um robô: basta um gráfico livre e uma conta hedge. Antes da publicação, três verificações não encontraram nada: nenhuma chamada a funções de negociação, nenhuma DLL importada e nenhuma requisição de rede. Vale lembrar: esta ferramenta lê negócios que já foram fechados e conta o que está dentro deles; sobre o que ainda vai acontecer no mercado, ela não diz nada, e não promete resultado algum. Operar envolve risco de perda, e o caminho sensato é começar pela versão demo.