Volume Bubble
- Indicators
-
Agus Santoso
 DISCLAIMER ON : The author of EA will not be held responsible for your losses or problems of any kind if the EA is directly or indirectly responsible for any losses.
Our software is provided “as is”, without any warranty or condition of any kind, express, implied or statutory. - Version: 1.0
- Activations: 5
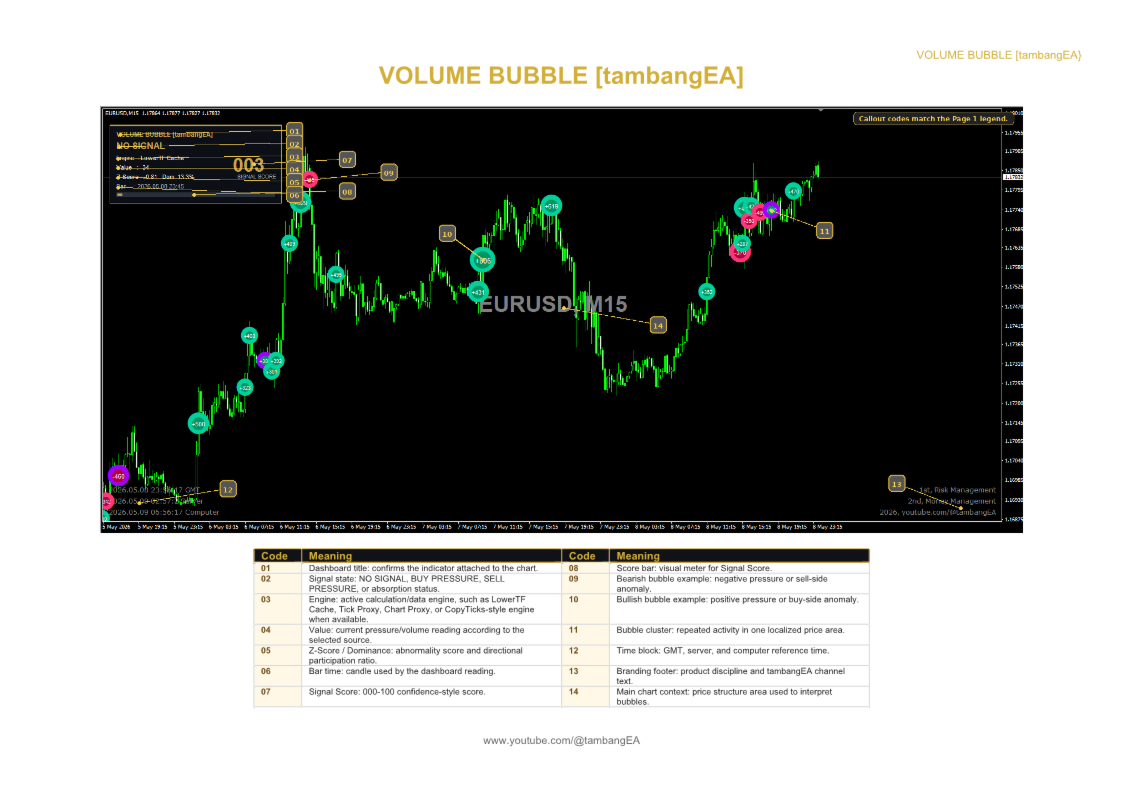
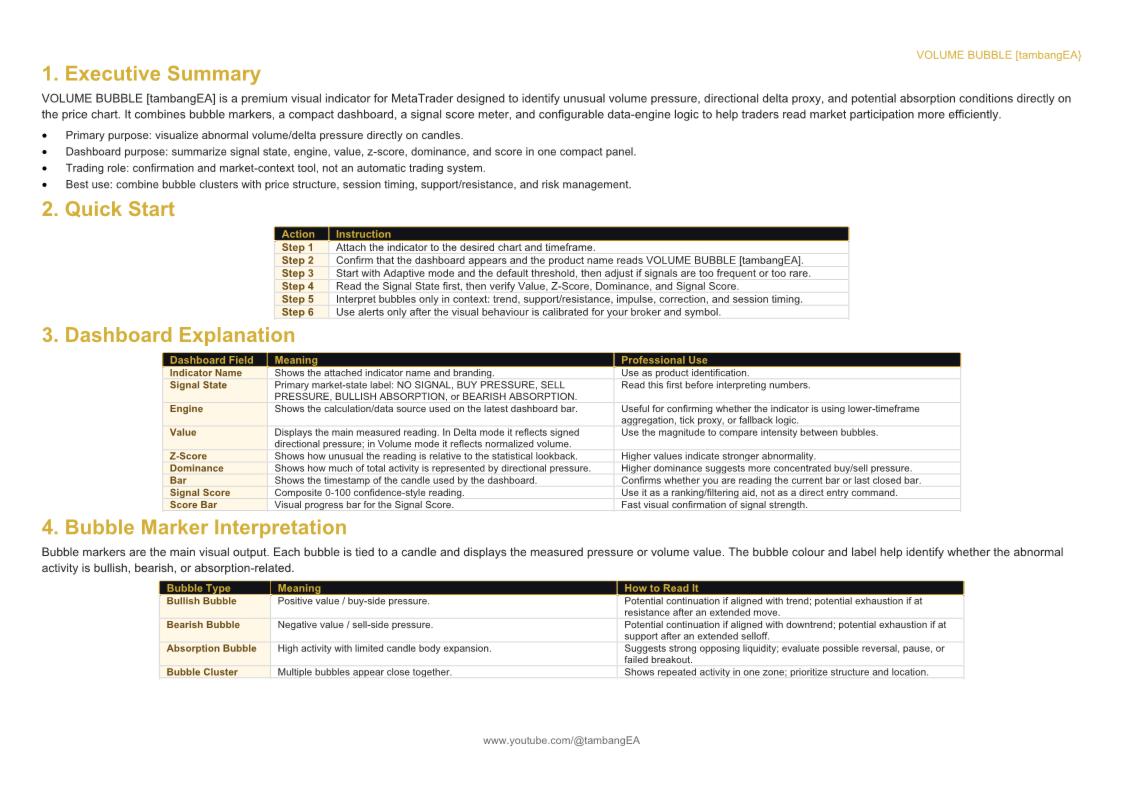
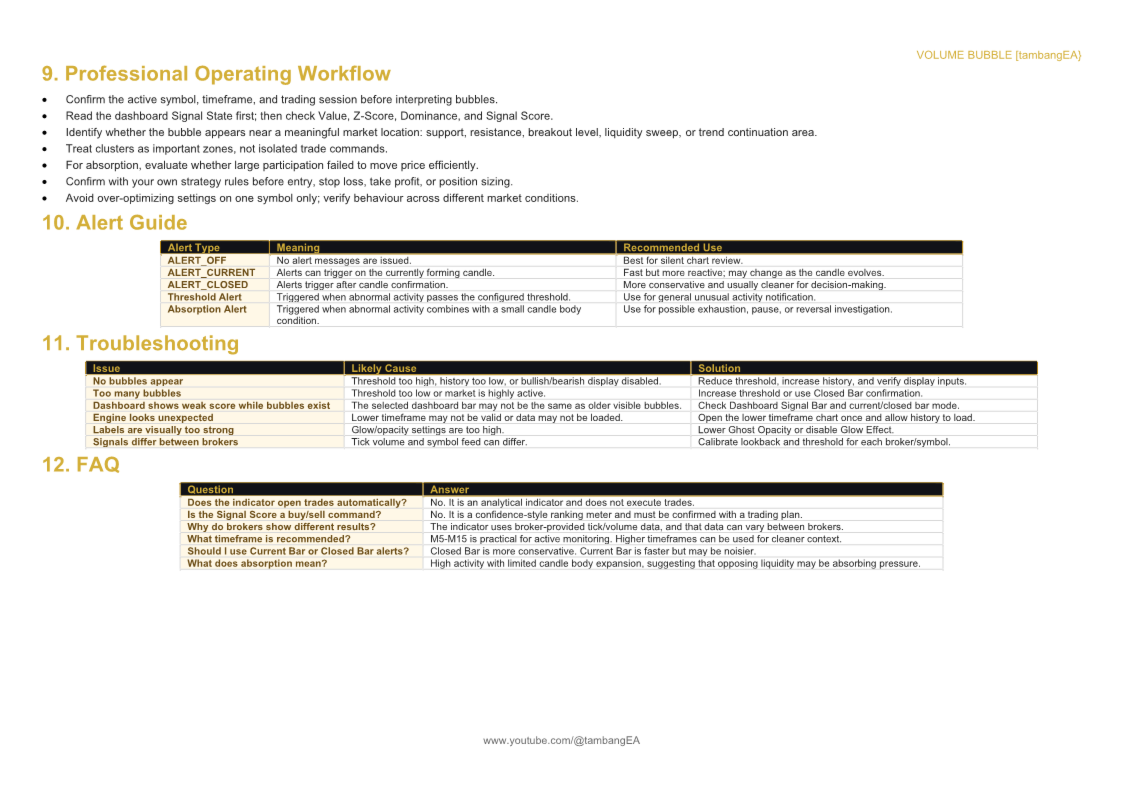
VOLUME BUBBLE [tambangEA] is a premium visual volume-pressure indicator designed to help traders identify unusual market activity directly on the chart.
The indicator detects abnormal delta/volume behavior and displays it as clean bubble markers around price action. Each bubble represents a volume-pressure event, allowing traders to quickly see where strong participation, imbalance, momentum pressure, or potential absorption may appear.
This tool is designed for traders who want a fast visual reading of market participation without needing to manually analyze raw volume data candle by candle.
Main Concept
Most price charts show only price movement. VOLUME BUBBLE [tambangEA] adds another layer: market participation.
The indicator helps answer important questions such as:
Where did abnormal volume appear?
Was the pressure bullish or bearish?
Is the move supported by strong participation?
Is the market showing possible absorption?
Is the current activity statistically significant?
Is the signal strong enough to deserve attention?
The result is a cleaner and more visual way to read pressure behind price movement.
Key Features
Dynamic Volume Bubble Markers
The indicator plots bubble markers directly on the chart when unusual volume or delta-pressure activity is detected.
Bubble labels display the detected value, making it easier to compare activity strength across different candles.
Bullish and Bearish Pressure Detection
The indicator can identify:
Bullish pressure
Bearish pressure
Positive delta pressure
Negative delta pressure
Abnormal volume expansion
Pressure clusters
This helps traders visually separate normal market noise from meaningful activity.
Premium Dashboard
The built-in dashboard provides a compact reading of the current market condition.
Dashboard information includes:
Signal state
Active engine
Current value
Z-Score
Dominance percentage
Bar time
Signal Score
Visual score bar
The dashboard is designed with a clean Dark Luxury style for professional chart presentation.
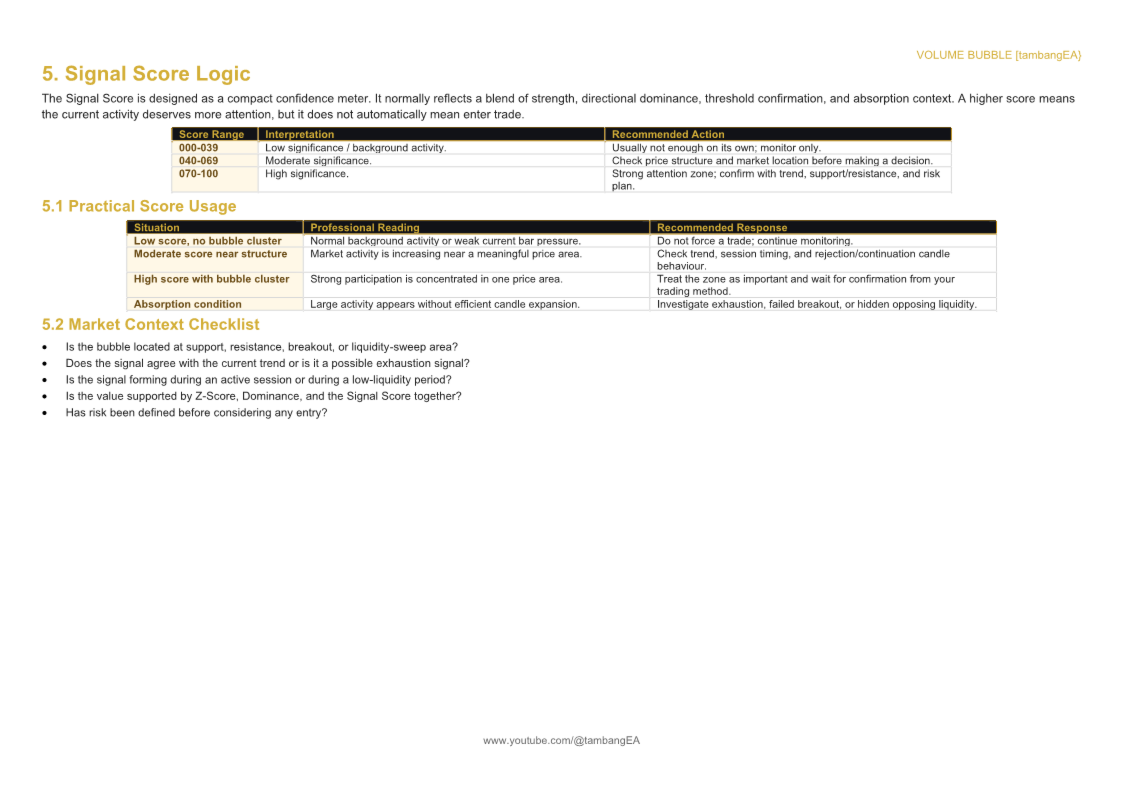
Signal Score
The indicator includes a Signal Score from 0 to 100.
The score is based on several elements, including:
Signal strength
Statistical abnormality
Dominance
Threshold confirmation
Absorption condition
This score is not a trade command. It is a confidence-style reading to help traders rank the quality of the current activity.
Z-Score Based Detection
The adaptive mode uses a statistical z-score model to detect abnormal volume activity relative to recent market behavior.
This makes the indicator more flexible across different symbols and timeframes compared to using only a fixed volume threshold.
Absorption Detection
The indicator can detect possible absorption conditions when strong volume activity appears but candle body expansion remains limited.
This may help identify areas where aggressive buying or selling is being absorbed by opposing liquidity.
Possible use cases:
Exhaustion near highs or lows
Failed breakout confirmation
Hidden support/resistance reaction
Reversal warning area
Institutional-style pressure zone
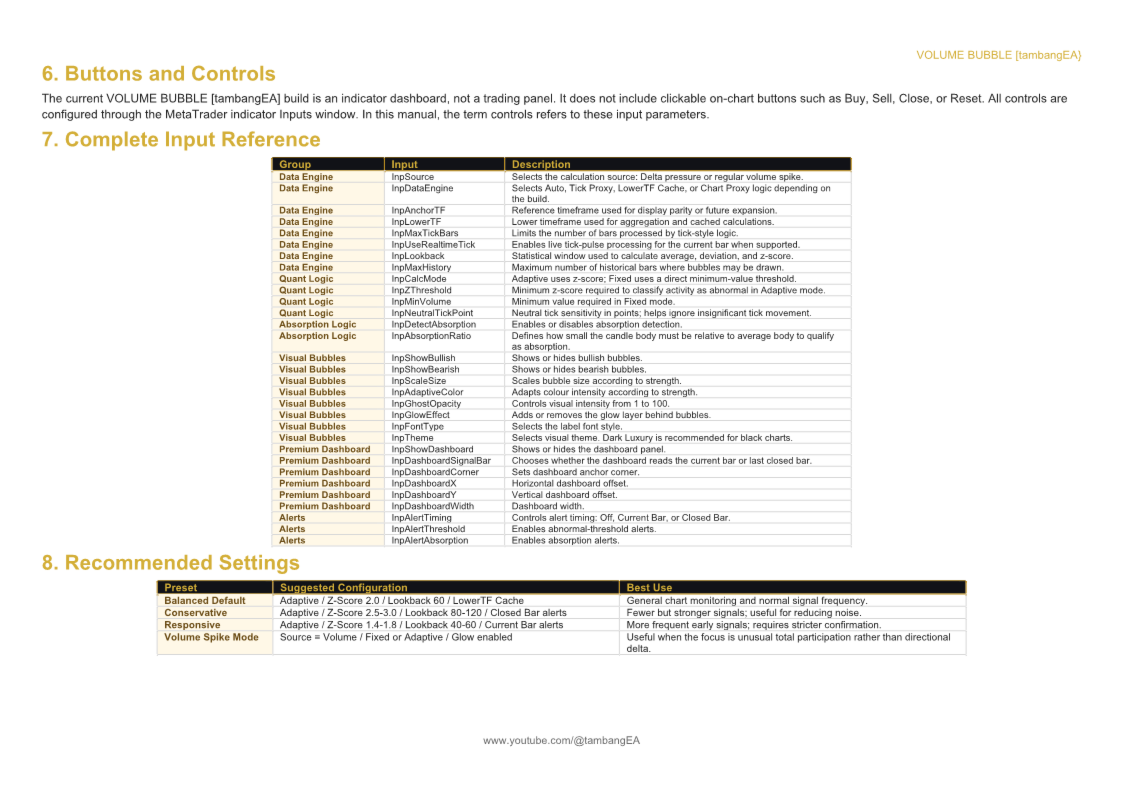
Multiple Engine Logic
Depending on the platform/build and available data, the indicator can use several data approaches such as:
Tick-style pressure logic
Lower timeframe cache
Chart proxy calculation
Adaptive fallback logic
This allows the indicator to remain functional across different broker data environments.
Dashboard Fields Explained
Signal State
Shows the current market condition:
NO SIGNAL
BUY PRESSURE
SELL PRESSURE
BULLISH ABSORPTION
BEARISH ABSORPTION
Engine
Shows the active data engine being used by the indicator.
Value
Shows the current measured pressure or volume value.
Z-Score
Shows how statistically abnormal the current activity is.
Dominance
Shows how much of the total activity is represented by directional pressure.
Signal Score
A 0–100 confidence-style score for fast visual filtering.