FibRadar
- Indicators
- Version: 1.0
- Activations: 5

FibRadar v1 Directional Fibonacci Radar with Daily Rejection Alerts
FibRadar v1 is a directional price action based Fibonacci radar indicator designed to identify market bias high probability zones and intraday rejection signals using Fibonacci geometry daily structure and momentum confirmation.
The indicator automatically analyzes recent price extremes projects Fibonacci based radar circles and enforces strict directional trading rules to keep traders aligned with dominant market pressure.
Core Concept
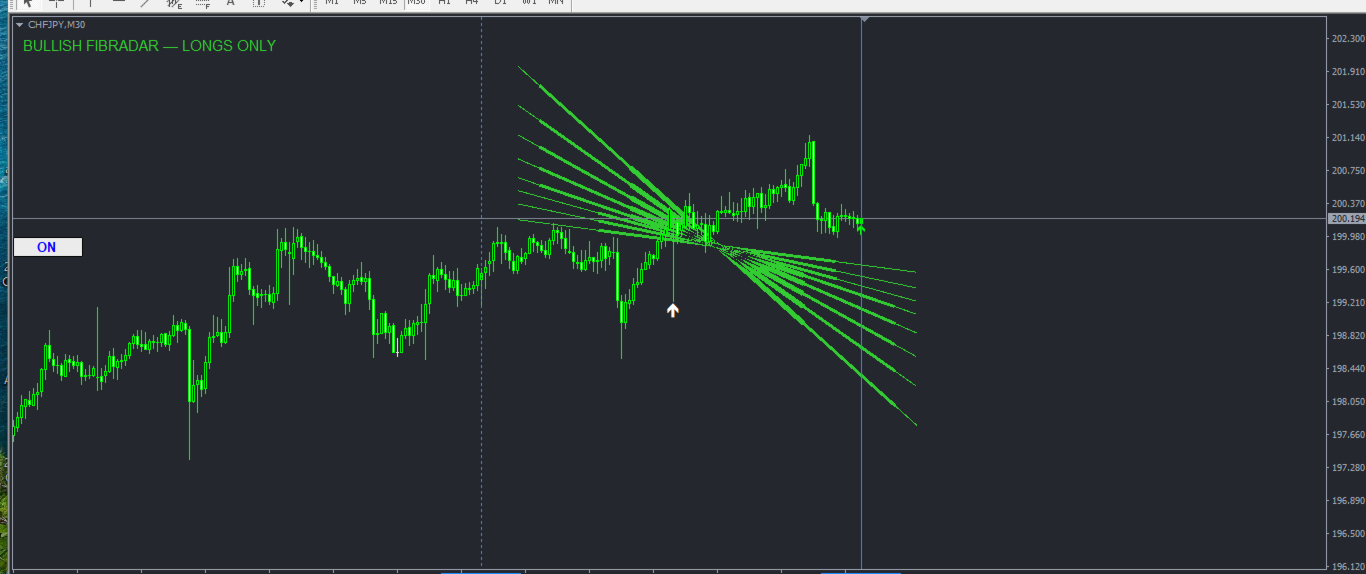
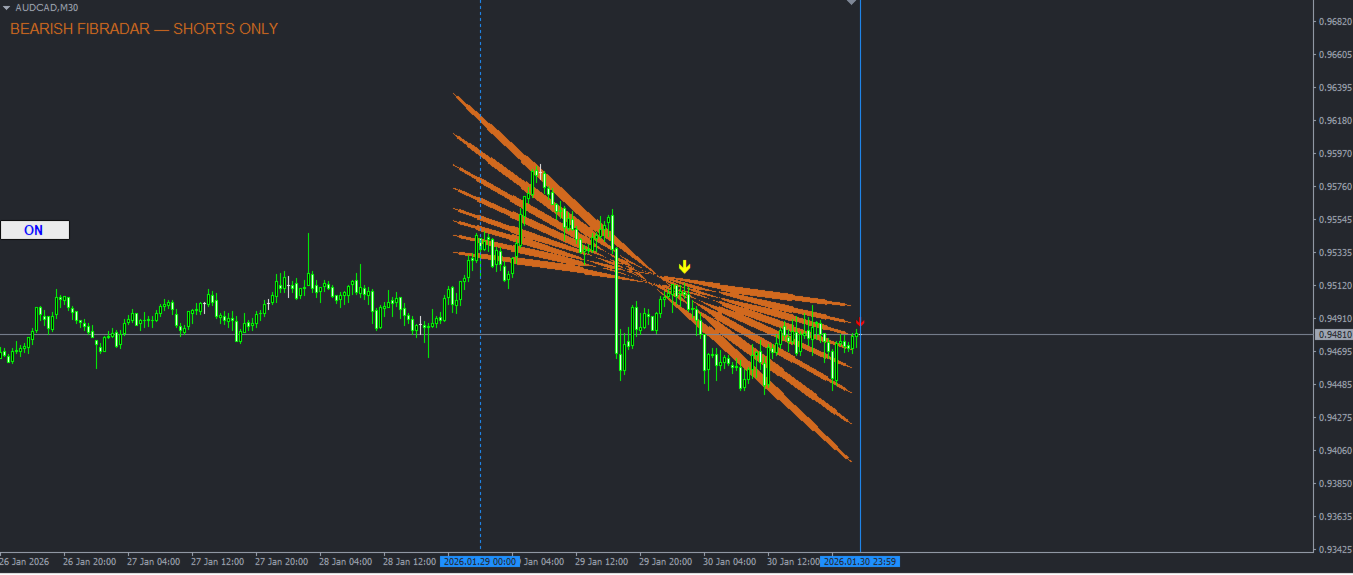
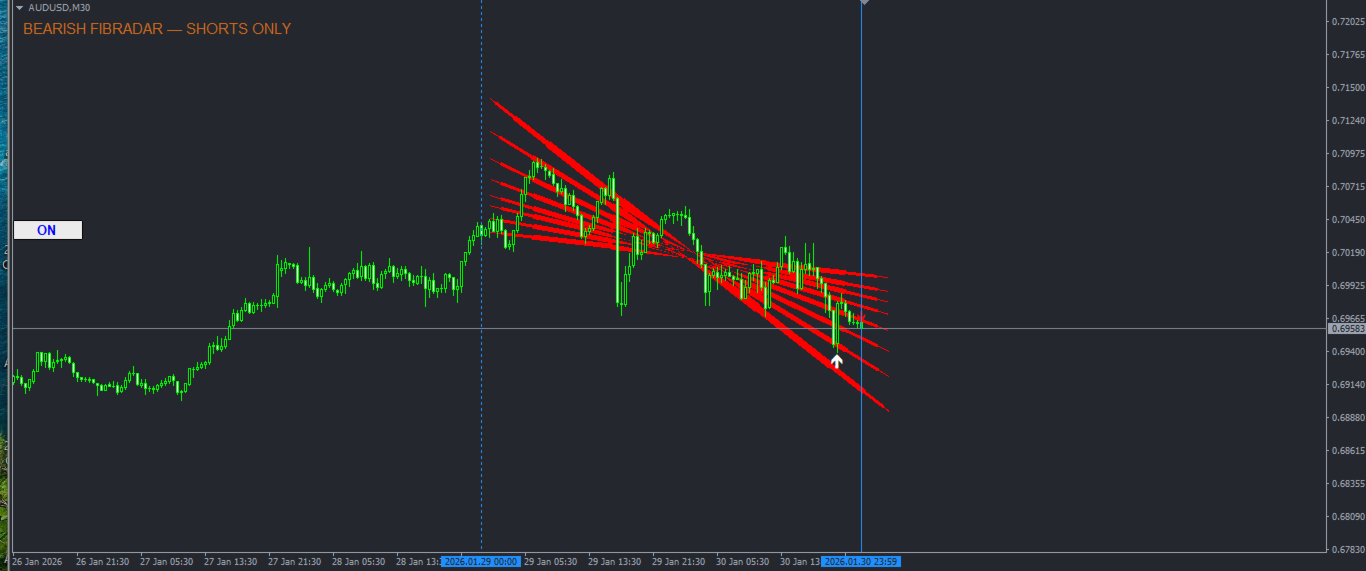
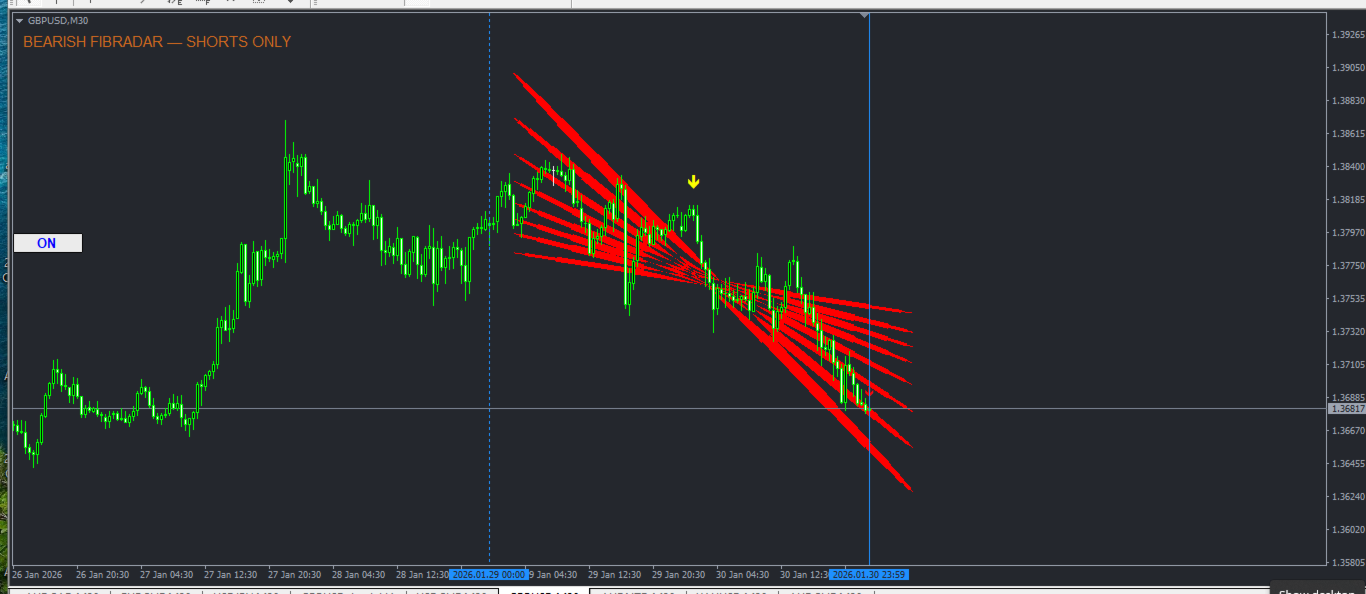
FibRadar works around a dynamic price center calculated from the highest high and lowest low over a user defined lookback period. From this center the indicator projects Fibonacci scaled circular zones that act as visual radar levels for price expansion exhaustion and momentum strength.
At the same time FibRadar determines whether the market is bullish or bearish and only allows signals in that direction.
Fibonacci Radar Circles
Fibonacci ratios used
0.236 0.382 0.5 0.618 0.786 1.0 1.272 1.618
Circles are centered between recent swing high and low
They automatically expand and contract with volatility
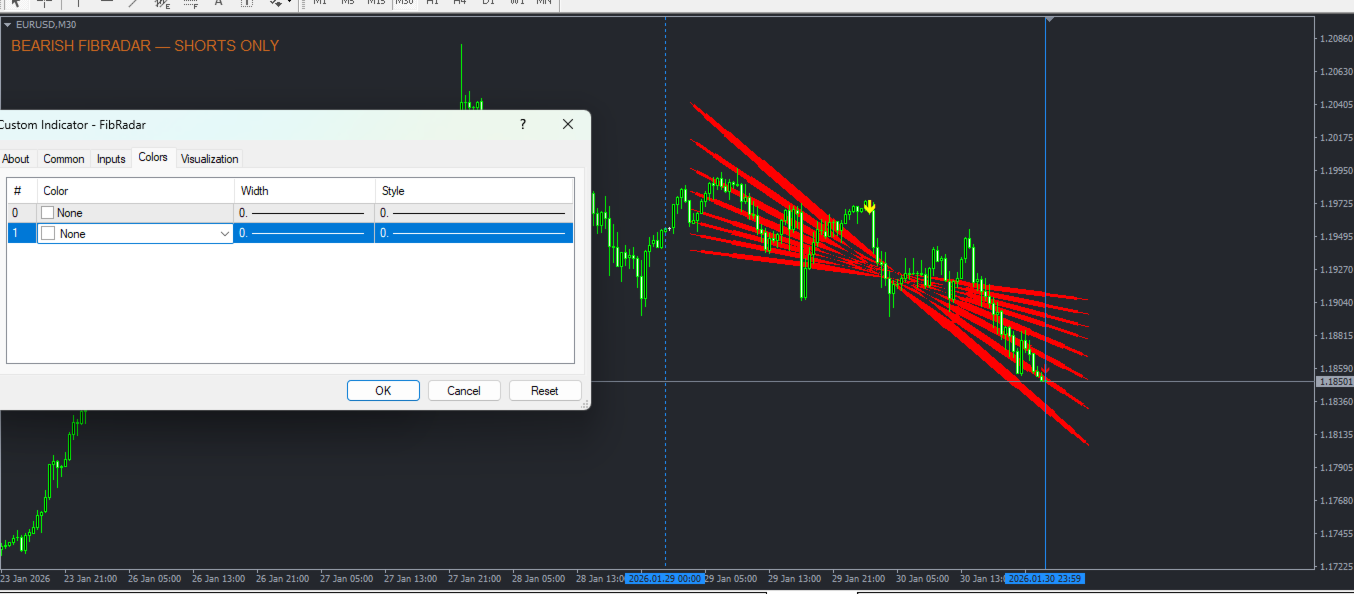
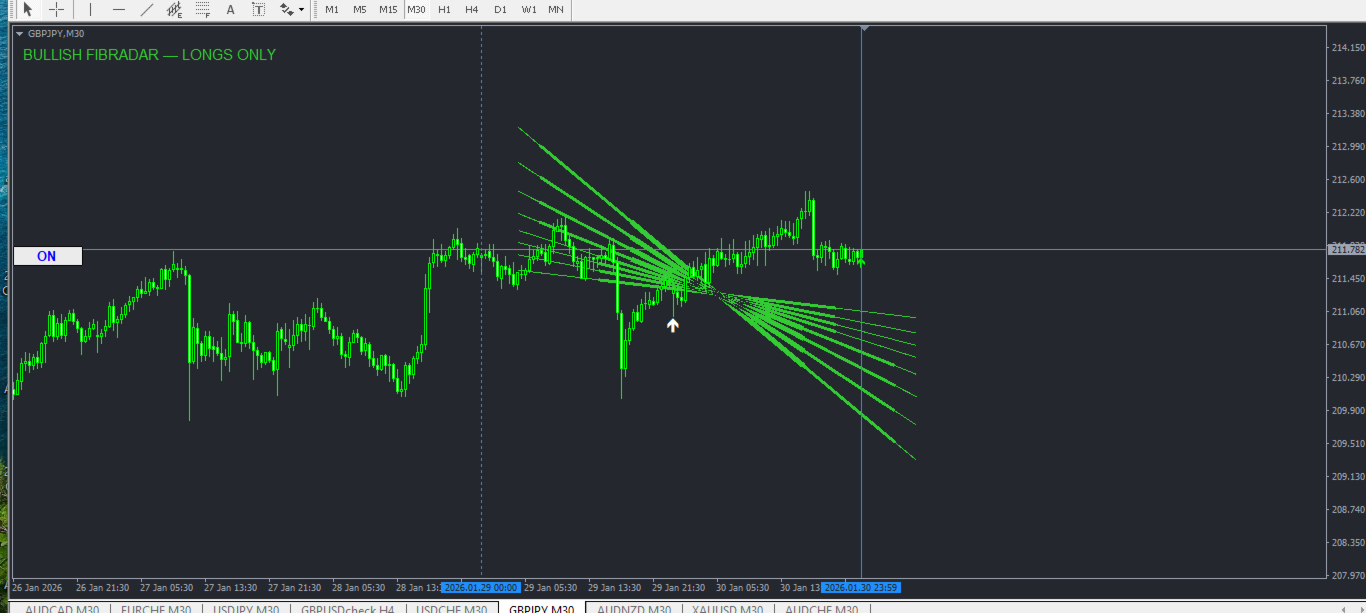
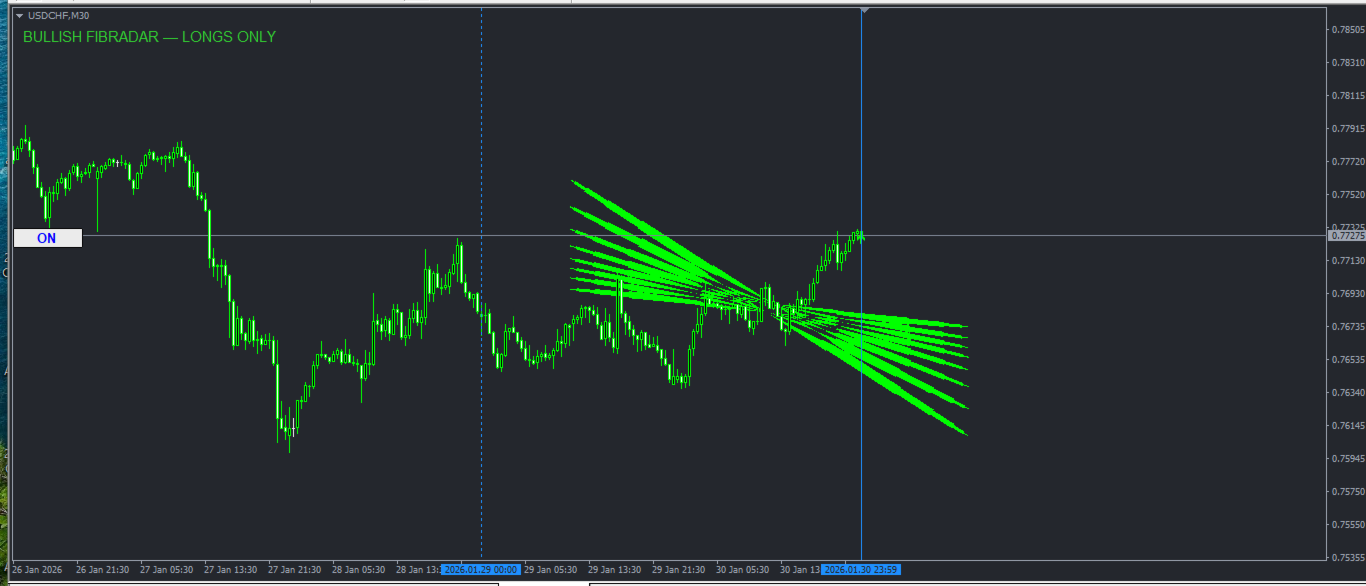
They are colored by directional bias
Bullish uses green tones
Bearish uses red tones
When price extends beyond the 0.618 Fibonacci radius the indicator flags this as a strong directional move and triggers a momentum alert.
Directional Bias Filter
FibRadar constantly evaluates recent market structure to define bias.
Bullish mode allows long trades only
Bearish mode allows short trades only
A clear on chart label displays the current mode and prevents counter trend signals.
Entry Signals
Arrow signals are generated only when price confirms direction relative to the FibRadar center.
Buy signal
Market bias is bullish
Current close is above the FibRadar center
Sell signal
Market bias is bearish
Current close is below the FibRadar center
Alerts can be enabled for real time trade notifications.
Daily Structure and Rejection Detection
FibRadar incorporates daily price action context.
Vertical lines mark the start of the previous trading day and the end of the current trading day.
The indicator scans todays candles only for rejection patterns.
Bearish rejection at the daily high
Bullish rejection at the daily low
Rejection conditions include dominant wick size minimum wick threshold and candle close direction.
Only one rejection signal is allowed per day to reduce noise.
Alerts and Notifications
FibRadar provides alerts for entry signals strong directional momentum and daily high or low rejection events.
Sound alerts are supported when enabled.
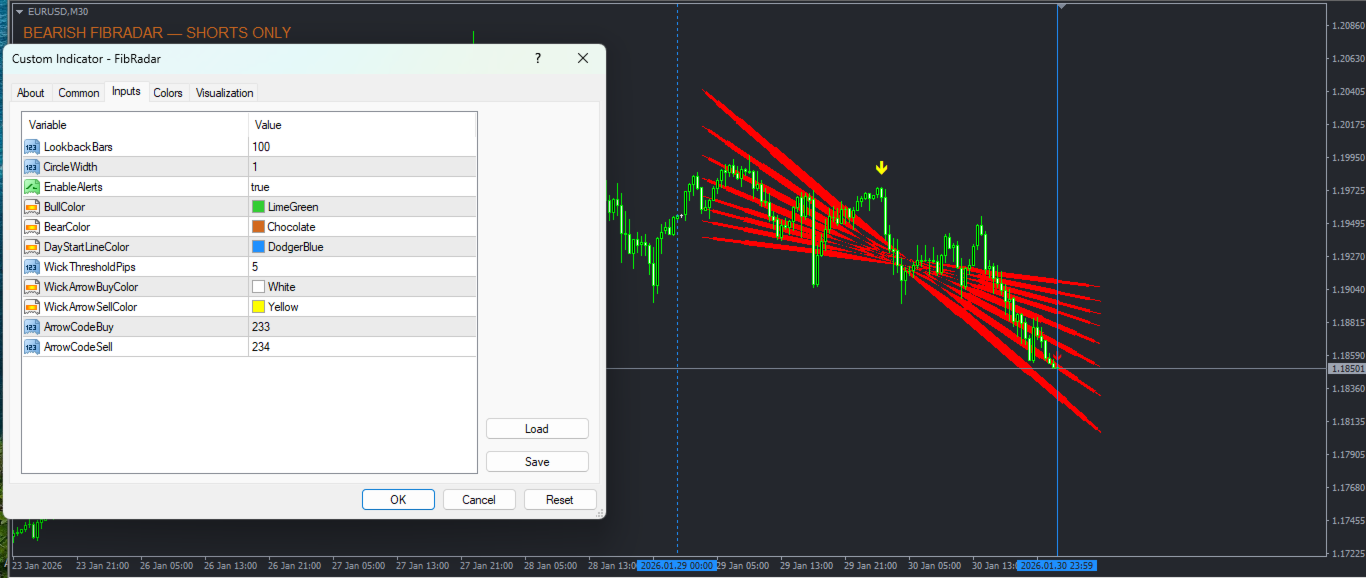
User Inputs
Lookback period for swing detection
Fibonacci circle line width
Bullish and bearish colors
Alert enable or disable
Wick size threshold for rejection detection
Arrow symbols and colors
Best Use Cases
Trend following intraday trading
Fibonacci based momentum strategies
Daily high and low rejection setups
Confirmation tool for scalping or swing trading
Important Notes
FibRadar is not a standalone trading system.
Best results are achieved when combined with market structure session timing and risk management.