Extreme Pro Engine

EXTREME PRO ULTRA CLEAN transforms complex market analysis into a clear visual decision framework designed to identify high-probability trading environments.

Instead of relying on lagging indicators or subjective interpretation, the system evaluates real market conditions using:

  • Average Daily Range (ADR)

  • Directional bias derived from Daily Open

  • Price displacement strength

  • Probability scoring model

  • Institutional decision matrix

The result is a clean dashboard showing when to trade, when to wait, and when to avoid unfavorable market conditions.

Institutional Probability Engine

The indicator calculates a unified probability score from 0 to 100 based on real market behavior.

Both dashboards use the same calculation engine:

  • Chart Engine

  • Market Scanner

This ensures identical ADR and Score readings across all symbols.

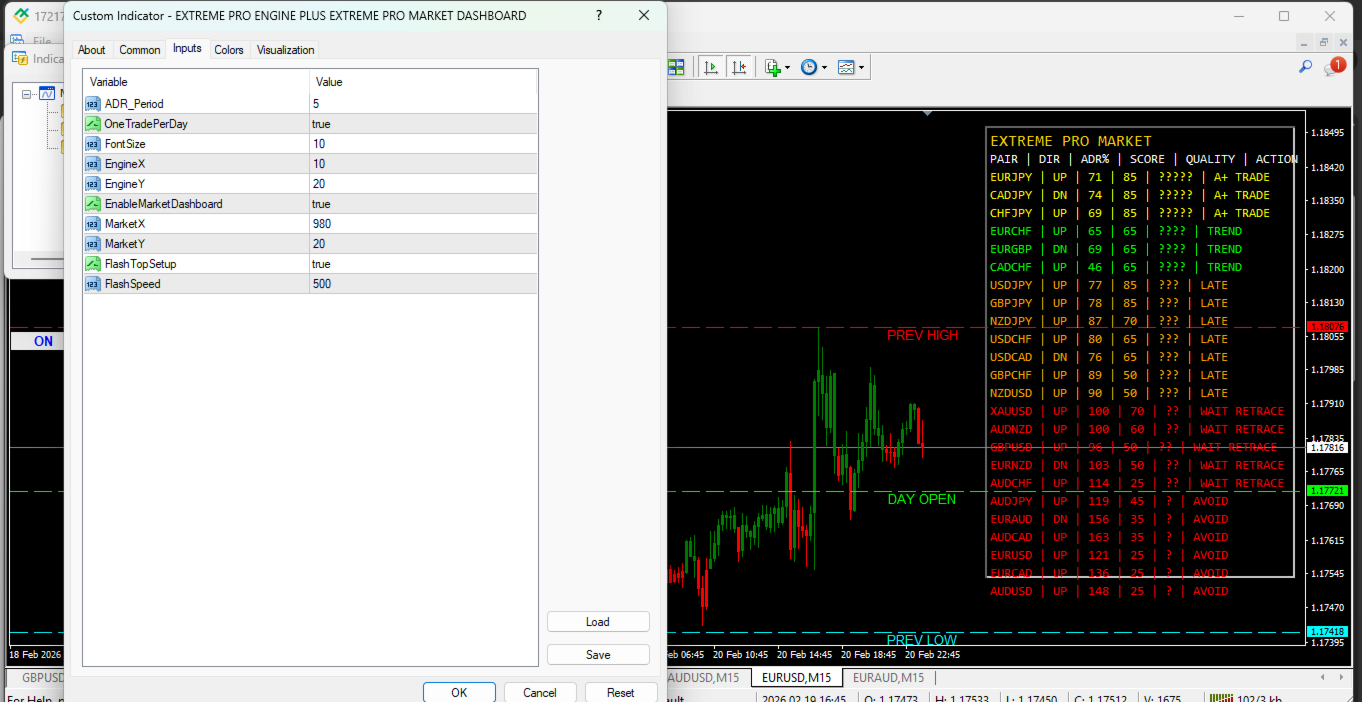
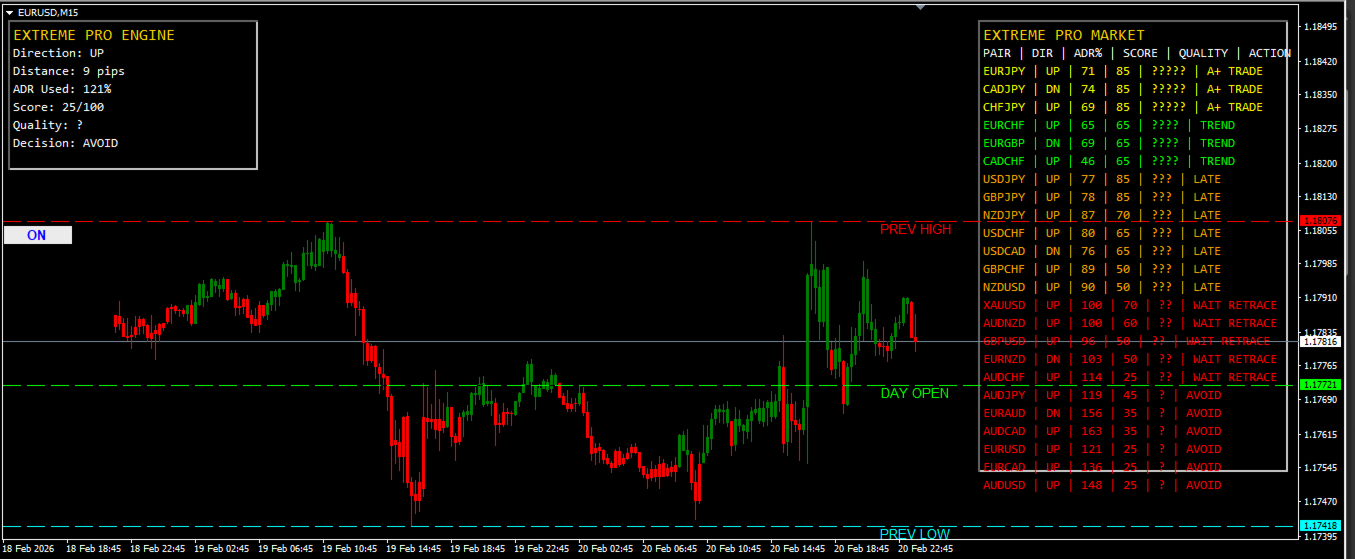
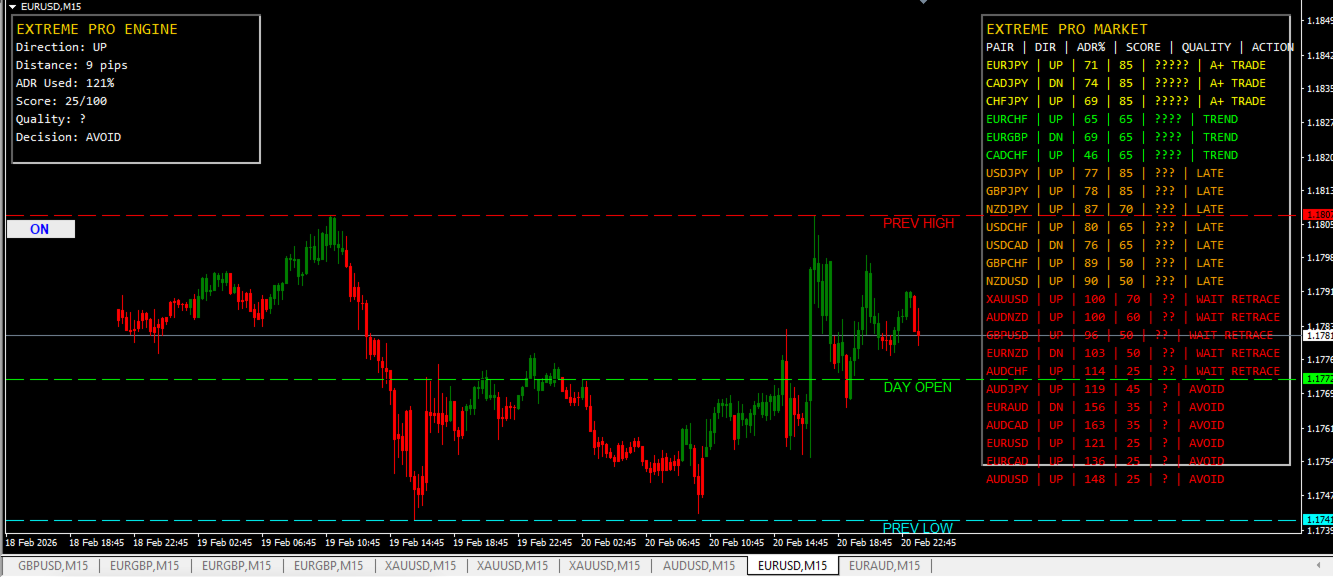
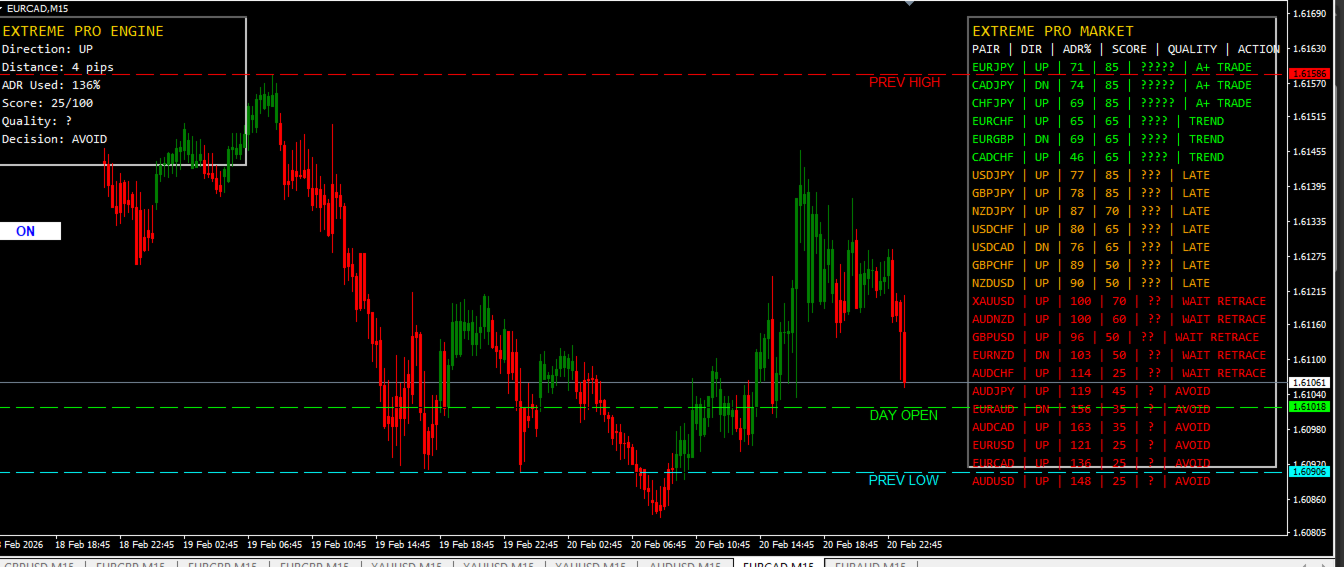
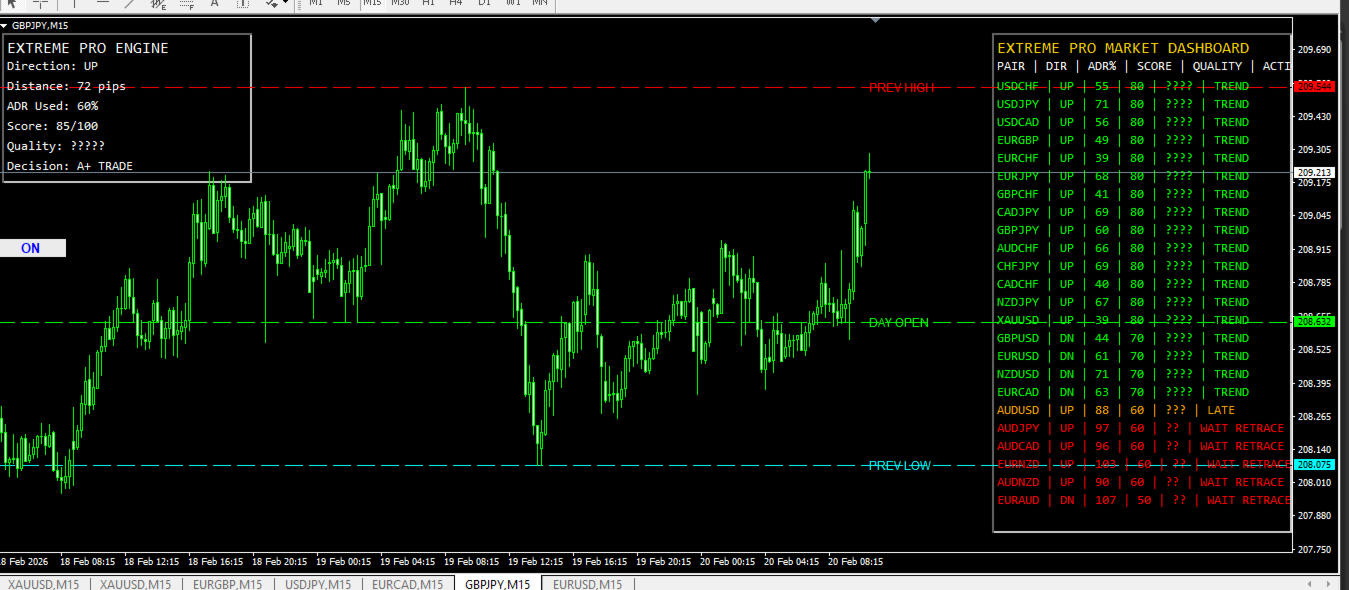
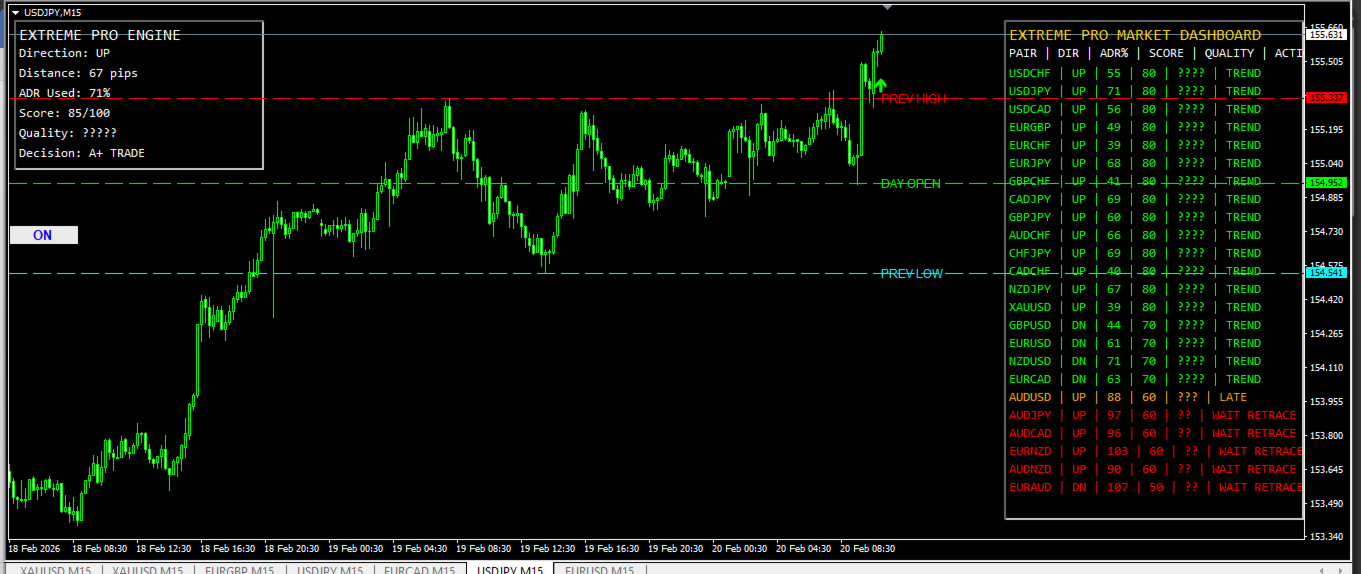
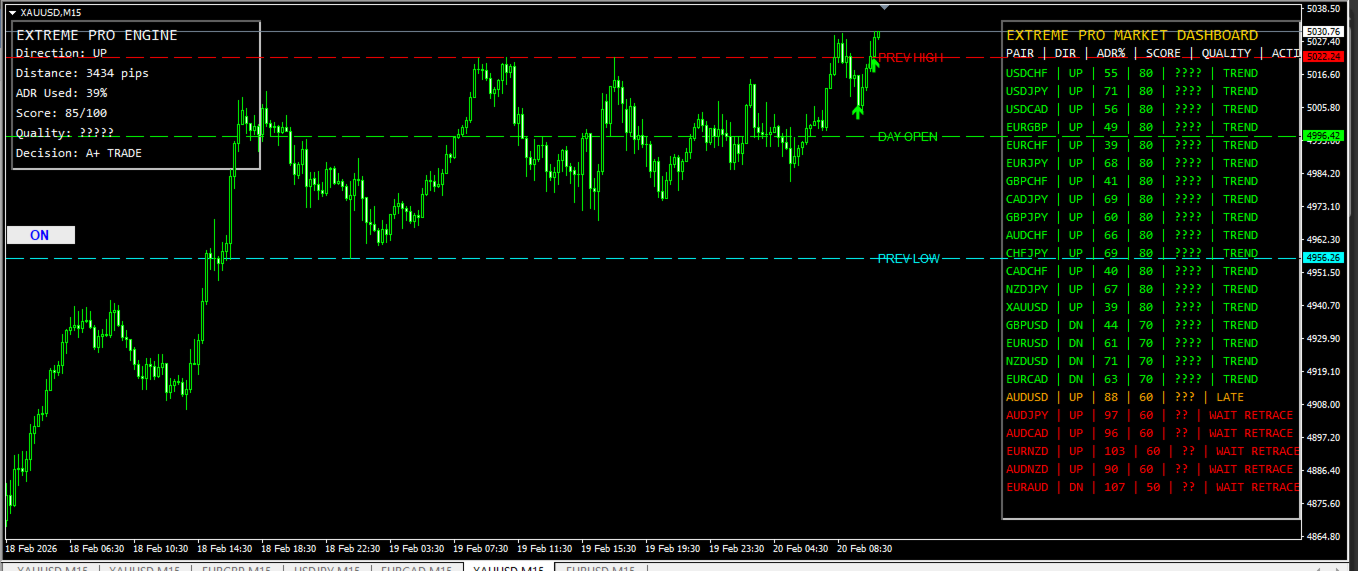
Engine Dashboard (Chart View)

Displays:

  • Direction bias (Up or Down)

  • Distance from Daily Open

  • ADR Used percentage

  • Institutional Score

  • Quality Rating

  • Trading Decision

The layout is designed for instant clarity without chart clutter.

Market Scanner Dashboard

Scans all symbols in Market Watch and ranks opportunities using a structured table:

PAIR | DIR | ADR | SCORE | QUALITY | ACTION

Features:

  • Best opportunities automatically sorted to the top

  • Real-time probability comparison

  • Highlighted high-quality setups

  • Complete market overview from one chart

Smart Institutional Levels

The indicator automatically plots:

  • Day Open with dynamic bias color

  • Previous High

  • Previous Low

These levels help traders quickly identify liquidity zones and directional control.

Institutional Decision Matrix

A+ TRADE

Highest probability setup.

Conditions:

  • ADR between 35 and 75 percent

  • Score between 85 and 100

  • Strong alignment with prevailing trend

Recommended action:
Two positions may be taken when direction aligns with market bias.

TREND

Medium-high probability environment.

Conditions:

  • ADR between 35 and 75 percent

  • Score between 60 and 84

Recommended action:
Wait for a minor retracement or confirmation candle before entering.

LATE

Momentum may still continue but entry risk increases.

Conditions:

  • ADR slightly above optimal range or moderate score

Recommended action:
Consider reduced position size or skip trade.

WAIT RETRACE

Market shows signs of overextension.

Conditions:

  • ADR between 90 and 115 percent or weak score

Recommended action:
Wait for price retracement before considering entry.

AVOID

Low probability market conditions.

Conditions:

  • ADR too high or score too low

Recommended action:
Stay out of the market until conditions improve.

Key Benefits

  • Institutional-style decision framework

  • Ultra clean professional interface

  • Multi-pair opportunity scanner

  • Objective probability scoring

  • Reduced emotional trading decisions

  • Suitable for both beginners and advanced traders

Suitable For

  • Price action traders

  • Intraday traders

  • Swing traders

  • Trend-following traders

  • Proprietary trading firm environments

Disclaimer

This indicator provides analytical information only and does not guarantee trading results. Proper risk management remains the responsibility of the trader.


Recommended products
BoxChart MT4
Evgeny Shevtsov
4.4 (5)
The market is unfair if only because 10% of participants manage 90% of funds. An ordinary trader has slim changes to stand against these "vultures". This problem can be solved. You just need to be among these 10%, learn to predict their intentions and move with them. Volume is the only preemptive factor that faultlessly works on any timeframe and symbol. First, the volume appears and is accumulated, and only then the price moves. The price moves from one volume to another. Areas of volume accumu
The indicator builds current quotes, which can be compared with historical ones and on this basis make a price movement forecast. The indicator has a text field for quick navigation to the desired date. Options: Symbol - selection of the symbol that the indicator will display; SymbolPeriod - selection of the period from which the indicator will take data; IndicatorColor - indicator color; Inverse - true reverses quotes, false - original view; Next are the settings of the text field, in w
Blahtech Market Profile
Blahtech Limited
4.53 (15)
Was: $249  Now: $99   Market Profile defines a number of day types that can help the trader to determine market behaviour. A key feature is the Value Area, representing the range of price action where 70% of trading took place. Understanding the Value Area can give traders valuable insight into market direction and establish the higher odds trade. It is an excellent addition to any system you may be using. Blahtech Limited presents their Market Profile indicator for the MetaTrader community. Ins
VPO Profile MT4
Kyra Nickaline Watson-gordon
5 (2)
Definition : VPO is a Volume Price Opportunity. Instead of using bars or candles with an Open, High, Low, and Close price, each "bar" in a Market Profile is represented by horizontal bars against the price It is called Market Profile terminology. In other words volume-price-opportunity (VPO) profiles are histograms of how many volumes were traded at each price within the span of the profile. By using a VPO chart, you are able to analyze the amount of trading activity, based on volume, for each
El indicador "MR BEAST ALERTAS DE LIQUIDEZ" es una herramienta avanzada diseñada para proporcionar señales y alertas sobre la liquidez del mercado basándose en una serie de indicadores técnicos y análisis de tendencias. Ideal para traders que buscan oportunidades de trading en función de la dinámica de precios y los niveles de volatilidad, este indicador ofrece una visualización clara y detallada en la ventana del gráfico de MetaTrader. Características Principales: Canal ATR Adaptativo: Calcula
Volume Profile Sniper v11.1 is a comprehensive market analysis tool A professional approach to trading Volume Profile Sniper v11.1 combines more than 15 key filters in one indicator, providing clear signals based on a comprehensive assessment of the market situation. Main features Volume imbalance analysis – the algorithm calculates the share of buyers and sellers in each candle, signaling the predominance of one of the parties (configurable threshold from 50% to 90%). Multilevel signal filte
A technical indicator that calculates its readings on trading volumes. In the form of a histogram, it shows the accumulation of the strength of the movement of the trading instrument. It has independent calculation systems for bullish and bearish directions. Works on any trading instruments and time frames. Can complement any trading system. The indicator does not redraw its values, the signals appear on the current candle. It is easy to use and does not load the chart, does not require addition
Gioteen Volatility Index (GVI)   - your ultimate solution to overcoming market unpredictability and maximizing trading opportunities. This revolutionary indicator helps you in lowering your losing trades due to choppy market movements. The GVI is designed to measure market volatility, providing you with valuable insights to identify the most favorable trading prospects. Its intuitive interface consists of a dynamic red line representing the volatility index, accompanied by blue line that indicat
Supply Demand Zone Lines Indicator Background The system automatically searches for supply and demand zones in the Chart and draws real-time key price lines. Traders can trade according to the price trading lines. Main Features The system automatically searches for supply and demand zones. The system also draws real-time key price lines. Traders can trade according to the price trading lines. Therefore, traders who use the supply and demand zone strategy no longer need to spend time looking for
The Market Profile Indicator for MT4 displays the price levels and zones where increased trading activity happens. These zones with substantial forex trading activity provide the forex traders with the best entry levels, support, and resistance levels. Moreover, price levels indicate the best reversal zones. As a result, forex traders can identify BULLISH and BEARISH market trends and BUY and SELL entry points as well as the best reversal points. The indicator works well in all intraday timefram
UPD1 Profile Levels
Vitaliy Kuznetsov
5 (7)
The indicator finds the levels of the maximum and minimum price volume (market profile) on the working histogram for the specified number of bars.  Composite profile . The height of the histogram is fully automatic and adapts to any instrument and timeframe. The author's algorithm is used and does not repeat well-known analogues. The height of the two histograms is approximately equal to the average height of the candle. Smart alert will help you to inform about the price concerning the volume
SQ Swing Fibo Marker
Bartlomiej Gorski
5 (1)
Swing Fibo Marker is adaptive advanced indicator that automatically detects price swings. After swing detection, it draws five profit targets, entry level and stop loss level. Levels are calculated base on price swing size, according to Fibonacci levels specified as entry points. When price touch the level indicator create alerts. List of supported alert types: Popup alerts Email alerts Push notification On screen output Suggested timeframe to trade: H1 or higher. The higher timeframe is used to
Crypto_Forex Indicator "HTF Momentum" for MT4. - HTF Momentum is one of the leading indicators that measure the rate of price change. HTF means - higher time frame. - This indicator shows the trend direction and measures the pace of the price change via comparing current and past values. - HTF Momentum indicator is excellent for Multi-Time Frame trading systems with scalping entries or in combination with other indicators. - This Indicator allows you to attach Momentum from higher timeframe to
Order Book
Thomas Bradley Butler
Added profile support and resistance. See accumulated clusters from the volume profile. Small time frames are better to see clear clusters, the larger time frames and candles more is needed so the clusters will blend together but the accumulated panel is there to show the totals. The "Order Book " indicator displays a histogram on the price chart representing the bid and ask volume clusters.  The indicator analyzes the historical price data and calculates the bid and ask volume clusters for each
The trading statistics indicator notifies the trader of the aggregate income of the trading account for different time intervals. The indicator has wide display settings on the graph. There is a choice of one of the two display languages on the chart- English and Russian. Settings Indicator language (ENG, RUS) - Select the language to display on the chart; To control the magic (-1: any magic) - Entering the Magic for control (-1: any Magic); Angle of indicator tie - Selecting the angle of the c
PipFinite Exit EDGE
Karlo Wilson Vendiola
4.83 (115)
Did You Have A Profitable Trade But Suddenly Reversed? In a solid strategy, exiting a trade is equally important as entering. Exit EDGE helps maximize your current trade profit and avoid turning winning trades to losers. Never Miss An Exit Signal Again Monitor all pairs and timeframes in just 1 chart www.mql5.com/en/blogs/post/726558 How To Trade You can close your open trades as soon as you receive a signal Close your Buy orders if you receive an Exit Buy Signal. Close your Sell orders if
English This indicator acts as an advanced chart analysis assistant for traders who love trading Chart Patterns. It is designed to reduce the burden of visual analysis and increase accuracy in making a profit. Main features of this indicator from a practical usage perspective: 1. Automated Pattern Detection Saves time and reduces bias: You don't need to manually draw trendlines. The indicator will search for price swings (Pivot High/Low) and automatically draw Rising Wedge and Falling Wedge stru
Blahtech Supply Demand
Blahtech Limited
4.58 (36)
Was: $299  Now: $99   Supply Demand uses previous price action to identify potential imbalances between buyers and sellers. The key is to identify the better odds zones, not just the untouched ones. Blahtech Supply Demand indicator delivers functionality previously unavailable on any trading platform. This 4-in-1 indicator not only highlights the higher probability zones using a multi-criteria strength engine, but also combines it with multi-timeframe trend analysis, previously confirmed swings
Dynamic Trend Sniper MT4
Vincent Georges David Ferrier
Trade Like an Institution. Protect Like a Professional. Early Sniper Access: Limited Launch Offer! Get ready to elevate your trading precision. We are offering an exclusive, highly limited launch price for the first Dynamic Trend Sniper users. Our Unbeatable Launch Offer: First 10 Snipers Only: $69 (Full lifetime access + all v1.x updates) Standard Retail Price (After 10 Purchases): $129 Why Act Now? This is not just a discount; it's a strategic entry point. We are committed to rewarding o
Gold Trend 4
Sergei Linskii
Gold Trend - this is a good stock technical indicator. The indicator algorithm analyzes the price movement of an asset and reflects volatility and potential entry zones. Live Signal of manual trading >>>   [ Click Here ] The best indicator signals: For SELL = red histogram + red SHORT pointer + yellow signal arrow in the same direction + red trend direction arrow. For BUY = blue histogram + blue LONG pointer + aqua signal arrow in the same direction + blue trend direction arrow. Benefits of the
Forex Gump Trend is a universal indicator for highly effective determination of the trend direction. If you identify the trend correctly, this is 95% of trading success, because you will be able to open trades in the direction of the price movement and benefit from it. The Forex Gump Trend indicator helps traders with a high degree of efficiency to determine the current trend direction, as well as trend reversal points. The direction of the trend is shown by colored lines on the chart, and the
First and foremost, the Insight Flow Indicator stands out as a Non-Repainting, Non-Redrawing, and Non-Lagging tool. This makes it a prime choice for both manual and algorithmic trading, ensuring reliable and consistent signals. User Manual: Settings, Inputs, and Strategy The Insight Flow Indicator leverages price action, strength, and momentum to provide a clear edge in the market. Equipped with advanced filters, it eliminates noise and false signals, enhancing trading potential. By using multip
Introduction to Chart Pattern MT Chart Pattern MT is a chart pattern scanner to detect the triangle pattern, falling wedge pattern, rising wedge pattern, channel pattern and so on. Chart Pattern MT uses highly sophisticated chart pattern detection algorithm. However, we have designed it in the easy to use with intuitive user interface. Chart Pattern MT will show all the patterns in your chart in the most efficient format for your trading. You do not have to do tedious manual pattern detection an
Support and Resistance Zones MultiTimeframe
Mohamed Gamal Abdelnasser Yous Hashesh
A powerful indicator that highlights key market zones and helps traders identify potential opportunities across multiple timeframes. Designed for clarity and efficiency, it provides real-time alerts to keep you informed of important price levels. Key Features: Works on multiple timeframes: M1, M5, M15, M30, H1, H4, D1, W1, MN1. Customizable zone colors for each timeframe. Real-time alerts and notifications when price reaches significant zones. Automatically manages chart objects to keep your wo
Description The Market Profile & Volume Profile Indicator is a powerful technical analysis tool designed to visualize market activity and price distribution over specific timeframes. Unlike standard technical indicators that focus solely on price over time, this indicator organizes price data to show where the market spent the most time (TPO) and where the most volume was traded (Volume Profile). It automatically calculates and displays key structural levels such as the Point of Control (POC) ,
ReboltDelta
David Theodore Caro-greene
Rebalance Overlay Technology (Rebolt) enables the trader to visualize the flow of money from one chart to another chart. Rebolt Delta (ReboltDelta) indicates the probable price change that will occur in the target chart based on changes in the source chart. ReboltDelta is designed for use in cooperation with Rebolt Probability. La tecnología de superposición de reequilibrio (Rebolt) permite al operador visualizar el flujo de dinero de un gráfico a otro gráfico. Rebolt Delta (ReboltDelta) indica
Smart Level Pro
Aleksandr Makarov
Smart Level Pro is a very powerful indicator based on the concept of order blocks and set entries with the right fvg and breakouts to create a very good entry level like a professional trader. Very easy to use interface and easy to enter on buy and sell signals. The indicator does not repaint and does not change its data! Works best on M5-M15 timeframe for gold, bitcoin and currency pairs. 4-5 deals daily for each pair. Trading with this indicator is very easy. We wait for a signal from the ind
SmartSignal Sniper
Ahmed Ismail Muhammad Ismail Al Talhat
SmartSignal Sniper: Your Ultimate Trading Companion Unlock the power of precision trading with SmartSignal Sniper. Engineered to deliver accurate buy and sell signals, this advanced tool empowers traders of all levels to navigate the financial markets with confidence and clarity. Key Features: Pinpoint Accuracy: SmartSignal Sniper utilizes advanced algorithms to provide precise buy and sell signals, helping traders identify lucrative opportunities in the market. Lightning-fast Execution: With re
Buy and sell zones
Evgeniy Zhdan
5 (2)
Indicator for determining flat and trend. If the price is below any of the two histograms and two lines (red and blue), this is a sell zone. When purchasing this version of the indicator, MT5 version for one real and one demo account - as a gift (to receive, write me a private message)! If the price is above any of the two histograms and two lines (red and blue), this is a buy zone. MT5 version:  https://www.mql5.com/en/market/product/70409 If the price is between two lines or in the zone of
Buyers of this product also purchase
The Propfolio Master Suite is the ultimate all-in-one analytical workstation for professional traders. Combining the power of the Beat The Market Maker (BTMM) methodology, Smart Money Concepts (SND/Liquidity), and Advanced Volume Profile, this suite replaces multiple different indicators with one optimized engine. Monitor up to 14 pairs simultaneously from a single chart, instantly identify market cycles, and seamlessly map institutional footprints with the click of a button. The Command Center
Scalper Inside PRO
Alexey Minkov
4.74 (69)
Scalper Inside PRO Scalper Inside PRO is an intraday trend and scalping indicator for MetaTrader 4 that uses an exclusive algorithm to quickly detect market direction and key target levels. It automatically calculates entry, exit and multiple profit targets, and shows detailed performance statistics so you can see how different instruments and strategies performed. This helps you choose the most suitable trading instruments for the current market conditions. Additionally, you can easily integrat
NAM Order Blocks
NAM TECH GROUP, CORP.
3.67 (3)
MT4 Multi-timeframe Order Blocks detection indicator. Features - Fully customizable on chart control panel, provides complete interaction. - Hide and show control panel wherever you want. - Detect OBs on multiple timeframes. - Select OBs quantity to display. - Different OBs user interface. - Different filters on OBs. - OB proximity alert. - ADR High and Low lines. - Notification service (Screen alerts | Push notifications). Summary Order block is a market behavior that indicates order collection
First of all Its worth emphasizing here that this Trading Tool is Non-Repainting Non-Redrawing and Non-Lagging Indicator Which makes it ideal for professional trading . [Online course] ,   and   [manual] The Smart Price Action Concepts Indicator is a very powerful tool for both new and experienced traders . It packs more than 20 useful indicators into one combining advanced trading ideas like Inner Circle Trader Analysis and Smart Money Concepts Trading Strategies . This indicator focuses on Sm
Quants HL Break
Ferhat Mutlu
5 (2)
Advanced calculation made by pure price action to find LH and HL breakouts. It will give you a great reversal points in the market. LH and HL signals can used for the traingle breakouts as well. Once breakout happens its indicate strong reversal. Nice filter for Moving Averages. I highly suggest to use that with trend indicators. Can be used as an extra confirmation for support and resistance , supply demand indicators. The indicator is not repainting. Buffers :   SetIndexBuffer ( 0 ,UpBar);
Dynamic Forex28 Navigator
Bernhard Schweigert
4.43 (7)
Specials Discount now. The Next Generation Forex Trading Tool. Dynamic Forex28 Navigator is the evolution of our long-time, popular indicators, combining the power of three into one: Advanced Currency Strength28 Indicator (695 reviews) + Advanced Currency IMPULSE with ALERT (520 reviews) + CS28 Combo Signals (recent Bonus) Details about the indicator  https://www.mql5.com/en/blogs/post/758844 What Does The Next-Generation Strength Indicator Offer? Everything you loved about the originals, now
RFI levels PRO
Roman Podpora
5 (1)
The indicator accurately shows the reversal points and price return zones where the   Major players . You see where new trends are forming and make decisions with maximum precision, maintaining control over every trade. VERSION MT5     -     Reveals its maximum potential when combined with the   TREND LINES PRO   indicator What the indicator shows: Reversal structures and reversal levels with activation at the beginning of a new trend. Display of   TAKE PROFIT   and   STOP LOSS   levels with mi
Grabber System
Ihor Otkydach
5 (2)
Let me introduce you to an excellent technical indicator – Grabber, which works as a ready-to-use "All-Inclusive" trading strategy. Within a single code, it integrates powerful tools for technical market analysis, trading signals (arrows), alert functions, and push notifications. Every buyer of this indicator also receives the following for free: Grabber Utility for automatic management of open orders Step-by-step video guide: how to install, configure, and trade with the indicator Custom set fi
Advanced Supply Demand
Bernhard Schweigert
4.91 (300)
Trading Special – 40% OFF Best Solution for any Newbie or Expert Trader! This indicator is a unique, high quality and affordable trading tool because we have incorporated a number of proprietary features and a new formula. With this update, you will be able to show double timeframe zones. You will not only be able to show a higher TF but to show both, the chart TF, PLUS the higher TF: SHOWING NESTED ZONES. All Supply Demand traders will love it. :) Important Information Revealed Maximize the pot
GoldRush Trend Arrow Signal V1.6 The GoldRush Trend Arrow Signal indicator V1.6 continues to provide precise, real-time trend analysis tailored for high-speed, short-term scalpers in XAU/USD , but it now has additional features and improved efficiency and reliability. Built specifically for the 1-minute time frame, this tool displays directional arrows for clear entry points, allowing scalpers to navigate volatile market conditions with confidence. The indicator consists of PRIMARY and SECONDARY
Introduction to Fractal Pattern Scanner Fractal Indicator refers to the technical indicator that makes use of the fractal geometry found in the financial market. Fractal Pattern Scanner is the advanced Fractal Indicator that brings the latest trading technology after the extensive research and development work in the fractal geometry in the financial market. The most important feature in Fractal Pattern Scanner is the ability to measure the turning point probability as well as the trend probabi
Trading Special –40% OFF Best Solution for any Newbie or Expert Trader! This Indicator is a unique, high quality and affordable trading tool because we have incorporated a number of proprietary features and a new formula. With only ONE chart you can read Currency Strength for 28 Forex pairs! Imagine how your trading will improve because you are able to pinpoint the exact trigger point of a new trend or scalping opportunity? User manual: click here That's the first one, the original! Don't buy a
Cycle Sniper
Elmira Memish
4.39 (36)
Please contact us after your purchase and we will send you the complimentary indicators to complete the system Cycle Sniper is not a holy grail but when you use it in a system which is explained in the videos, you will feel the difference. If you are not willing to focus on the charts designed with Cycle Sniper and other free tools we provide, we recommend not buying this indicator. We recommend watching the videos about the indiactor and system before purchasing. Videos, settings  and descri
Market Structure Patterns MT4
Samuel Manoel De Souza
5 (18)
Market Structure Patterns   is an indicator based on   smart money concepts   that displays   SMC/ICT   elements that can take your trading decisions to the next level. Take advantage of the   alerts ,   push notifications   and   email messages   to keep informed from when an element is formed on the chart, the price crosses a level and/or enters in a box/zone. Developers can access the values of the elements of the indicator using the   global variables  what allows the automation of trading d
Candle Power Pro
Thushara Dissanayake
4.5 (8)
The   Candle Power Pro   is a sophisticated trading tool designed to decode   real volume pressure, tick data imbalances, and institutional order flow dynamics   by measuring the   battle between bull ticks and bear ticks   in real time. This indicator transforms raw   volume data into actionable insights , helping traders identify   Smart Money movements, liquidity hunts, and hidden market psychology   behind each price candle. By analyzing   buyer/seller volume percentages, divergence pattern
If you trade Forex, having detailed information about the currency strength and currency pairs correlation can take your trading to new heights. The correlation will help to cut your risk in half, and strength analysis will help to maximize the profits. This indicator provides a hybrid approach for selecting the most appropriate currency pairs using the strength analysis and currency pairs correlation. How to use the Currency Strength Analysis Suppose your trading strategy provides a buying opp
Route Lines Prices is an indicator designed for finding price directions. Its simple interface contains multiple algorithms for price behavior and future direction calculations. These algorithms include volatility calculations and price smoothing based on the timeframes used. The indicator has a single parameter for changing the " Calculating Price Values " value. The default value of 1 provides a balanced automatic calculation, which can be used without manually configuring the indicator. By m
Technical indicator that structures charts and identifies cyclical price movements. Can work on any charts. Several types of alerts. There are additional arrows on the chart itself. Without redrawing on history, works on closing a candle. Recommended TF from M5 and higher. Easy to use and configure parameters. When using 2 indicators with different parameters, you can use without other indicators. Has 2 input parameters Cyclicality and Signal duration These 2 parameters work with the processin
KuKl
IGOR KIRIANEN
The indicator is built on a non-standard Zig Zag, it draws accumulations after which if the price leaves this zone and a test of this zone occurs, then a sound signal is given and an arrow appears - after the test candle closes.The indicator does not redraw its signals, it is very easy to use, there are only three settings 1- this is the zig zag parameter 2- this is the minimum price exit from the zone 3- this is the maximum price exit from the zone. The lower the parameter for Zig Zag, the more
PZ Harmonacci Patterns
PZ TRADING SLU
3.17 (6)
Trade smarter, not harder: Empower your trading with Harmonacci Patterns This is arguably the most complete harmonic price formation auto-recognition indicator you can find for the MetaTrader Platform. It detects 19 different patterns, takes fibonacci projections as seriously as you do, displays the Potential Reversal Zone (PRZ) and finds suitable stop-loss and take-profit levels. [ Installation Guide | Update Guide | Troubleshooting | FAQ | All Products  ] It detects 19 different harmonic pric
The Super Arrow Indicator provides non-repainting buy and sell signals with exceptional accuracy. Key Features No repainting – confirmed signals remain fixed Clear visual arrows: green for buy, red for sell Real-time alerts via pop-up, sound, and optional email Clean chart view with no unnecessary clutter Works on all markets: Forex, gold, oil, indices, crypto Adjustable Parameters TimeFrame Default: "current time frame" Function: Sets the time frame for indicator calculation Options: Can be set
New Update of Smart Trend Trading System MT5 For  2026 Market: If You Buy this Indicator you will Get my Professional   Trade Manager + EA  for   FREE . First of all Its worth emphasizing here that this Trading System is   Non-Repainting   , Non Redrawing and Non Lagging Indicator   Which makes it ideal from both manual and robot trading .  [Online course] ,   [manual]   and   [download presets] . The Smart Trend Trading System MT5 is a comprehensive trading solution tailored for   new   and   e
Atomic Analyst
Issam Kassas
5 (6)
First of all Its worth emphasizing here that this Trading Indicator is   Non-Repainting , Non Redrawing and Non Lagging Indicator   Indicator, Which makes it ideal from both manual and robot trading.  User manual: settings, inputs and strategy . The Atomic Analyst  is a PA Price Action Indicator that uses Strength and Momentum of the price to find a better edge in the market. Equipped with Advanced filters which help remove noises and false signals, and Increase Trading Potential. Using Multiple
NAM Divergences
NAM TECH GROUP, CORP.
5 (1)
MT4 Multi-timeframe Divergence and Overbougt/Oversold detection indicator. Features - Fully customizable on chart control panel, provides complete interaction. - Hide and show control panel wherever you want. - Real time information about non-capitalized divergences. - Real time information about overbougt / oversold situations. - Real time information about regular divergences. - Real time information about hidden divergences. - Oscillators available for divergences detection: AO, RSI, CCI, MA
Super Signal – Skyblade Edition Professional No-Repaint / No-Lag Trend Signal System with Exceptional Win Rate | For MT4 / MT5 It works best on lower timeframes, such as 1-minute, 5-minute, and 15-minute charts. Core Features: Super Signal – Skyblade Edition is a smart signal system designed specifically for trend trading. It applies a multi-layered confirmation mechanism to detect only strong, directional moves supported by real momentum. This system does not attempt to predict tops or bottoms
Gold Channel is a volatility-based indicator, developed with a specific timing algorithm for the XAUUSD pair, which consists of finding possible corrections in the market. This indicator shows two outer lines, an inner line (retracement line) and an arrow sign, where the theory of the channel is to help identify overbought and oversold conditions in the market. The market price will generally fall between the boundaries of the channel. If prices touch or move outside the channel it is a tradi
The " Dynamic Scalper System " indicator is designed for the scalping method of trading within trend waves. Tested on major currency pairs and gold, compatibility with other trading instruments is possible. Provides signals for short-term opening of positions along the trend with additional price movement support. The principle of the indicator. Large arrows determine the trend direction. An algorithm for generating signals for scalping in the form of small arrows operates within trend waves.
Gold Signal Swing Pro XAUUSD with Auto TP SL (MT4) — 7-Layer Filter + RR Guarantee System for XAUUSD Swing Trading No repaint. No redraw. No lag. All signals lock after confirmation. Bonus for buyers: Get AI Zone Radar ($59 value) + PDF manual free with purchase. Send me a message on MQL5 after buying. AI Zone Radar: https://www.mql5.com/en/market/product/175834 MT5 version also available: https://www.mql5.com/en/market/product/170916?source=Site +Profile+Seller Used and trusted by gold traders
GOLD Impulse with Alert
Bernhard Schweigert
4.67 (12)
This indicator is a super combination of our 2 products  Advanced Currency IMPULSE with ALERT  and  Currency Strength Exotics . It works for all time frames and shows graphically impulse of strength or weakness for the 8 main currencies plus one Symbol! This Indicator is specialized to show currency strength acceleration for any symbols like Gold, Exotic Pairs, Commodities, Indexes or Futures. Is first of its kind, any symbol can be added to the 9th line to show  true currency strength accelerat
Miraculous Indicator – 100% Non-Repaint Forex and Binary Tool Based on Gann Square of Nine This video introduces the Miraculous Indicator , a highly accurate and powerful trading tool specifically developed for Forex and Binary Options traders. What makes this indicator unique is its foundation on the legendary Gann Square of Nine and Gann's Law of Vibration , making it one of the most precise forecasting tools available in modern trading. The Miraculous Indicator is fully non-repaint, meaning t
More from author
Asian Manipulation Detector plus London Entry Bias System Overview The Asian Manipulation Detector is an SMC based trading indicator designed to identify institutional market behavior during the Asian session and confirm directional bias for the London session. It combines Asian session range analysis, H4 structure confirmation, and breakout validation to deliver high probability buy and sell bias signals with real time alerts and mobile notifications. How It Work s 1. Asian Session Range Id
Institutional Liquidity Flow System. This indicator is a hybrid institutional liquidity and break and retest continuation strategy system designed to identify high probability market reactions and continuation entries using previous day high and previous day low levels, a smoothed moving average filter, and structured breakout retest logic. It combines liquidity sweep behavior, trend confirmation, and continuation entries into a single trading model. Core Components Key Liquidity Levels P
Super Reversal Indicator with Alert Overview Super Reversal Indicator with Alert is a multi timeframe trading tool designed to identify high probability market reversal opportunities using a combination of stochastic momentum, supply and demand zones, and price rejection signals. The indicator helps traders detect potential turning points in the market with clear visual signals and real time alerts. Key Features Multi Timeframe Stochastic Analysis Uses stochastic oscillator from a higher timefra
ARTEMIS SUB WINDOW REVERSAL SYSTEM The ARTEMIS Sub Window Reversal System is a powerful, non-repainting Forex indicator designed to identify high-probability reversal trades using a combination of Smart Money Concepts and stochastic momentum analysis. Built for traders who want precision entries, this indicator combines liquidity sweep detection, market structure shifts, and momentum confirmation into one clean and professional trading tool. WHY THIS INDICATOR STANDS OUT Most indicators generate
Institutional Buy & Sell Zones with Alerts Overview: Institutional Buy & Sell Zones with Alerts is a professional all-in-one indicator that combines daily trendlines, change-of-character (CHoCH) signals, and 7-day institutional supply/demand zones to give traders a clear view of market structure, trend direction, and high-probability reversal points . Key Features: Daily Trendline Detection: Automatically draws trendlines from the previous day high/low to current day high/low . Detects trendlin
FREE
TrendSeeker Dashboard
Godwin Edward Enyali
TrendSeeker Dashboard – Smart Market Filter for High-Probability Trades TrendSeeker Dashboard is a powerful multi-symbol market intelligence tool designed to help traders avoid ranging markets and focus only on high-quality trending pairs on the H4 timeframe. The dashboard continuously scans all available symbols and classifies each pair into: Trending UP Trending DOWN Ranging / No-Trade Conditions By combining EMA trend direction , ADX trend strength , and ATR volatility , TrendSeeker instantly
FREE
Ultimate Market Master Trend Master the Market’s Direction with Precision The Ultimate Market Master Trend indicator is an all-in-one market sentiment analyser designed for traders who demand clarity, accuracy, and confidence in every move. It combines smart trend detection, multi-timeframe stochastic momentum, and dynamic visual cues to help you identify high-probability entries and exits with ease.  Key Features  1. Smart Trend System (Main Chart) Uses a 200-period LWMA baseline to determine
Industry Machine
Godwin Edward Enyali
The Industry Machine is an all-in-one trading powerhouse designed to give traders a complete view of market dynamics in one glance. It combines a dynamic dashboard, smart supply and demand zones, reversal signals, and a multi-timeframe histogram to visualize market strength. At the heart of the system is its dashboard , which monitors all active currency pairs and shows the alignment of higher and lower timeframes. It tells you whether a pair is bullish or bearish on both the H4 and M30 charts,
FREE
Multi-Timeframe Supply Demand Histogram Description: The Multi-Timeframe Supply Demand Histogram is a powerful and clean indicator that shows market demand and supply strength across multiple timeframes , specifically H4 and D1. It displays histograms highlighting when buyers or sellers dominate , allowing traders to quickly identify key market pressure areas. Key Features: H4 & D1 Histograms: Clear visualization of higher timeframe market strength. Histogram Change Alerts: Optional notificatio
FREE
ULTIMATE PRO PANEL WITH TRADE THE RANGE SYSTEM (MT4) Indicator Description ULTIMATE PRO PANEL WITH TRADE THE RANGE SYSTEM is an advanced decision-support indicator for MetaTrader 4 designed to transform complex market analysis into a clear and structured visual trading framework. Rather than relying on lagging indicators or subjective chart interpretation, the system evaluates real-time market conditions using quantitative market behavior models to identify high-probability trading environments
FREE
Trend Reversal Zone and Alert
Godwin Edward Enyali
5 (1)
Trend Reversal Zone and Alert Professional Multi-Timeframe Supply & Demand + Precision Reversal Signals Trend Reversal Zone and Alert is a powerful, non-repainting market structure indicator designed for traders who want to identify high-probability reversals at institutional price levels with absolute clarity. This indicator intelligently combines higher-timeframe Supply & Demand zones (H4 and D1) with precise daily high/low rejection signals , giving traders a complete framework for timing acc
The Follow The Labels Indicator is a multi-functional MT4 indicator designed to give traders a comprehensive visual overview of market conditions across multiple dimensions. It combines trend analysis, previous day levels, stochastic momentum, and rejection signals in one easy-to-read interface. Key Features: Multi-Timeframe MA200 Trend Filter (H1→M15) Displays the alignment of the MA200 (LWMA) across three timeframes: H1, M30, M15. Shows an overall trend label: Bullish, Bearish, or Mixed. Optio
FREE
Ultimate Daily SR Zones + Rejection Arrows  Ultimate Daily SR Zones is a powerful price-action indicator that helps traders clearly identify the most important daily market levels — the previous day’s High , Low , Midline , and opening/closing reference points. It also detects wick rejection signals and plots automatic Buy and Sell arrows when the market rejects these zones. This tool is perfect for intraday and swing traders who use daily levels for breakout, reversal, or retest strategies.  Wh
Ultimate Super Rejection Zones is a powerful MT4 indicator designed to detect accurate intraday reversal points using a combination of: Previous Day High & Low Midline equilibrium zone Rejection candle patterns Double-layer confirmation using two Stochastic filters Smart alert and arrow system Daily auto-reset filtering Optional trend filter using Moving Averages The indicator helps traders find high-probability reversal entries at premium and discount zones. It automatically marks:  Sell Reject
Buy & Sell Levels with Alerts is a comprehensive trading indicator that combines Stochastics, Previous Day Levels, Multi-Timeframe (MTF) Trend Meter , and rejection detection into one powerful tool. It helps traders quickly spot key support/resistance zones, trend direction, and high-probability reversal signals with visual arrows and automated alerts. Key Features: Stochastic Oscillator: Displays fast (%K) and slow (%D) lines in a separate window. Helps identify overbought and oversold conditio
Maximize Your Trend-Aligned Trading with H4 & M30 Turning Point PRO! Say goodbye to guesswork and chart clutter. This premium indicator combines higher timeframe trend detection with precise short-term turning point signals, giving you crystal-clear buy and sell opportunities . Why Traders Love It: - H4 EMA200 Trend Bias: Know the dominant trend at a glance. Only trade in the trend direction. - M30 Execution Arrows: Wait for high-probability turning points confirmed by trend, structure, and vol
Ultimate Scalper Zone
Godwin Edward Enyali
Scalpers Zone – Ultimate Supply/Demand + Stochastic Rejection & Triple Touch Indicator Scalpers Zone is designed for traders seeking high-probability scalp entries . It detects daily and 7-day supply/demand zones and highlights areas where these zones align perfectly , marking the strongest potential reversal points . For volatile assets like crypto and gold , the zone thickness can be increased for better visibility and precision . Key Features: Aligned Zone Detection: Daily and 7-day supply or
Trade The Range
Godwin Edward Enyali
Trade the Range – H4 Ranging Market Detector & Daily SR Zones with Wick Rejection Alerts Overview: “Trade the Range” is a precision trading tool designed for traders who want to focus exclusively on high-probability ranging markets . Instead of blindly following every trend, this indicator identifies when the market is consolidating on the H4 timeframe and guides you to trade the top and bottom zones of the range with confidence. Key Features: H4 Range Detection: Automatically identifies if the
TrendSeeker Pro. - Ultimate Trend & Turning Point Dashboard + H4 Range Detector Ultimate Trend & Turning Point Dashboard is a complete multi-timeframe market decision system designed to keep traders on the right side of the trend, eliminate low-probability ranging conditions, and deliver precise turning-point entries with confidence. This is not just an indicator — it is a full trading framework that answers three critical questions before you ever enter a trade: Is the market trending or rangin
Trend Reversal Zone and Alert EA Smart Supply & Demand Reversal Trading System Trend Reversal Zone and Alert EA is a professional, non-repainting Expert Advisor designed to capture high-probability trend reversals at institutional supply and demand zones , confirmed by daily high/low wick rejection price action . This EA combines multi-timeframe market structure with precise entry timing , allowing traders to enter reversals early while maintaining strict risk control.  Core Trading Logic The EA
PREMIUM SUPPLY AND DEMAND ZONES WITH ALERTS Premium Supply and Demand Zones with Alerts is a professional Smart Money trading indicator that combines institutional-grade Supply & Demand zones with a multi-timeframe trend histogram to deliver high-confidence rejection entries . The indicator automatically identifies premium Supply and Demand zones on the main chart and confirms entries using strong wick rejection logic . Trade signals are generated only in the direction of the dominant trend , w
Moving Average of Supply and Demand is a powerful yet beginner-friendly trend-following indicator designed to help traders see market direction clearly and enter with confidence . Instead of using traditional moving averages on price, this indicator applies a moving-average smoothing technique to supply and demand pressure , displaying it directly on the price chart as a dynamic histogram-style trend zone . The result is a clean, visual representation of where buyers or sellers are in control ,
Impulse Zone Hunter
Godwin Edward Enyali
Impulse Zone Hunter – Precision Chart Tool Impulse Zone Hunter is a high-performance MT4 indicator designed to provide traders with a visual edge in detecting high-probability market movements. It focuses on Supply & Demand zones , Order Blocks , and ChoCH (Change of Character) , delivering clear and actionable signals directly on your price chart . Key Features: Dual Mode Trading Toggle between Supply & Demand zones or Order Blocks with ChoCH lines . Easily switch modes without affecting other
FibStrike Rejection is a powerful MT4 indicator designed for traders who want to visualize high-probability buy and sell zones using Fibonacci retracements combined with wick rejection signals . The indicator automatically identifies recent high and low swings based on a customizable lookback period and draws Fibonacci levels from 100% to 40% . Buy and sell zones are highlighted within these levels. In addition, the indicator detects wick rejection candles at both the Fibonacci zones and the cur
Liquidity Sentinel Pro – Multi-TF Dashboard & Rejection Alerts Description: Liquidity Sentinel Pro is a powerful all-in-one MT4 indicator designed to give traders a complete view of market dynamics by combining multi-timeframe trend analysis, supply/demand strength, and precision wick rejection alerts . This tool provides actionable insights on which currency pairs or assets are trending , highlights high-probability reversal points , and helps traders filter out noise , giving them the confiden
FibRadar
Godwin Edward Enyali
FibRadar v1 Directional Fibonacci Radar with Daily Rejection Alerts FibRadar v1 is a directional price action based Fibonacci radar indicator designed to identify market bias high probability zones and intraday rejection signals using Fibonacci geometry daily structure and momentum confirmation. The indicator automatically analyzes recent price extremes projects Fibonacci based radar circles and enforces strict directional trading rules to keep traders aligned with dominant market pressure. Core
Reversal Channel Alert Pro i s an advanced technical analysis indicator designed to identify early market reversals and clearly project future price direction using optimized linear regression channels combined with daily price rejection logic. The indicator integrates multiple analytical techniques into one system, allowing traders to anticipate reversals with high confidence while maintaining a clean and professional chart appearance. Core Functionality The indicator operates using three indep
SMC Reversal Indicator Pro. Plus Alert Catch market reversals the moment they happen with the powerful Blue Line (%K) cross ! Instantly see buy arrows when the blue line rises above 20 and sell arrows when it drops below 80. Every signal comes with instant alerts – right on your screen, with sound, or sent straight to your mobile. Visualize price turning points like never before with the Reversal Zones – beautifully marked supply and demand areas on H4 and D1 charts, showing where price is most
SMC Zigzag Plus Strict Trend Buy Sell and Alert Overview: SMC Zigzag Plus Strict Trend and Alert is a professional trading indicator designed for traders who want to follow strict trend logic while capturing high-probability reversal points. It combines the precision of ZigZag swing points with trend-break confirmation to deliver clear and actionable BUY and SELL signals. Key Features: Strict Trend Following: The indicator identifies uptrends and downtrends using the ZigZag’s higher highs/lower
Price Action Demand & Supply Reversal Dashboard Price Action Demand & Supply Reversal Dashboard is a powerful multi-symbol scanning indicator designed to identify high-probability reversal setups across your entire watchlist and present them in a clean, real-time dashboard. It combines core Smart Money Concepts (SMC) and price action logic into a single tool, helping traders quickly locate the strongest reversal opportunities without manually analyzing dozens of charts. Core Functionality Multi-
Filter:
No reviews
Reply to review