FibRadar

FibRadar v1 Radar direzionale di Fibonacci con segnali di rifiuto giornalieri

FibRadar v1 è un indicatore direzionale basato sul comportamento del prezzo e sulla struttura di Fibonacci. È stato progettato per identificare la direzione del mercato, le zone ad alta probabilità e i segnali intraday di rifiuto, tenendo conto della struttura giornaliera e del momentum.

L’indicatore analizza automaticamente gli estremi recenti del prezzo, traccia cerchi radar di Fibonacci e applica regole direzionali rigorose per allineare il trader al movimento dominante del mercato.

Concetto principale

FibRadar si basa su un prezzo centrale dinamico calcolato a partire dal massimo e dal minimo di un periodo di analisi definito dall’utente.

Da questo centro, l’indicatore proietta zone circolari scalate secondo le proporzioni di Fibonacci, rappresentando visivamente le aree di espansione, esaurimento e la forza del movimento del prezzo.

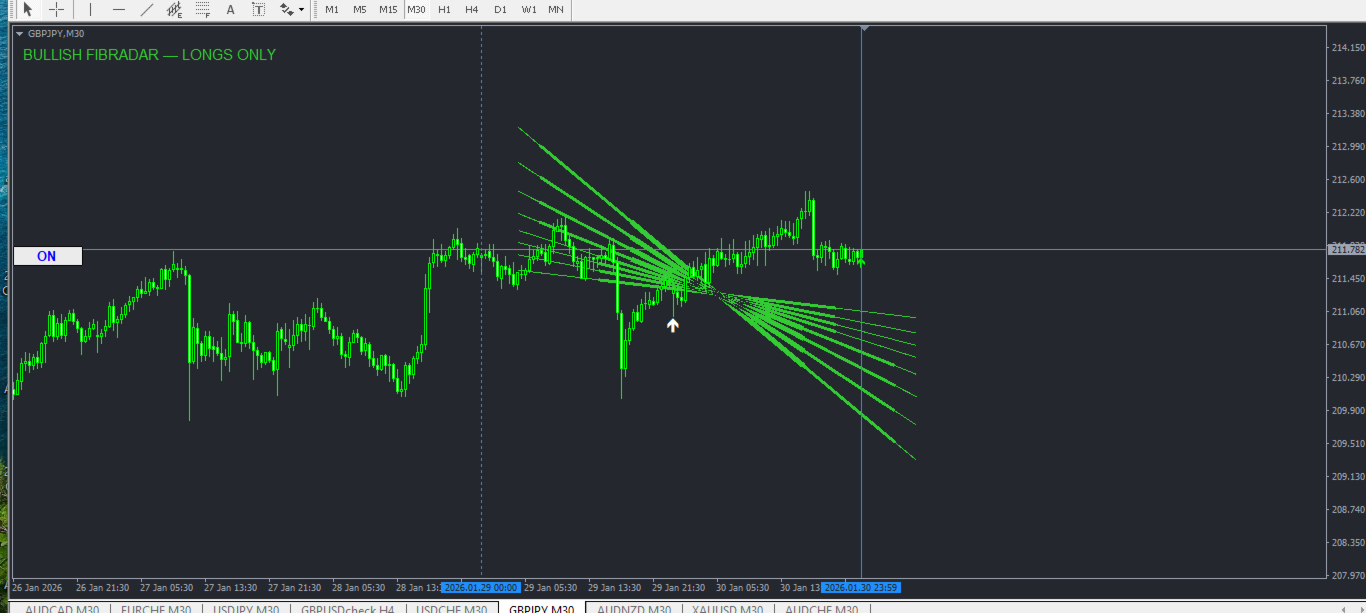
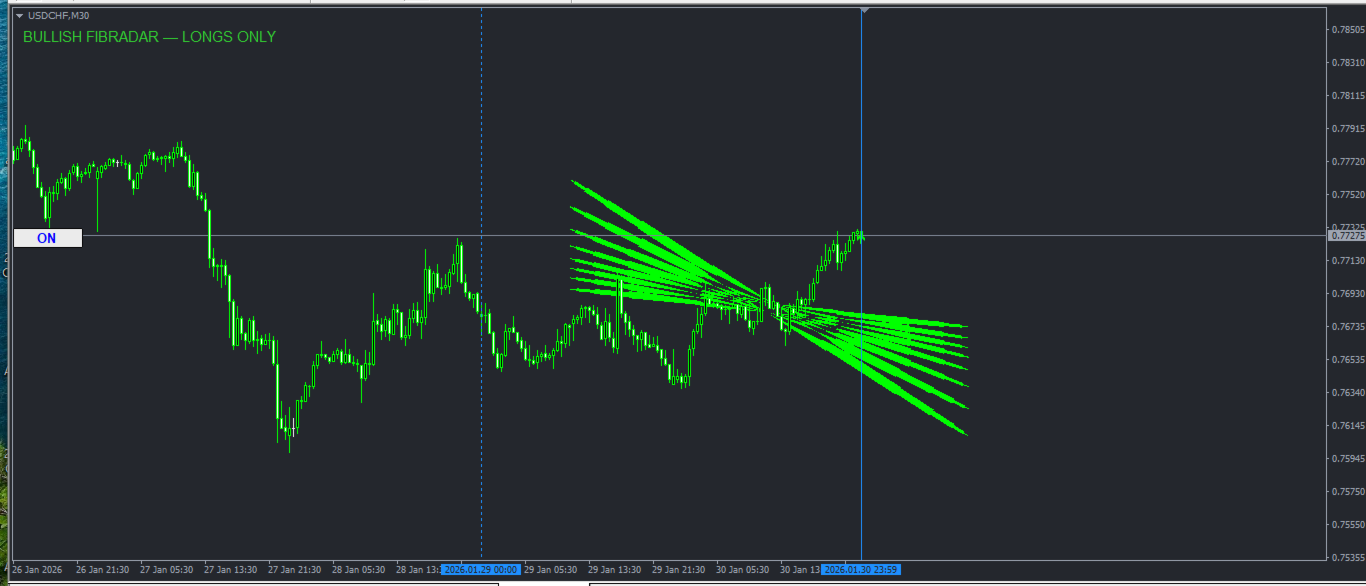
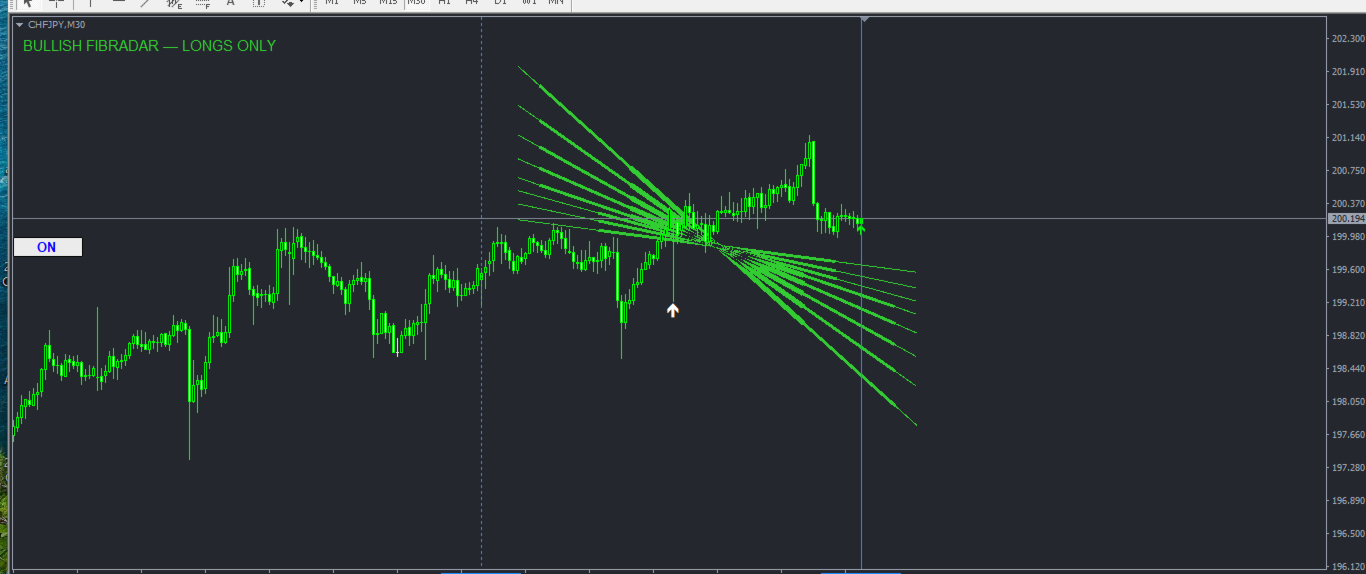
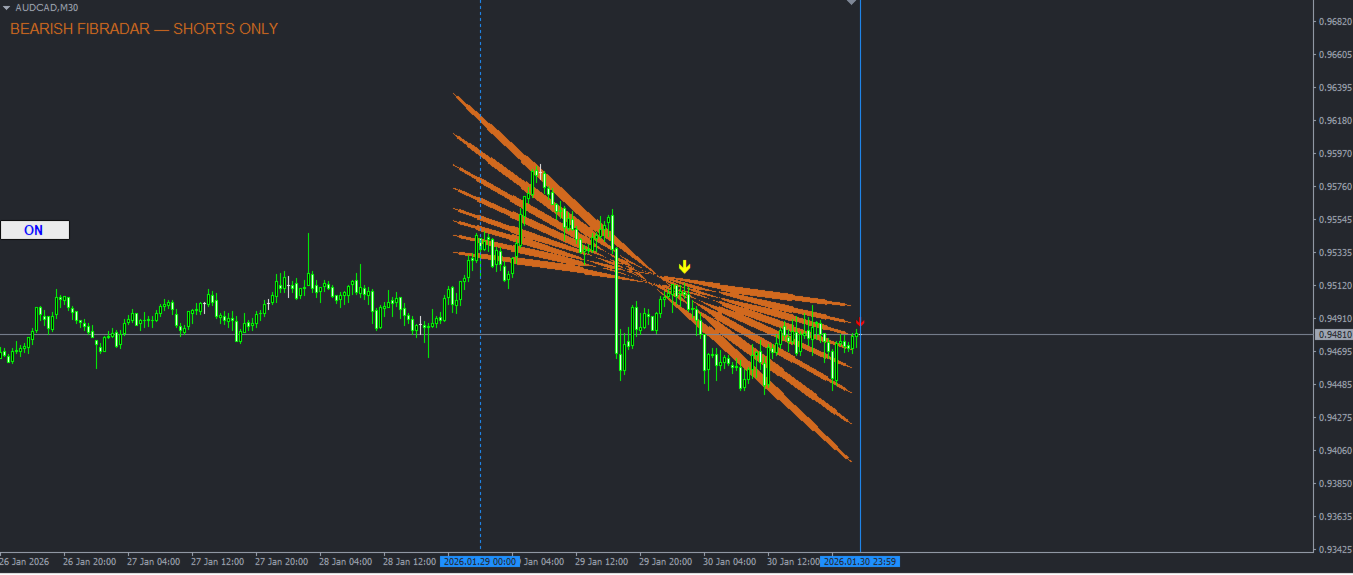
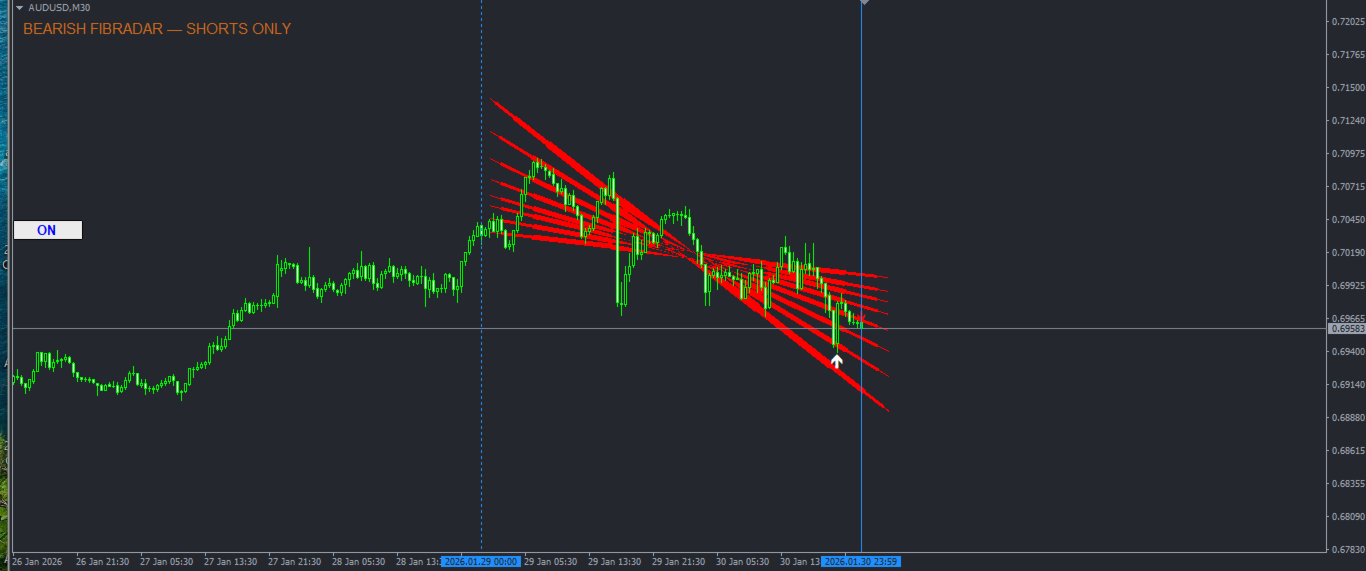
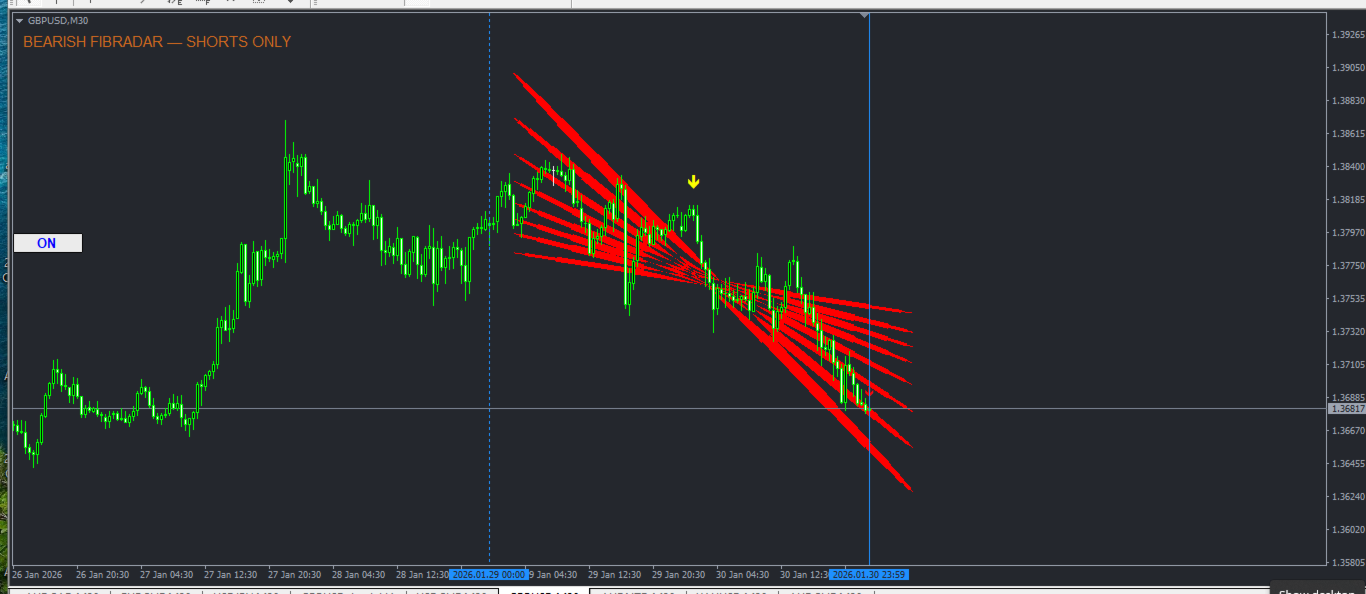
Allo stesso tempo, FibRadar determina se il mercato è rialzista o ribassista e permette segnali solo nella direzione corrispondente.

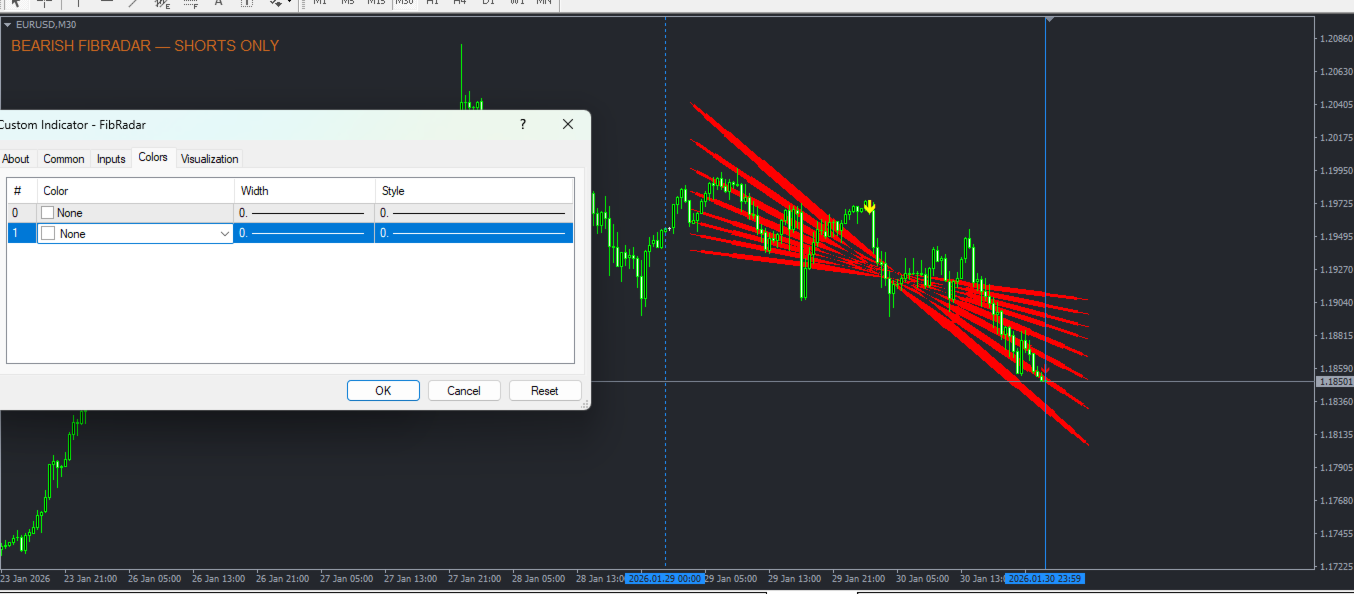
Cerchi radar di Fibonacci

Proporzioni di Fibonacci utilizzate:
0.236 0.382 0.5 0.618 0.786 1.0 1.272 1.618

  • I cerchi vengono tracciati tra l’ultimo massimo e l’ultimo minimo.

  • Si adattano automaticamente alla volatilità del mercato.

  • Il colore dipende dalla direzione del mercato.

  • Modalità rialzista: tonalità di verde

  • Modalità ribassista: tonalità di rosso

Quando il prezzo supera il livello 0.618, il movimento direzionale viene considerato forte e viene generato un avviso di momentum.

Filtro direzionale del mercato

FibRadar valuta continuamente la struttura del mercato per determinare la direzione attuale.

  • Modalità rialzista: consentiti solo acquisti

  • Modalità ribassista: consentite solo vendite

La modalità attiva è chiaramente visualizzata sul grafico per evitare operazioni controtrend.

Segnali di ingresso

I segnali vengono generati solo quando il prezzo conferma la direzione rispetto al centro di FibRadar.

  • Segnale di acquisto

    • Mercato in modalità rialzista

    • Chiusura sopra il centro di FibRadar

  • Segnale di vendita

    • Mercato in modalità ribassista

    • Chiusura sotto il centro di FibRadar

Le notifiche in tempo reale possono essere attivate opzionalmente.

Struttura giornaliera e rilevamento dei rifiuti

FibRadar integra la struttura giornaliera del prezzo.

  • Le linee verticali indicano l’inizio del giorno precedente e la fine del giorno corrente.

  • L’indicatore analizza solo le candele del giorno in corso per individuare pattern di rifiuto.

  • Rifiuto ribassista al massimo giornaliero

  • Rifiuto rialzista al minimo giornaliero

Il rifiuto è definito da predominanza della shadow, lunghezza minima e direzione di chiusura della candela.
Per ridurre il rumore, viene generato un solo segnale di rifiuto al giorno.

Avvisi e notifiche

FibRadar può generare avvisi per segnali di ingresso, forti movimenti direzionali e rifiuti ai massimi o minimi giornalieri.
Supporta notifiche sonore.
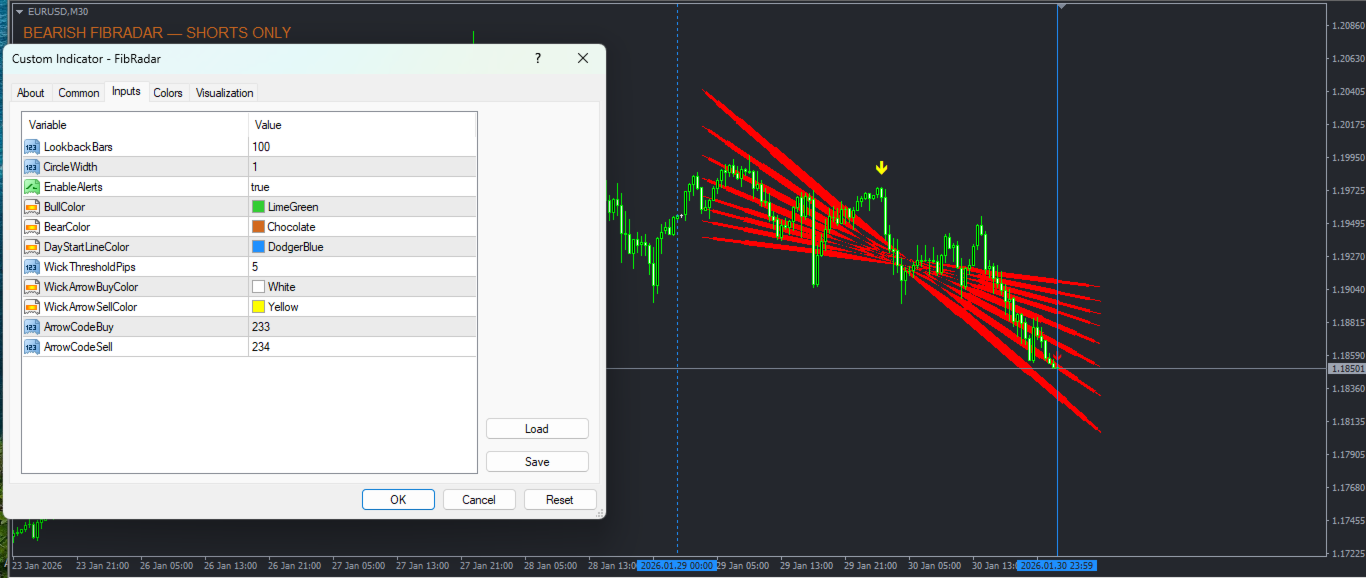
Parametri utente

  • Periodo di analisi per la rilevazione degli estremi

  • Spessore dei cerchi Fibonacci

  • Colori per modalità rialzista e ribassista

  • Attivazione/disattivazione degli avvisi

  • Lunghezza minima della shadow per rilevare un rifiuto

  • Configurazione delle frecce di segnale

Casi d’uso

  • Trading intraday seguendo il trend

  • Strategie di momentum basate su Fibonacci

  • Trading su rifiuti ai massimi/minimi giornalieri

  • Strumento di conferma per scalping e swing trading

Avvertenze importanti

FibRadar non è un sistema di trading autonomo.
Si consiglia di utilizzarlo insieme ad analisi della struttura del mercato, orari di trading e gestione del rischio.


Prodotti consigliati
"Impulses and Corrections 4" is created to help traders navigate the market situation. The indicator shows multi-time frame upward and downward "Impulses" of price movements. These impulses are the basis for determining the "Base" , which is composed of zones of corrections of price movements, as well as "Potential" zones for possible scenarios of price movement. Up and down impulses are determined based on a modified formula of Bill Williams' "Fractals" indicator. The last impulse is always "U
Owl smart levels
Sergey Ermolov
4.26 (38)
Versione MT5  |  FAQ L' indicatore Owl Smart Levels   è un sistema di trading completo all'interno dell'unico indicatore che include strumenti di analisi di mercato popolari come i   frattali avanzati di Bill Williams , Valable ZigZag che costruisce   la corretta struttura a onde   del mercato, e i   livelli di Fibonacci che segnano i livelli esatti di entrata nel mercato e luoghi per prendere profitti. Descrizione dettagliata della strategia Istruzioni per lavorare con l'indicatore Consulente-
TradePilot
Hossein Khalil Alishir
TradePilot Expert Advisor (EA) for MetaTrader 4 TradePilot is a professional and user-friendly Expert Advisor (EA) for MetaTrader 4 (MT4) . It simplifies automated trading , risk management , and trade execution using a smart trading panel . Perfect for beginners and experienced traders looking for a reliable trade manager EA with automated lot size calculation . Key Advantages User-Friendly Trading Panel: Customizable panel with buttons and hotkeys. Smart Risk Management: Supports percen
This scanner is a tool used to support trading. Scanner searches on a wide market, in real time setups, created by mutual arrangements of candles (candles pattern). Its basic features are:  8 implemented trading setups (it is possible to add further setups, additional versions of the scanner),  the possibility of simultaneous scanning, all financial instruments available on the platform,  the possibility of simultaneous scanning, in all timeframes available on the platform,  the ability to manua
Alpha Trend sign has been a very popular trading tool in our company for a long time. It can verify our trading system and clearly indicate trading signals, and the signals will not drift. Main functions: Based on the market display of active areas, indicators can be used to intuitively determine whether the current market trend belongs to a trend market or a volatile market. And enter the market according to the indicator arrows, with green arrows indicating buy and red arrows indicating se
Pro Indicator Trader is a professional trading tool with which you can automate/create a trading strategy using the 31 classical Metatrader 4 indicators.  An elegant and intuitive interface allows you to customize your strategy down to the smallest detail and choose whenever the EA should open a buy or sell position. For each entry-trade rule, you can use up to 14 different indicators. The EA is designed for professional traders, therefore it has many advanced functions. The EA records the order
Candlestick Pattern Scanner is a multi-timeframe and multi-symbol dashboard and alert system that checks all timeframes and currency pairs for different candlestick patterns that are formed in them. Scanner is integrated with support and resistance zones so you can check the candlestick patterns in the most important areas of the chart to find breakout and reversal patterns in the price chart. Download demo version   (works on M30,D1,W1 timeframes and 20 symbols of Market Watch window) Read the
PZ Harmonacci Patterns
PZ TRADING SLU
3.17 (6)
Trade smarter, not harder: Empower your trading with Harmonacci Patterns This is arguably the most complete harmonic price formation auto-recognition indicator you can find for the MetaTrader Platform. It detects 19 different patterns, takes fibonacci projections as seriously as you do, displays the Potential Reversal Zone (PRZ) and finds suitable stop-loss and take-profit levels. [ Installation Guide | Update Guide | Troubleshooting | FAQ | All Products ] It detects 19 different harmonic pric
Auto Fibo Pro m
DMITRII GRIDASOV
Indicatore "Auto FIBO Pro" Crypto_Forex: è un ottimo strumento ausiliario nel trading! - L'indicatore calcola e posiziona automaticamente sul grafico i livelli di Fibo e le linee di tendenza locali (colore rosso). - I livelli di Fibonacci indicano le aree chiave in cui il prezzo può invertirsi. - I livelli più importanti sono 23,6%, 38,2%, 50% e 61,8%. - Puoi usarlo per lo scalping di inversione o per il trading di zone grid. - Ci sono molte opportunità per migliorare il tuo sistema attuale us
Trend PA
Mikhail Nazarenko
5 (3)
The Trend PA indicator uses   Price Action   and its own filtering algorithm to determine the trend. This approach helps to accurately determine entry points and the current trend on any timeframe. The indicator uses its own algorithm for analyzing price changes and Price Action. Which gives you the advantage of recognizing, without delay, a new nascent trend with fewer false positives. Trend filtering conditions can be selected in the settings individually for your trading style. The indicator
Trend Scanner
Vladimir Kalendzhyan
4.33 (6)
By purchasing this indicator, you have the right to receive a free copy of one of   my other indicator's or advisor’s!  (All future updates are included. No limits) . To get it , please contact me by  mql5 message ! The Trend Scanner trend line indicator displays the trend direction and its changes. The indicator works on all currency pairs and  timeframes. The indicator simultaneously displays multiple readings on the price chart: the support and resistance lines of the currency pair, the exist
Verdure Forex Calculators
Olawale Adenagbe
1 (1)
Overview Money management is an all-important aspect of trading that many traders often overlook. It is very possible that even with a winning strategy, bad money management can often result in huge loses. Verdure Forex Calculators aims to help traders minimize risk and exposure in the Forex market. Verdure Forex Calculators implements 4 calculators in one single indicator. It is the first of it's kind on MT4 platform. Calculators implemented are: Lot (Trade or Contract Size) Calculator. Margin
Overview Harmonic Patterns MT4 is a technical analysis indicator designed for the MetaTrader 5 platform. It identifies and displays harmonic price patterns, such as Butterfly, Cypher, Crab, Bat, Shark, and Gartley, in both bullish and bearish directions. The indicator calculates key price levels, including entry, stop loss, and three take-profit levels, to assist traders in analyzing market movements. Visual elements and customizable alerts enhance usability on the chart. Features Detects six ha
Reversal Pattern Pro
Boonyapagorn Rodvattanajinda
Reversal Patterns Pro Reversal Patterns Pro is a Price Action (PA) analytical tool that scans the reversal patterns.  - Finds and marks the most dependable Japanese candlestick patterns in real-time. - Supports all time frames (Best for Scalping) - Doesn't repaint making it an exceptional indicator for Expert Advisors. Input parameters : - Support & Resistance Mode ( true or false ) for enabling advanced filtering - Donchian Period - RSI Period - RSI Oversold Level - RSI Overbought Level - Al
Magic Balance
Daniil Evstratenko
The indicator shows which trading pairs, strategies, robots and signals that you use are profitable and which are not. The statistic of trades and balance graph are displayed in the account currency and pips - to switch simply click on the graph. button "$"(top left) - minimize/expand and move the indicator panel button ">"(bottom right) - stretching and resetting to the original size Statistic of trades 1 line - account balance, current profit and lot of open trades; 2 line - the number of all
"Adjustable Fractals" - è una versione avanzata dell'indicatore frattale, uno strumento di trading molto utile! - Come sappiamo, l'indicatore mt4 Standard fractals non ha impostazioni, il che è molto scomodo per i trader. - Adjustable Fractals ha risolto questo problema, ha tutte le impostazioni necessarie: - Periodo regolabile dell'indicatore (valori consigliati: superiori a 7). - Distanza regolabile dai massimi/minimi del prezzo. - Design regolabile delle frecce frattali. - L'indicatore è do
Noize Absorption Index MT4
Ekaterina Saltykova
5 (1)
Noize Absorption Index - is the manual trading system that measures the difference of pressure between bears forces and bulls forces. Green line - is a noize free index that showing curent situation. Zero value of index shows totally choppy/flat market.Values above zero level shows how powerfull bullish wave is and values below zero measures bearish forces.Up arrow appears on bearish market when it's ready to reverse, dn arrow appears on weak bullish market, as a result of reverse expectation. S
PullbackMatrix provides the key information of the trading transactions when it finds the right market moment based on its built-in logic algorithm. The high accuracy signals including Trading Symbol, Entry Price, Entry Time, TakeProfit, Stoploss, and more. And that's all will be available instantly in your chart panel, drawing the position lines and also sending signal notification to email, mobile phone, and screen popup. More important is that also saves signals into a .csv file which is usef
This is an arrow indicator without a future function,developed based on the most advanced profit trading algorithms.It has the most innovative and advanced dual trend analysis module, as well as the latest and highly effective market trend prediction algorithm.Trends are your friends, and following larger trends can earn the maximum profit in foreign exchange. This indicator helps traders identify current trends and track them. Someone once made a profit of 10 times in a week by relying on it.No
Trendiness Index
Libertas LLC
5 (3)
"The trend is your friend" is one of the best known sayings in investing, because capturing large trendy price movements can be extremely profitable. However, trading with the trend is often easier said than done, because many indicators are based on price reversals not trends. These aren't very effective at identifying trendy periods, or predicting whether trends will continue. We developed the Trendiness Index to help address this problem by indicating the strength and direction of price trend
Gold Phoenix
Yaroslav Varankin
The perfect tool for Scalng in the Forex markets You can trade both from signal to signal and using take profit  The algorithm does not use Zigzag!  No redrawing!  This is a channel instrument that uses a moving average as a filter. Moving Average  There are 2 parameters for the settings Ma Period = 5 period Moving Average  Channel 1.0 distance of channel lines from the chart Price Signal Filter - calculation of signal opening and filter There is a complete set of Alert There is a multi-timefram
Trade with Gann on your side!! MASTER CIRCLE 360 CIRCLE CHART, originally created by Gann admitted that this is “The Mother of all charts”. It is one of the last studies that this great trader left for us. The numeric tab le is apparently quite simple like all the tables and is based on square numbers, the SQUARE OF 12 and is by evolution, one of the most important square numbers. Here we can find CYCLE, PRICE AND TIME thanks to angles and grades, to show past and future support and resistance.
Risk Commander
Adisorn Soodkanueng
Product Name: Risk Commander: Trade Assistant & Strategy Simulator Risk Commander is more than just a trade panel—it is a complete Manual Trading Ecosystem . It serves two powerful purposes: Live Assistant: Helps you execute trades with speed, precision, and perfect risk management in real-time markets. Training Simulator: Fully compatible with the Strategy Tester (Visual Mode) , allowing you to practice manual trading on historical data without risking a cent. NEW! Built-in Simulator Mode S
Fibonacci retracement and extension line drawing tool Fibonacci retracement and extended line drawing tool for MT4 platform is suitable for traders who use  golden section trading Advantages: There is no extra line, no too long line, and it is easy to observe and find trading opportunities Trial version: https://www.mql5.com/zh/market/product/35884 Main functions: 1. Multiple groups of Fibonacci turns can be drawn directly, and the relationship between important turning points can be seen
Price Magnet — Price Density and Attraction Levels Indicator Price Magnet is a professional analytical tool designed to identify key support and resistance levels based on statistical Price Density. The indicator analyzes a specified historical period and detects price levels where the market spent the most time. These zones act as “magnets,” attracting price action or forming a structural base for potential reversals. Unlike traditional Volume Profile tools, Price Magnet focuses on price-time d
Trend Ray
Andriy Sydoruk
The indicator shows the potential trend direction by cyclical-wave dependence. Thus, all the rays of the intersection will be optimal rays, in the direction of which the price is expected to move, taking into account the indicator period. Rays can be used as a direction for potential market movement. But we must not forget that the approach must be comprehensive, the indicator signals require additional information to enter the market.
We present you the indicator "Candle closing counter", which will become your indispensable assistant in the world of trading. That’s why knowing when the candle will close can help: If you like to trade using candle patterns, you will know when the candle will be closed. This indicator will allow you to check if a known pattern has formed and if there is a possibility of trading. The indicator will help you to prepare for market opening and market closure. You can set a timer to create a pre
The Th3Eng PipFinite indicator is based on a very excellent analysis of the right trend direction with perfect custom algorithms. It show the true direction and the best point to start trading. With StopLoss point and Three Take Profit points. Also it show the right pivot of the price and small points to order to replace the dynamic support and resistance channel, Which surrounds the price. And Finally it draws a very helpful Box on the left side on the chart includes (take profits and Stop loss
RSI Speed mp
DMITRII GRIDASOV
Indicatore Crypto_Forex "RSI SPEED" per MT4 - ottimo strumento predittivo, senza bisogno di ridisegnare. - Il calcolo di questo indicatore si basa su equazioni fisiche. L'RSI SPEED è la derivata prima dell'RSI stesso. - L'RSI SPEED è ottimo per scalping di ingresso nella direzione del trend principale. - Usalo in combinazione con un indicatore di trend appropriato, ad esempio HTF MA (come nelle immagini). - L'indicatore RSI SPEED mostra la velocità con cui l'RSI cambia direzione: è molto sensi
Chart Patterns Detect 15 patterns (Ascending Triangle, Descending Triangle, Rising Wedge, Falling Wedge, Bullish Flag, Bearish Flag, Bullish Rectangle, Bearish Rectangle Symmetrical triangle, Head and Shoulders, Inverted Head and Shoulders, Triple top, Triple Bottom, Double Top, Double Bottom) Use historical data to calculate the probability of each pattern to succeed (possibility to filter notification according to the chance of success) gives graphic indication about the invalidation level and
Gli utenti di questo prodotto hanno anche acquistato
Scalper Inside PRO
Alexey Minkov
4.74 (69)
An exclusive indicator that utilizes an innovative algorithm to swiftly and accurately determine the market trend. The indicator automatically calculates opening, closing, and profit levels, providing detailed trading statistics. With these features, you can choose the most appropriate trading instrument for the current market conditions. Additionally, you can easily integrate your own arrow indicators into Scalper Inside Pro to quickly evaluate their statistics and profitability. Scalper Inside
Atomic Analyst
Issam Kassas
5 (3)
Innanzitutto, vale la pena sottolineare che questo indicatore di trading non è repaint, non è ridisegno e non presenta ritardi, il che lo rende ideale sia per il trading manuale che per quello automatico. Manuale utente: impostazioni, input e strategia. L'Analista Atomico è un indicatore di azione del prezzo PA che utilizza la forza e il momentum del prezzo per trovare un miglior vantaggio sul mercato. Dotato di filtri avanzati che aiutano a rimuovere rumori e segnali falsi, e aumentare il pote
Attualmente 40% di sconto! La soluzione migliore per ogni principiante o trader esperto! Questo software per cruscotti funziona su 28 coppie di valute. Si basa su 2 dei nostri indicatori principali (Advanced Currency Strength 28 e Advanced Currency Impulse). Offre un'ottima panoramica dell'intero mercato Forex. Mostra i valori di forza delle valute avanzate, la velocità di movimento delle valute e i segnali per 28 coppie Forex in tutti i (9) timeframe. Immaginate come migliorerà il vostro tra
GOLD Impulse with Alert
Bernhard Schweigert
4.64 (11)
Questo indicatore è una super combinazione dei nostri 2 prodotti Advanced Currency IMPULSE with ALERT  +   Currency Strength Exotics . Funziona per tutti i time frame e mostra graficamente l'impulso di forza o debolezza per le 8 valute principali più un simbolo! Questo indicatore è specializzato nel mostrare l'accelerazione della forza delle valute per qualsiasi simbolo come oro, coppie esotiche, materie prime, indici o futures. Primo nel suo genere, qualsiasi simbolo può essere aggiunto all
RFI levels PRO
Roman Podpora
5 (1)
L'indicatore mostra accuratamente i punti di inversione e le zone di ritorno dei prezzi in cui il       Principali attori   . Vedi dove si formano le nuove tendenze e prendi decisioni con la massima precisione, mantenendo il controllo su ogni operazione. VERSION MT5     -     Rivela il suo massimo potenziale se combinato con l'indicatore   TREND LINES PRO Cosa mostra l'indicatore: Strutture di inversione e livelli di inversione con attivazione all'inizio di un nuovo trend. Visualizzazione dei l
Dynamic Forex28 Navigator
Bernhard Schweigert
4.43 (7)
Dynamic Forex28 Navigator - Lo strumento di trading Forex di nuova generazione. ATTUALMENTE SCONTATO DEL 49%. Dynamic Forex28 Navigator è l'evoluzione dei nostri indicatori popolari di lunga data, che combinano la potenza di tre in uno: Advanced Currency Strength28 Indicator (695 recensioni) + Advanced Currency IMPULSE con ALERT (520 recensioni) + CS28 Combo Signals (Bonus). Dettagli sull'indicatore https://www.mql5.com/en/blogs/post/758844 Cosa offre l'indicatore di forza di nuova generazione?
Trend Lines PRO
Roman Podpora
5 (1)
LINEE DI TENDENZA PRO       Aiuta a capire dove il mercato sta realmente cambiando direzione. L'indicatore mostra reali inversioni di tendenza e punti in cui i principali attori rientrano. Vedi  Linee BOS   Cambiamenti di tendenza e livelli chiave su timeframe più ampi, senza impostazioni complesse o rumore inutile. I segnali non vengono ridisegnati e rimangono sul grafico dopo la chiusura della barra. VERSIONE MT 5     -      Svela il suo massimo potenziale se abbinato all'indicatore   RFI LEVE
The Nihilist 5.0 Indicator includes Forexalien and Nihilist Easy Trend trading strategies and systems. It is composed of an MTF Dashboard where you can analyze the different input possibilities of each strategy at a glance. It has an alert system with different types of configurable filters. You can also configure which TF you want to be notified on your Metatrader 4 platform and Mobile application The indicator has the option to view how could be a TP and SL by using ATR or fixed points, even w
Trend Screener
STE S.S.COMPANY
4.79 (95)
Indicatore di tendenza, soluzione unica rivoluzionaria per il trading di tendenze e il filtraggio con tutte le importanti funzionalità di tendenza integrate in un unico strumento! È un indicatore multi-timeframe e multi-valuta al 100% non ridipingibile che può essere utilizzato su tutti i simboli/strumenti: forex, materie prime, criptovalute, indici e azioni. OFFERTA A TEMPO LIMITATO: l'indicatore di screening di supporto e resistenza è disponibile a soli 50$ e a vita. (Prezzo originale 250$) (o
El indicador "MR BEAST ALERTAS DE LIQUIDEZ" es una herramienta avanzada diseñada para proporcionar señales y alertas sobre la liquidez del mercado basándose en una serie de indicadores técnicos y análisis de tendencias. Ideal para traders que buscan oportunidades de trading en función de la dinámica de precios y los niveles de volatilidad, este indicador ofrece una visualización clara y detallada en la ventana del gráfico de MetaTrader. Características Principales: Canal ATR Adaptativo: Calcula
Weis Wave with Alert
Trade The Volume Waves Single Member P.C.
4.82 (22)
Rental/Lifetime Package Options and Privileges' Rent Monthly Six Months   Yearly/Lifetime Weis Wave with Speed with Alert+Speed Index x x x Manual  x x x Quick Set up Video x x x Blog x x x Lifetime Updates x x x Setup and Training Material x x Rectangle Break Alert Tool      x Discord Access Channel "The SI traders" x   How to trade info visit:    http://www.tradethevolumewaves.com   ** If you purchase please contact me to setup your  : training Room and  complete manual access.  This is
Volatility Trend System - un sistema di trading che fornisce segnali per le voci. Il sistema di volatilità fornisce segnali lineari e puntuali nella direzione del trend, nonché segnali per uscirne, senza ridisegnare e ritardi. L'indicatore di tendenza monitora la direzione della tendenza a medio termine, mostra la direzione e il suo cambiamento. L'indicatore di segnale si basa sui cambiamenti della volatilità e mostra gli ingressi nel mercato. L'indicatore è dotato di diversi tipi di avvisi. Pu
TPA True Price Action indicator reveals the true price action of the market makers through 100% non-repainting signals (except early signals mode) strictly at the close of a candle! TPA shows entries and re-entries, every time the bulls are definitely stronger than the bears and vice versa. Not to confuse with red/green candles. The shift of power gets confirmed at the earliest stage and is ONE exit strategy of several. There are available now two free parts of the TPA User Guide for our custom
Advanced Supply Demand
Bernhard Schweigert
4.91 (299)
Speciale Trading- SCONTO DEL 40% La soluzione migliore per qualsiasi trader principiante o esperto! Questo indicatore è uno strumento di trading unico, di alta qualità e conveniente, perché abbiamo incorporato una serie di funzionalità proprietarie e una nuova formula. Con questo aggiornamento, potrai visualizzare doppie zone di timeframe. Non solo potrai visualizzare un TF più alto, ma anche entrambi, il TF del grafico e il TF più alto: MOSTRA ZONE ANNIDATE. Tutti i trader che operano con Of
Adaptive Volatility Range [AVR] is a powerful tool for identifying key trend reversal points. AVR accurately reflects the Average True Range (ATR) of volatility, taking into account the Volume-Weighted Average Price (VWAP). The indicator adapts to any market volatility by calculating the average volatility over a specific period, ensuring a stable rate of profitable trades. You receive not just an indicator but a professional automated trading system , AVR-EA . Advantages: Automated Trading Sys
Un indicatore tecnico che struttura i grafici e identifica i movimenti ciclici dei prezzi. Può funzionare su qualsiasi grafico. Diversi tipi di notifiche. Ci sono altre frecce sul grafico stesso. Senza ridisegnare la storia, lavora sulla chiusura della candela. TF consigliati da M5 in su. Parametri facili da usare e configurare. Se si utilizzano 2 indicatori con parametri diversi, è possibile utilizzarli senza altri indicatori. Ha 2 parametri di input Ciclicità e durata del segnale Questi 2 pa
Currency Strength Exotics
Bernhard Schweigert
4.88 (33)
ATTUALMENTE SCONTATO DEL 20%! La soluzione migliore per qualsiasi principiante o trader esperto! Questo indicatore è specializzato nel mostrare la forza della valuta per qualsiasi simbolo come coppie esotiche, materie prime, indici o futures. È il primo nel suo genere, qualsiasi simbolo può essere aggiunto alla nona riga per mostrare la vera forza della valuta di Oro, Argento, Petrolio, DAX, US30, MXN, TRY, CNH ecc. Si tratta di uno strumento di trading unico, di alta qualità e conveniente pe
No Repaint Bext
Andrey Kozak
1 (1)
No Repaint Bext is a ready-made trading system. Shows when to open and when to close trades, as well as in which direction. Every time a green arrow appears, you need to open a buy trade. Close all buy trades when a red arrow appears. The same goes for the opposite direction, every time a red arrow appears, open sell trades and close them all when a green arrow appears. We use the M5 timeframe for trading. You can trade on any cozy pair. This indicator does not repaint and practically does not
Are you looking for a simple and reliable indicator that can help you spot market swing points easily? Do you want clear buy and sell signals that work on any timeframe and any trading instrument? Buy Sell Signal Pro is designed to do exactly that. It helps traders identify important market turning points and understand the current market structure in a clear and easy way. This indicator detects Higher Highs (HH), Higher Lows (HL), Lower Highs (LH), and Lower Lows (LL) so you can quickly see wh
Se acquisti questo indicatore, riceverai il mio Trade Manager Professionale   + EA  GRATUITAMENTE. Innanzitutto è importante sottolineare che questo sistema di trading è un indicatore Non-Repainting, Non-Redrawing e Non-Lagging, il che lo rende ideale sia per il trading manuale che per quello automatico. Corso online, manuale e download di preset. Il "Sistema di Trading Smart Trend MT5" è una soluzione completa pensata sia per i trader principianti che per quelli esperti. Combina oltre 10 indic
Smc Blast Signal
Mohit Dhariwal
3.4 (5)
OFFER OFFER! The price of the indicator is kept at 75 dollars only from 20th Feb to 28th Feb. Full Fledged EA and Alert plus for alerts will also be provided in this offer along with the purchase of Indicator. Limited copies only at this price and Ea too. Grab your copy soon Alert plus for indicator with set file is kept in comment section with the image  SMC Blast Signal with FVG, BOS and trend Breakout The SMC Blast Signal is a Precise trading system for Meta Trader 4 that uses Smart Money Con
PipFinite Volume Critical
Karlo Wilson Vendiola
4.61 (28)
Volume Gives Depth To Price Action! Volume Critical can accurately locate the cheapest areas to place trades. Enter reversals as early as possible to get the best Risk Reward setups! Features Aggressive algorithm that anticipates reversals Volume Classifications Gray Histograms - Normal Volume, average market activity Orange Histogram - Trending Volume, increased market activity Pink Histograms - Overbought Volume, we can wait for further confirmation to sell Blue Histograms - Oversold Conditio
CRT Multi-Timeframe Market Structure & Liquidity Sweep Indicator Non-Repainting | Multi-Asset | MT5 Version Available MT5 Version:   https://www.mql5.com/en/market/product/162075 Full User Guide — explains what each feature does and why:   https://www.mql5.com/en/blogs/post/767525 Quick Start User Guide  — explains how to configure and in what order:  https://www.mql5.com/en/blogs/post/767540 Indicator Overview CRT Ghost Candle HTF Fractal is a complete institutional-grade market structure too
Harmonic ABCD Universal
Mihail Matkovskij
5 (2)
The indicator displays harmonic ABCD patterns, as well as the market entry points, which allows the trader to make trading decisions quickly. Harmonic ABCD Universal is one of the few indicators that predict price movement by determining pivot points with a rather high probability long before the pivot itself. It supports sending push and email notifications, as well as alerts. The indicator scans all possible combinations on the chart for the current moment, and also in history, with the help o
Indicatore Miraculous – Strumento Forex e Binario 100% Non-Repaint Basato sul Quadrato di Nove di Gann Questo video presenta l' Indicatore Miraculous , uno strumento di trading altamente accurato e potente, sviluppato specificamente per i trader di Forex e Opzioni Binarie . Ciò che rende unico questo indicatore è la sua base sul leggendario Quadrato di Nove di Gann e sulla Legge della Vibrazione di Gann , rendendolo uno degli strumenti di previsione più precisi disponibili nel trading moderno. L
ATTUALMENTE SCONTATO DEL 40% La soluzione migliore per ogni principiante o trader esperto! Questo indicatore è uno strumento di trading unico, di alta qualità e conveniente perché abbiamo incorporato una serie di caratteristiche proprietarie e una nuova formula. Con un solo grafico è possibile leggere la forza delle valute per 28 coppie Forex! Immaginate come migliorerà il vostro trading perché sarete in grado di individuare l'esatto punto di innesco di una nuova tendenza o di un'opportunità
Supply and Demand Dashboard PRO
Bernhard Schweigert
4.8 (20)
Attualmente 40% di sconto! Questo cruscotto è un software molto potente che lavora su più simboli e fino a 9 timeframe. Si basa sul nostro indicatore principale (migliori recensioni: Advanced Supply Demand ).   Il cruscotto offre un'ottima panoramica. Mostra:    Valori filtrati di domanda e offerta, compresa la valutazione della forza delle zone, distanze dei pip da/all'interno delle zone, Evidenzia le zone annidate, Fornisce 4 tipi di allarmi per i simboli scelti in tutti i (9) time-frames.
Sniper Delta Imbalance is a professional tool for deep delta analysis — the difference between buyer and seller volumes. It takes volume analysis to the next level, allowing traders to see in real time who controls the price — buyers or sellers — and to find precise entry points based on the actions of major market participants. This tool represents a unique style of analysis based on the ratio of demand and supply volumes and can be used to detect who holds control over price. At the core o
PairMaster Buy Sell Arrow Indicator for MT4 Trade Reversals Like a Pro — Catch Every Swing Point with Precision The PairMaster Buy Sell Arrow Indicator is a powerful MetaTrader 4 tool built to identify high-probability swing trading opportunities . Designed for traders who value accuracy, clarity, and simplicity, PairMaster detects key market turning points and plots intuitive buy and sell arrows directly on your chart. Key Features Accurate Swing Point Detection – Automatically identifies ma
# CurrencyMeter Pro - Professional Multi-Market Strength Analyzer ## Overview CurrencyMeter Pro is a powerful real-time momentum analyzer that tracks the strength of currencies, cryptocurrencies, indices, metals, and energy markets at a glance. Make smarter trading decisions by instantly identifying the strongest and weakest instruments across multiple asset classes. Whether you're a forex trader looking to pair strong currencies against weak ones, or a multi-asset trader seeking momentum co
Altri dall’autore
Trend Reversal Zone and Alert Zone di Offerta & Domanda Multi-Timeframe + Segnali Precisi di Inversione di Trend Trend Reversal Zone and Alert è un indicatore professionale non repaint , progettato per i trader che vogliono identificare inversioni di trend ad alta probabilità su livelli chiave istituzionali . L’indicatore combina in modo intelligente zone di offerta e domanda sui timeframe superiori (H4 e D1) con segnali precisi di rifiuto sui massimi e minimi giornalieri , consentendo ingressi
ULTIMATE PRO PANEL WITH TRADE THE RANGE SYSTEM (MT4) Descrizione dell’Indicatore ULTIMATE PRO PANEL WITH TRADE THE RANGE SYSTEM è un indicatore avanzato di supporto alle decisioni per MetaTrader 4 che trasforma analisi di mercato complesse in un sistema di trading semplice e visivo. Valuta le condizioni di mercato in tempo reale utilizzando modelli quantitativi, aiutando a identificare opportunità ad alta probabilità e zone di prezzo chiave. Il sistema combina analisi probabilistica e logica di
FREE
Ultimate Scalper Zone
Godwin Edward Enyali
Scalpers Zone – Indicatore definitivo di Supply/Demand + Rifiuto Stocastico & Triple Touch Scalpers Zone è progettato per trader che cercano ingressi a scalp ad alta probabilità. Rileva le zone di supply/demand giornaliere e settimanali (7 giorni) e mette in evidenza le aree in cui queste zone si allineano perfettamente, segnando i punti di inversione più forti. Per asset volatili come criptovalute e oro, lo spessore delle zone può essere aumentato per una migliore visibilità e precisione. Carat
Istogramma Multi-Temporale di Domanda e Offerta (Multi-Timeframe Supply Demand Histogram) Descrizione: L’Istogramma Multi-Temporale di Domanda e Offerta è un indicatore potente e chiaro che mostra la forza della domanda e dell’offerta su più timeframe, specificamente H4 e D1. Visualizza istogrammi che evidenziano quando predominano acquirenti o venditori, permettendo ai trader di identificare rapidamente le principali aree di pressione del mercato. Caratteristiche principali: Istogrammi H4 & D
FREE
TrendSeeker Dashboard
Godwin Edward Enyali
Cruscotto TrendSeeker ― Filtro di mercato intelligente per operazioni ad alta probabilità Il cruscotto TrendSeeker è uno strumento di analisi di mercato multi-simbolo potente, progettato per evitare i mercati laterali e concentrarsi solo su strumenti di alta qualità con trend nel timeframe H4 . Il cruscotto scansiona continuamente tutti i simboli disponibili e classifica ogni coppia come segue: Trend rialzista (Trending UP) Trend ribassista (Trending DOWN) Mercato laterale / No-trade (Ranging /
FREE
Impulse Zone Hunter
Godwin Edward Enyali
Impulse Zone Hunter – Strumento di Trading di Precisione Impulse Zone Hunter è un indicatore MT4 ad alte prestazioni progettato per fornire ai trader un vantaggio visivo chiaro nell’individuazione dei movimenti di mercato ad alta probabilità. Si concentra su zone di Supply & Demand , Order Block e ChoCH (Change of Character) , fornendo segnali chiari direttamente sul grafico . Funzionalità principali 1. Trading in modalità doppia Visualizza a scelta le zone Supply & Demand o gli Order Block con
Massimizza il tuo trading allineato alla tendenza con H4 & M30 Turning Point PRO! Dì addio alle supposizioni e al disordine sul grafico. Questo indicatore premium combina il rilevamento della tendenza su timeframe più alti con segnali precisi di punti di svolta a breve termine, offrendoti opportunità di acquisto e vendita chiare. Perché i trader lo amano: Bias di tendenza H4 EMA200: Conosci la tendenza dominante a colpo d’occhio. Opera solo nella direzione della tendenza. Frecce di esecuzione M3
TrendSeeker Pro – Dashboard Definitivo di Trend & Punti di Inversione + Rilevatore di Range H4 Ultimate Trend & Turning Point Dashboard è un sistema completo multi-timeframe progettato per aiutare i trader a rimanere dalla parte giusta della tendenza, eliminare condizioni di mercato a bassa probabilità e fornire entrate precise ai punti di inversione con sicurezza. Non è solo un indicatore. È un vero e proprio framework di trading che risponde a tre domande critiche prima ancora di aprire una po
Ultimate Daily SR Zones + Rejection Arrows  Ultimate Daily SR Zones is a powerful price-action indicator that helps traders clearly identify the most important daily market levels — the previous day’s High , Low , Midline , and opening/closing reference points. It also detects wick rejection signals and plots automatic Buy and Sell arrows when the market rejects these zones. This tool is perfect for intraday and swing traders who use daily levels for breakout, reversal, or retest strategies.  Wh
Ultimate Market Master Trend Master the Market’s Direction with Precision The Ultimate Market Master Trend indicator is an all-in-one market sentiment analyser designed for traders who demand clarity, accuracy, and confidence in every move. It combines smart trend detection, multi-timeframe stochastic momentum, and dynamic visual cues to help you identify high-probability entries and exits with ease.  Key Features  1. Smart Trend System (Main Chart) Uses a 200-period LWMA baseline to determine
Ultimate Super Rejection Zones is a powerful MT4 indicator designed to detect accurate intraday reversal points using a combination of: Previous Day High & Low Midline equilibrium zone Rejection candle patterns Double-layer confirmation using two Stochastic filters Smart alert and arrow system Daily auto-reset filtering Optional trend filter using Moving Averages The indicator helps traders find high-probability reversal entries at premium and discount zones. It automatically marks:  Sell Reject
Buy & Sell Levels with Alerts is a comprehensive trading indicator that combines Stochastics, Previous Day Levels, Multi-Timeframe (MTF) Trend Meter , and rejection detection into one powerful tool. It helps traders quickly spot key support/resistance zones, trend direction, and high-probability reversal signals with visual arrows and automated alerts. Key Features: Stochastic Oscillator: Displays fast (%K) and slow (%D) lines in a separate window. Helps identify overbought and oversold conditio
Trade The Range
Godwin Edward Enyali
Trade the Range – Rilevatore di Mercato in Range H4 & Zone SR Giornaliere con Avvisi di Rifiuto Wick Panoramica: “Trade the Range” è uno strumento di trading di precisione progettato per trader che vogliono concentrarsi esclusivamente sui mercati in range ad alta probabilità . Invece di seguire ciecamente ogni trend, questo indicatore identifica automaticamente quando il mercato si sta consolidando sul timeframe H4 e ti guida a operare con fiducia nelle zone superiore e inferiore del range. Car
PREMIUM SUPPLY AND DEMAND ZONES WITH ALERTS Premium Supply and Demand Zones with Alerts è un indicatore professionale Smart Money che combina zone di domanda e offerta istituzionali con un istogramma di tendenza multi-timeframe , fornendo segnali di rifiuto del prezzo altamente affidabili . L’indicatore individua automaticamente le zone premium di domanda e offerta sul grafico principale e conferma gli ingressi tramite una logica di rifiuto basata sulle ombre delle candele . I segnali vengono ge
Moving Average of Supply and Demand è un indicatore di trend following potente e intuitivo, progettato per aiutare i trader a capire chiaramente la direzione del mercato e a entrare nelle operazioni con sicurezza, anche senza conoscenze tecniche avanzate. A differenza delle medie mobili tradizionali basate sul prezzo, questo indicatore applica una tecnica di smoothing alla pressione di domanda e offerta, visualizzandola direttamente sul grafico dei prezzi sotto forma di istogramma dinamico. Ciò
Zone di Acquisto e Vendita Istituzionali con Avvisi Panoramica: “Zone di Acquisto e Vendita Istituzionali con Avvisi” è un indicatore professionale tutto-in-uno che combina linee di tendenza giornaliere, segnali di cambio di carattere (CHoCH) e zone istituzionali di domanda/offerta su 7 giorni, offrendo ai trader una visione chiara della struttura del mercato, della direzione del trend e dei punti di inversione ad alta probabilità. Caratteristiche principali: Rilevamento delle linee di tendenza
FibStrike Rejection è un potente indicatore per MT4, progettato per i trader che vogliono visualizzare zone di acquisto e vendita ad alta probabilità utilizzando i ritracciamenti di Fibonacci combinati con segnali di wick rejection (rigetto del bordo della candela) . L’indicatore individua automaticamente i massimi e minimi recenti basandosi su un periodo di lookback personalizzabile e traccia i livelli di Fibonacci dal 100% al 40% . Le zone di acquisto e vendita vengono evidenziate all’interno
Liquidity Sentinel Pro – Dashboard Multi-TF & Avvisi di Rifiuto delle Candele Descrizione: Liquidity Sentinel Pro è un potente indicatore MT4 “tutto-in-uno”, progettato per offrire ai trader una visione completa della dinamica del mercato combinando l’analisi delle tendenze multi-timeframe, la forza di domanda/offerta e avvisi precisi di rifiuto delle candele. Questo strumento fornisce informazioni operative su quali coppie di valute o asset sono in trend, evidenzia punti di inversione ad alta p
Reversal Channel Alert Pro è un indicatore avanzato progettato per rilevare rapidamente i ritorni di tendenza e indicare con precisione la direzione futura dei prezzi. L’indicatore combina un doppio canale di regressione lineare ottimizzato con l’analisi del comportamento dei prezzi per fornire segnali di acquisto e vendita chiari e tempestivi. È particolarmente indicato per i trader che desiderano entrare nel mercato ai primi segnali di una nuova tendenza. Funzionalità principali Rilevamento pr
Industry Machine
Godwin Edward Enyali
Industry Machine è uno strumento multifunzionale progettato per i trader, che combina in un unico indicatore un cruscotto, zone di acquisto e vendita, segnali di inversione e un istogramma multi-timeframe. Permette di monitorare in tempo reale i movimenti del mercato e la forza delle coppie di valute, facilitando decisioni di trading rapide e informate. Il cruscotto principale controlla tutte le coppie sui timeframe H4 e M30, indicando se ogni coppia è rialzista o ribassista e mostrando la sua f
Extreme Pro Engine
Godwin Edward Enyali
EXTREME PRO ULTRA CLEAN trasforma un’analisi di mercato complessa in un framework decisionale visivo chiaro , progettato per identificare ambienti di trading ad alta probabilità. Invece di basarsi su indicatori in ritardo o interpretazioni soggettive, il sistema valuta le reali condizioni di mercato utilizzando: Average Daily Range (ADR) bias direzionale derivato dal Daily Open forza dello spostamento del prezzo modello di punteggio probabilistico matrice decisionale istituzionale Il risultato è
Filtro:
Nessuna recensione
Rispondi alla recensione