FibRadar
- 지표
- 버전: 1.0
- 활성화: 5
FibRadar v1 방향성 피보나치 레이더 및 일간 거부 신호
FibRadar v1은 가격 움직임과 피보나치 구조를 기반으로 한 방향성 지표로, 시장 방향, 고확률 영역, 그리고 일간 구조와 모멘텀을 고려한 인트라데이 거부 신호를 식별하도록 설계되었습니다.
이 지표는 최근 가격 극값을 자동으로 분석하고 피보나치 레이더 원을 그리며, 엄격한 방향성 필터를 적용하여 거래자가 시장의 주도적 움직임에 맞춰 트레이딩할 수 있도록 도와줍니다.
기본 개념
FibRadar는 사용자가 설정한 분석 기간 내 최고가와 최저가를 기반으로 계산된 동적 가격 중심을 중심으로 구성됩니다.
이 중심을 기준으로 피보나치 비율로 확장된 원형 영역을 생성하여 가격의 확장, 소진, 모멘텀 강도를 시각적으로 보여줍니다.
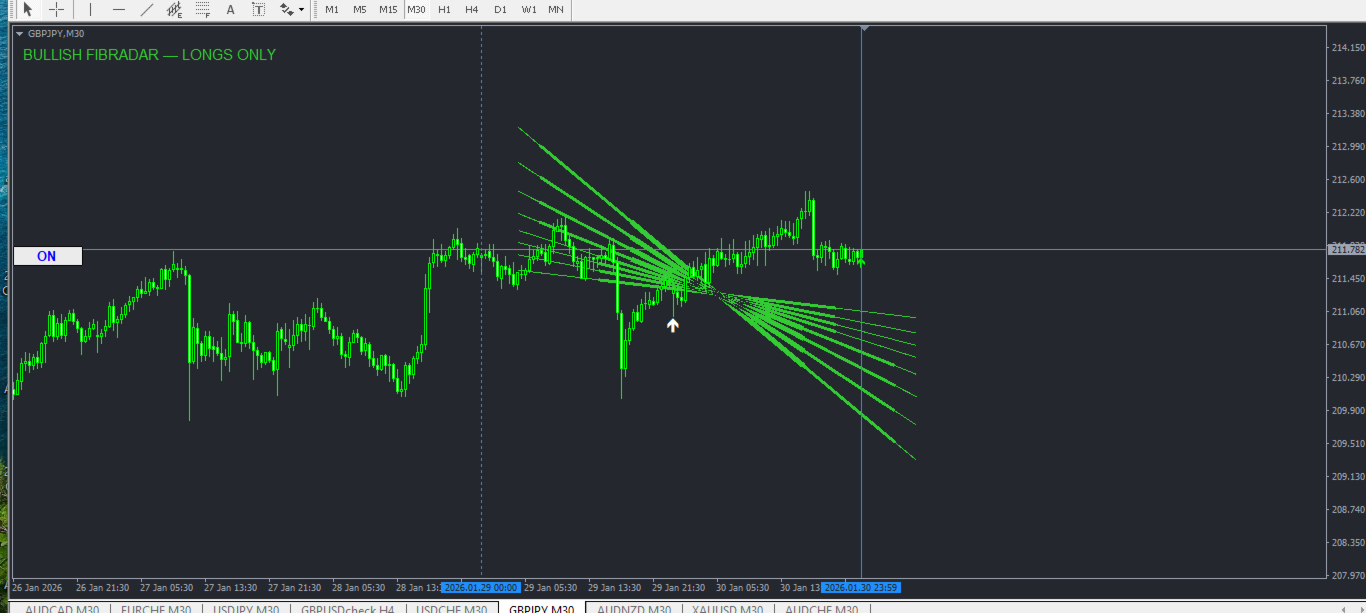
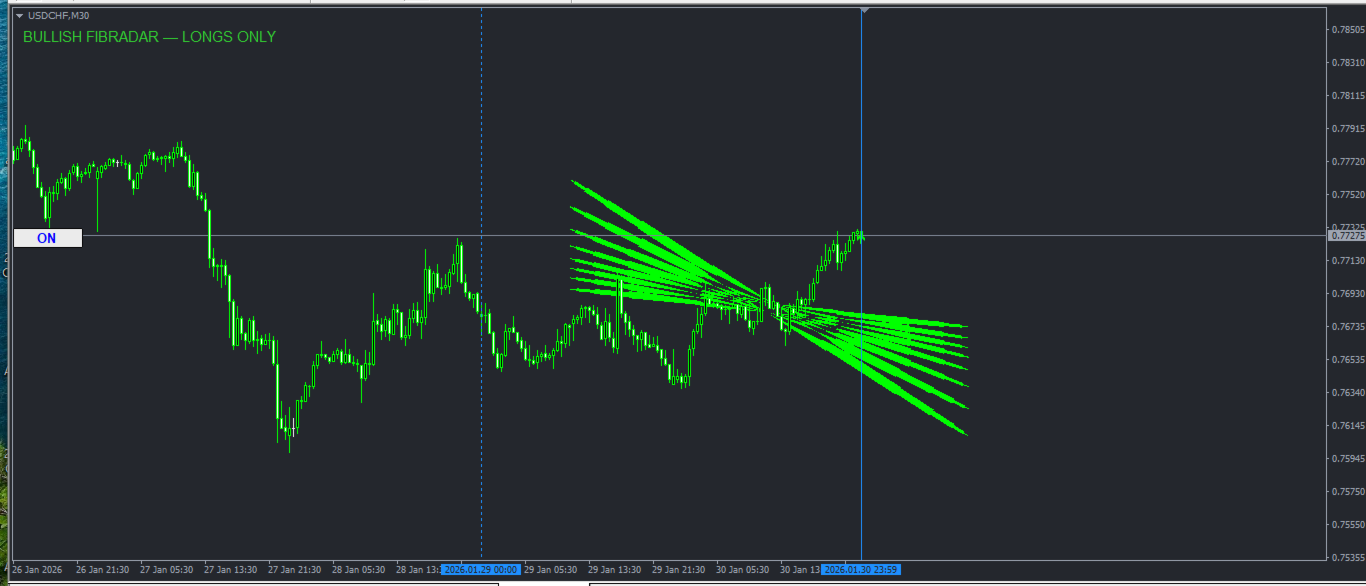
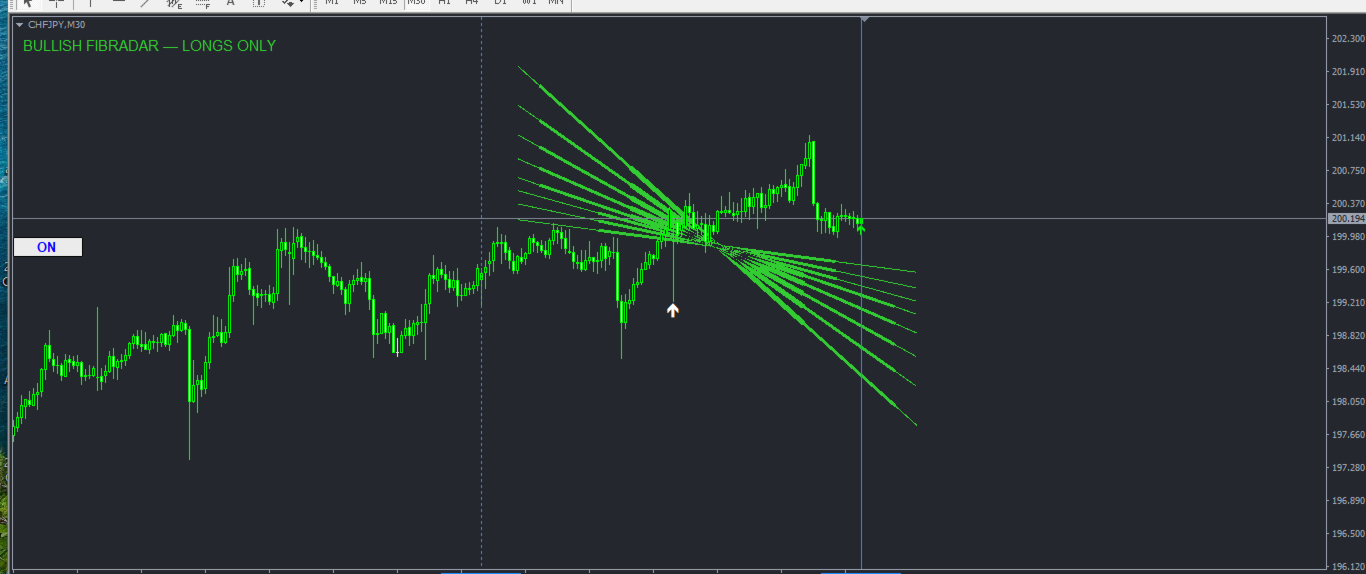
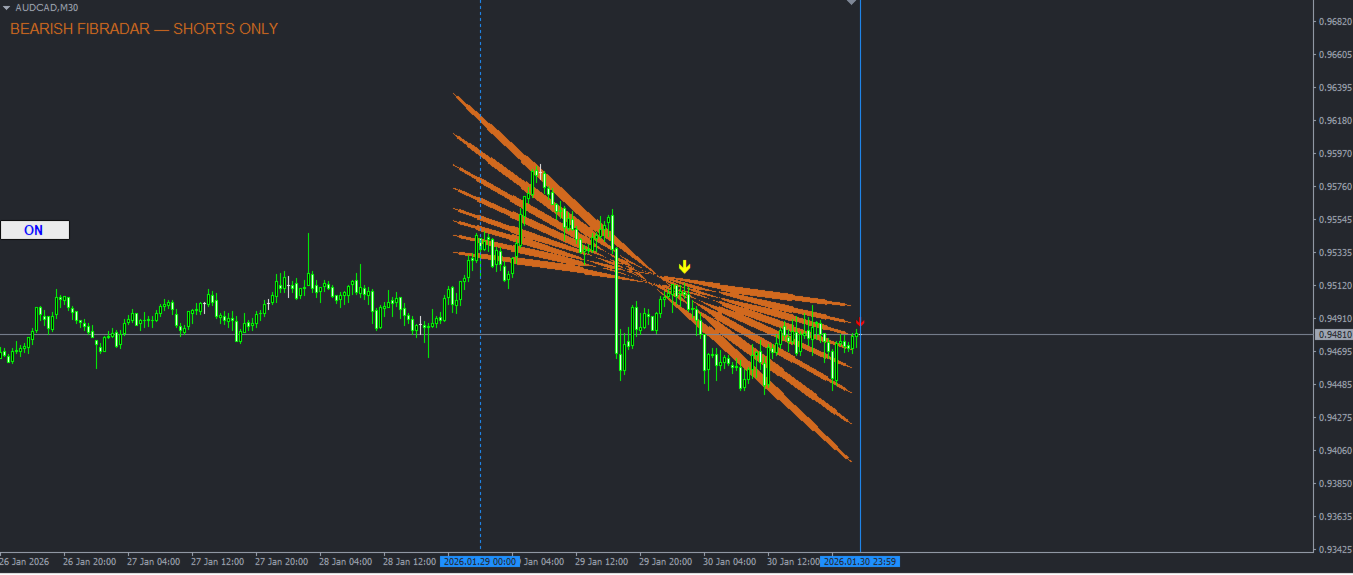
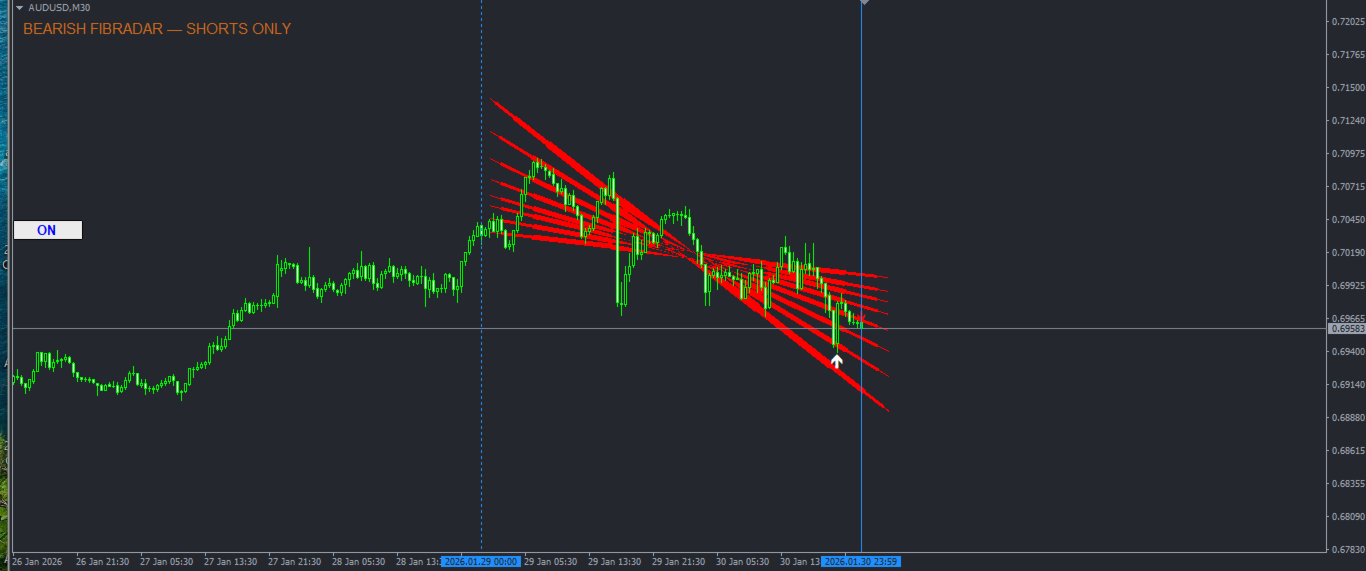
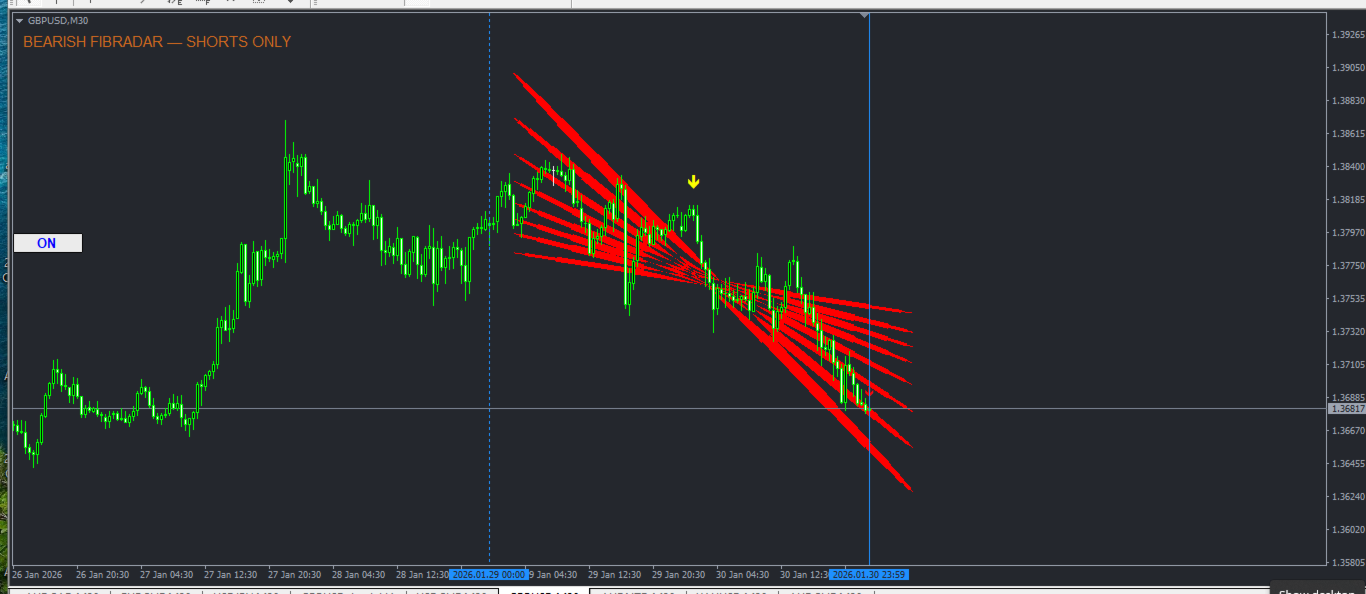
동시에 FibRadar는 시장이 상승추세인지 하락추세인지를 판단하며, 해당 방향에서만 신호를 생성합니다.
피보나치 레이더 원
사용되는 피보나치 비율
0.236 0.382 0.5 0.618 0.786 1.0 1.272 1.618
-
원은 최근 최고가와 최저가 사이에 그려집니다.
-
시장 변동성에 따라 자동으로 크기가 조정됩니다.
-
색상은 시장 방향성에 따라 변합니다.
-
상승 모드에서는 녹색 계열, 하락 모드에서는 빨간색 계열을 사용합니다.
가격이 0.618 비율을 초과하면 강한 방향성 움직임으로 인식되어 모멘텀 경고가 발생합니다.
시장 방향 필터
FibRadar는 시장 구조를 지속적으로 평가하여 현재 방향성을 결정합니다.
-
상승 모드에서는 매수만 허용
-
하락 모드에서는 매도만 허용
현재 모드는 차트에 명확히 표시되어 역방향 거래를 방지합니다.
진입 신호
가격이 FibRadar 중심에 대해 방향을 확인할 때만 신호가 생성됩니다.
-
매수 신호
-
시장 상승 모드
-
종가가 중심 가격 위
-
-
매도 신호
-
시장 하락 모드
-
종가가 중심 가격 아래
-
실시간 알림 기능은 선택적으로 활성화할 수 있습니다.
일간 구조 및 거부 패턴 감지
FibRadar는 일간 가격 구조를 통합하여 분석합니다.
-
수직선은 전일 시작과 당일 종료를 표시합니다.
-
지표는 당일 캔들만 분석하여 거부 패턴을 탐지합니다.
-
일간 고점에서의 하락 거부
-
일간 저점에서의 상승 거부
거부 패턴은 우세한 꼬리길이, 최소 꼬리 길이, 캔들 종가 방향을 기준으로 정의됩니다.
노이즈를 줄이기 위해 하루에 하나의 거부 신호만 생성됩니다.
알림 기능
FibRadar는 진입 신호, 강한 방향성 움직임, 일간 고점/저점 거부 패턴에 대한 알림을 제공합니다.
사운드 알림을 지원합니다.
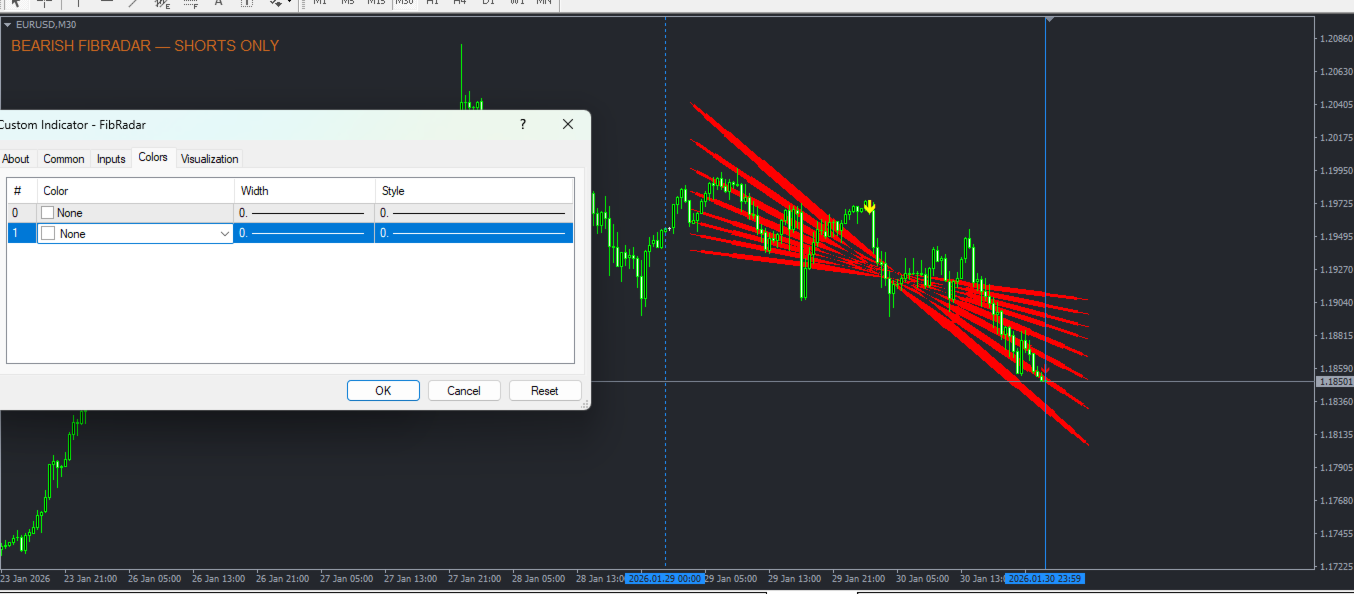
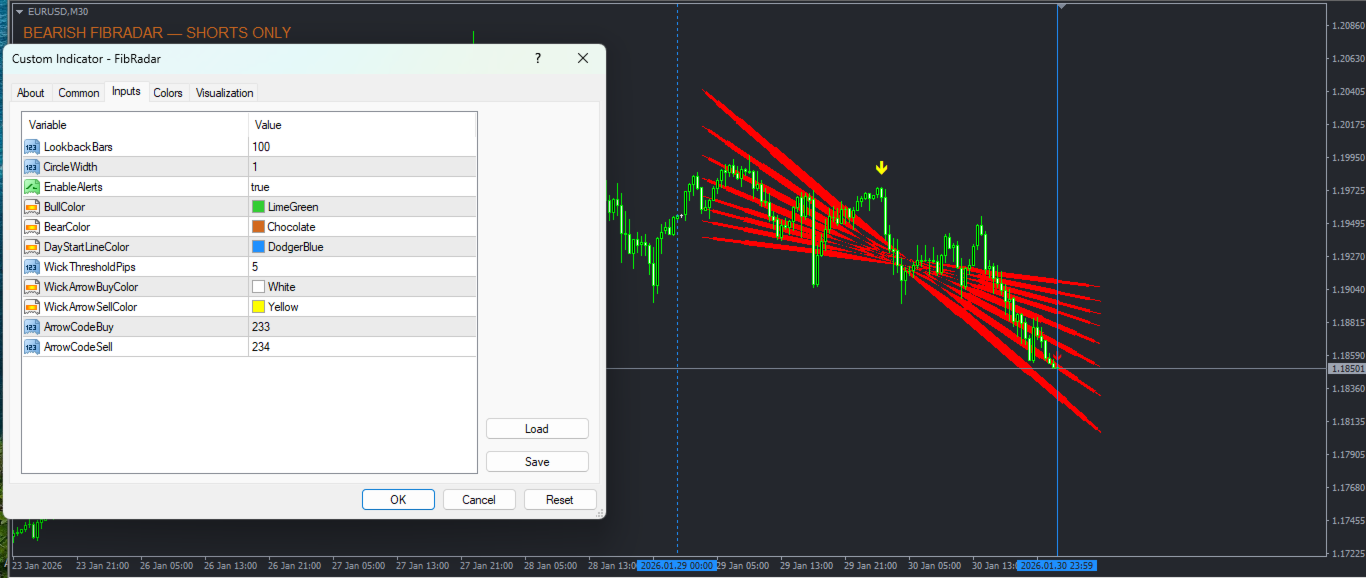
사용자 설정
-
극값 탐지를 위한 분석 기간
-
피보나치 레이더 원의 선 두께
-
상승/하락 모드 색상
-
알림 켜기/끄기
-
거부 패턴 탐지를 위한 최소 꼬리 길이
-
신호 화살표 설정
활용 사례
-
추세 기반 인트라데이 트레이딩
-
피보나치 기반 모멘텀 전략
-
일간 고점/저점 반전 매매
-
스캘핑 및 스윙 트레이딩 확인 도구
중요 안내
FibRadar는 독립적인 트레이딩 시스템이 아닙니다.
시장 구조 분석, 거래 시간, 위험 관리와 함께 사용하기를 권장합니다.