
Trend Zone Force
- Indicators
-
Joas Da Silva Veiga
 Hello, I am from Brazil. I develop my own MT5 tools and indicators independently, based on my needs and my day trading studies. I am new here on MQL5 and I share tools and indicators that I personally use and develop, some free and others paid. If you can help me continue my work by purchasing one
 - Version: 2.11
- Updated: 12 October 2026
- Activations: 20
trend, pullback, trend indicator, volatility, atr, moving average, ema, momentum, oscillator, order flow, delta, trend trading, scalping, day trading, swing trading, price action, market flow
This indicator was developed for trend analysis, pullback identification, and objective market context reading. It combines moving averages and volatility to create dynamic zones and provide a clear interpretation of price direction.
The goal is to help traders operate in alignment with the dominant market trend, reducing low-probability entries and improving decision-making in scalping, day trading, and swing trading strategies.
Main features
-
Trend bias identification based on moving averages
-
Dynamic pullback zones based on volatility
-
Market pressure reading (buying or selling dominance)
-
Filtering of trades in the direction of the prevailing trend
-
Clean, objective, and easy-to-read visual structure
How to use
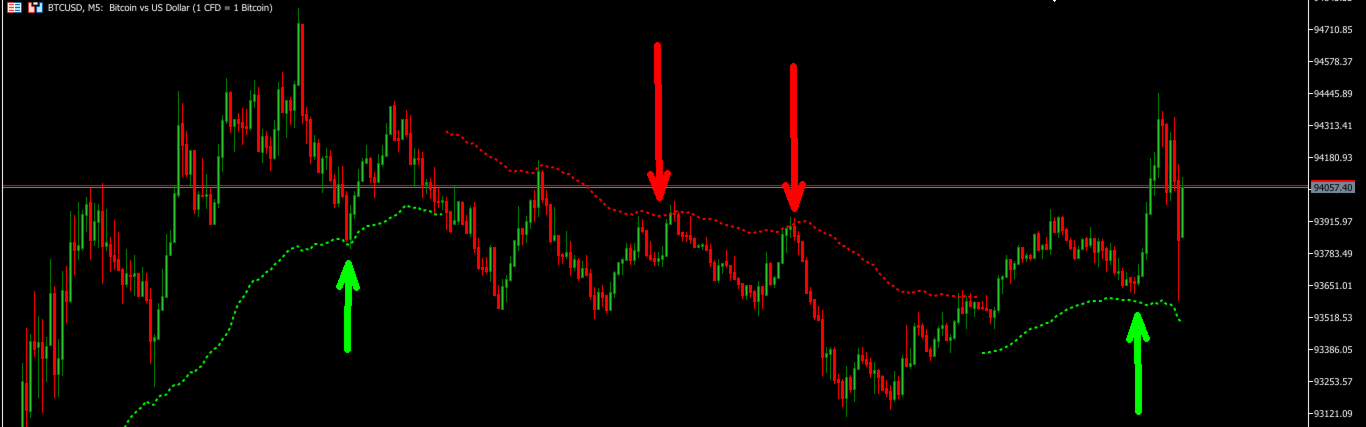
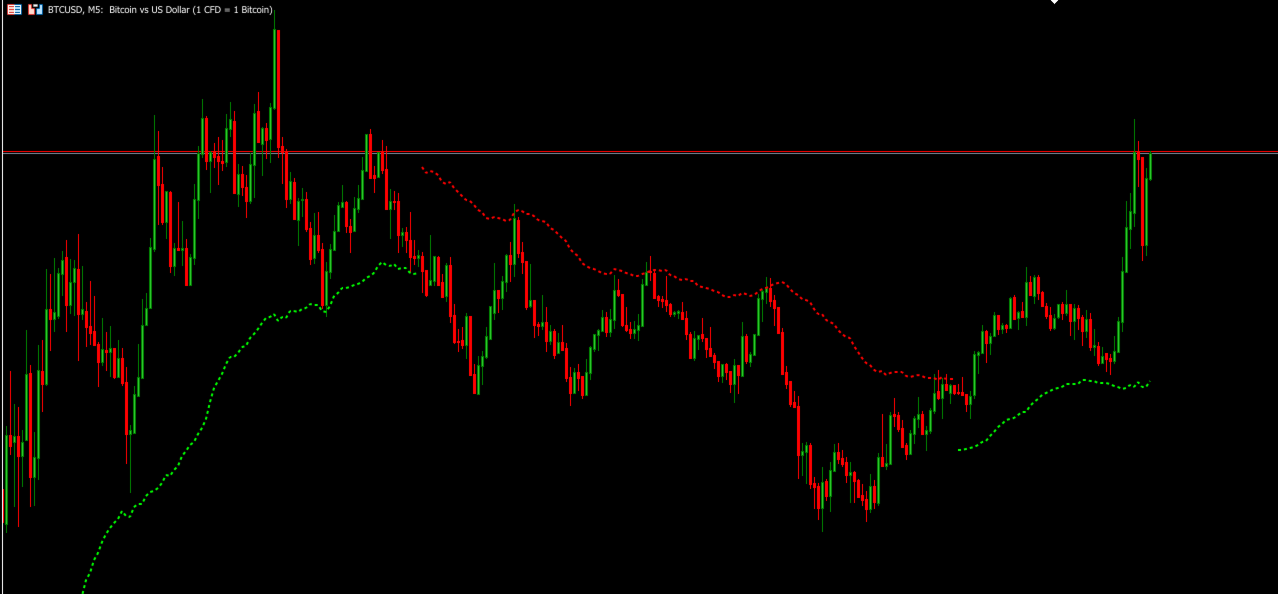
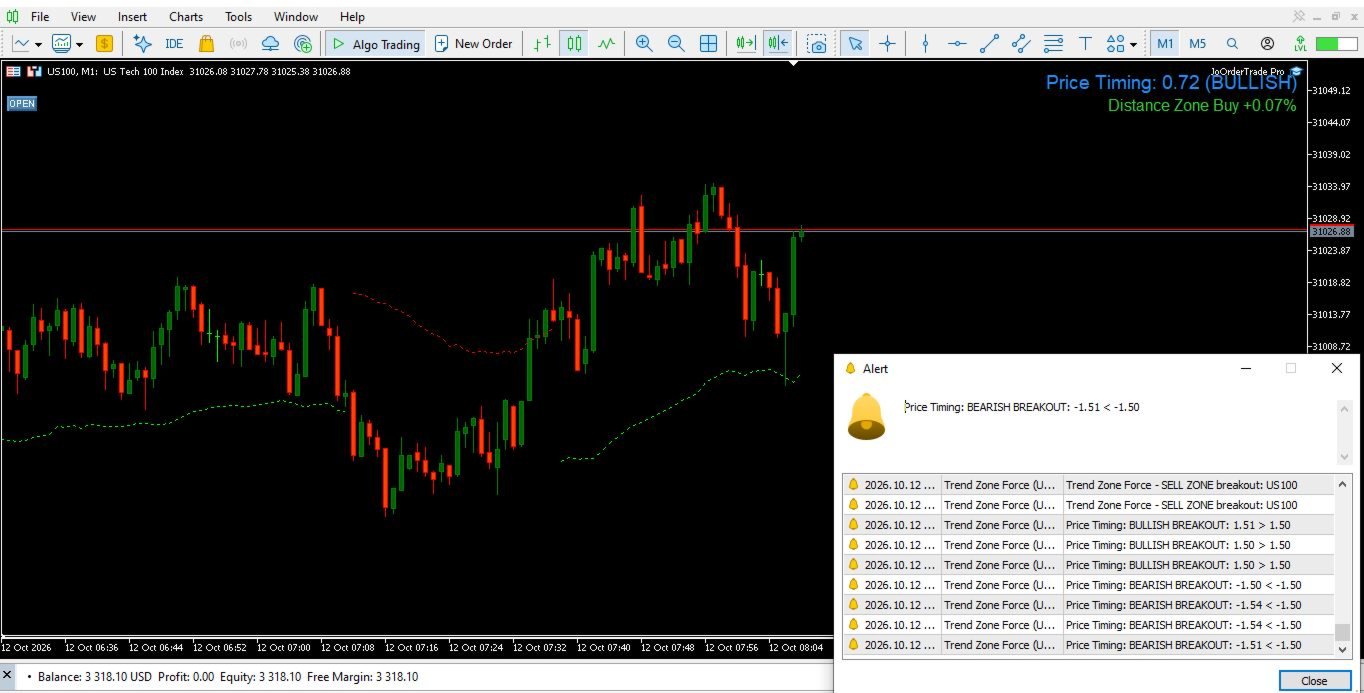
When the price is above the buy zone (green lines), focus on buy trades, especially when the price pulls back near the buy zone, using it as an area of interest for entry.
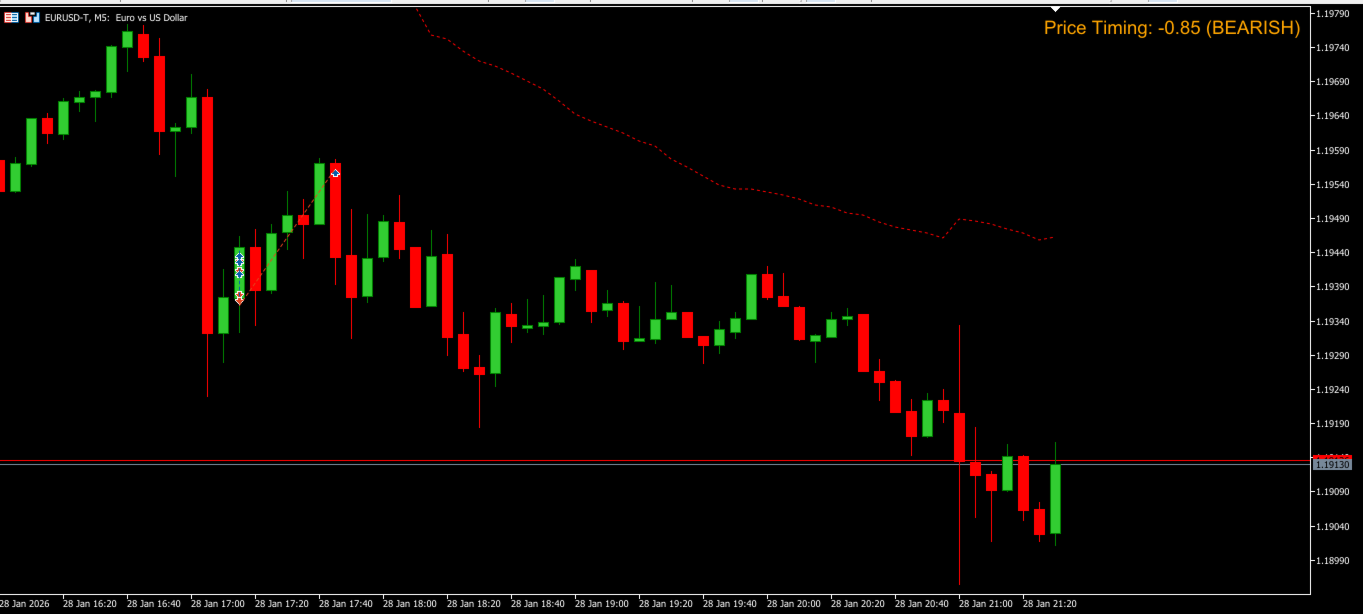
When the price is below the sell zone (red lines), focus on sell trades, especially when the price pulls back near the sell zone, using it as an area of interest for entry.
The zones act as pullback areas within a trend. The ideal approach is to wait for the price to approach the zone and look for confirmation before executing a trade.
In strong trending markets, the price may not return exactly to the zone and may react near it before continuing the movement.
In ranging markets, small false breakouts may occur, where the price temporarily moves beyond the zones and then returns to respect them.
If the price breaks a zone strongly and continues moving, this may indicate a potential trend change. It is important to observe continuation and price acceptance beyond the zone before considering new directions.
If the price starts to hold above a sell zone (red lines), it may indicate a transition to a bullish condition. Likewise, staying below a buy zone (green lines) may indicate continued bearish conditions.
Weak breakouts or lack of continuation may indicate false moves, often representing only a pullback before the main trend resumes.
This allows the zones to be used as a practical reference for entries with better risk and context alignment.
Note
This indicator should be used as a decision-support tool. It is not recommended to use it in isolation. For better results, combine it with price action analysis, market structure, multiple timeframes, and other confirmation tools, always applying proper risk management.
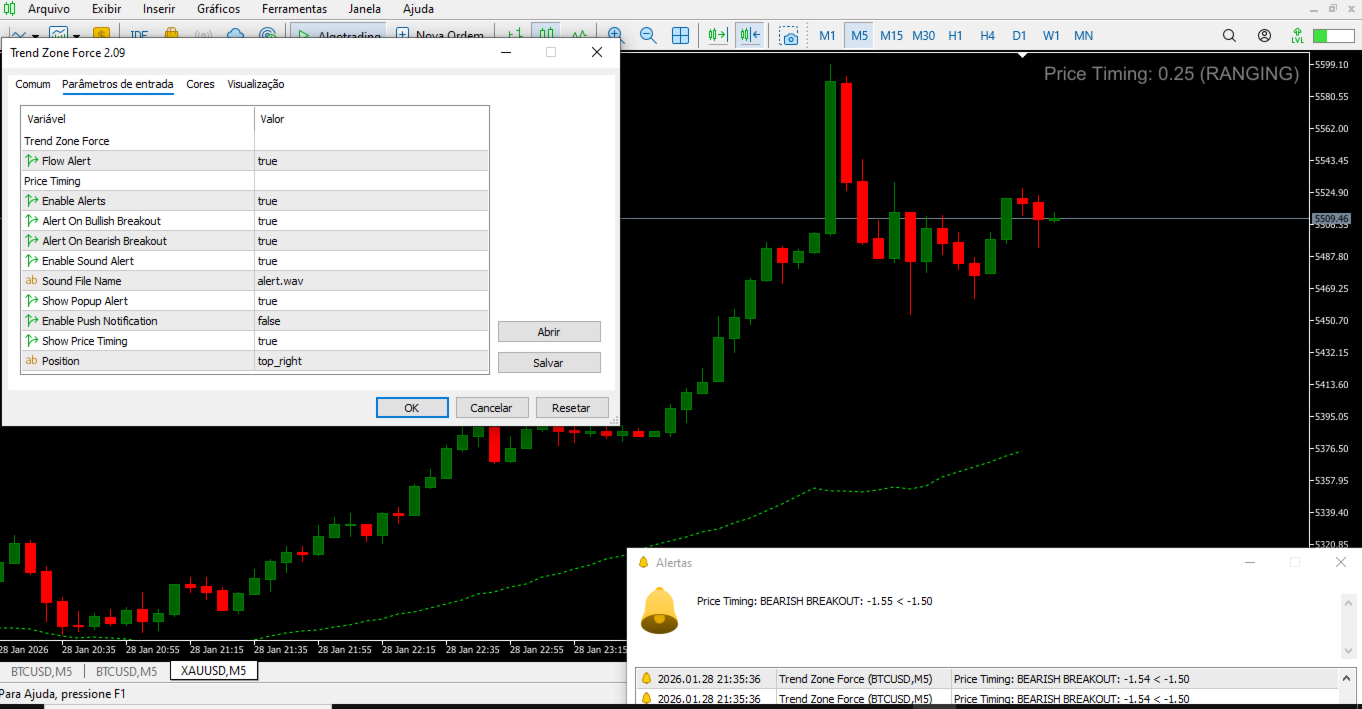
Price Timing
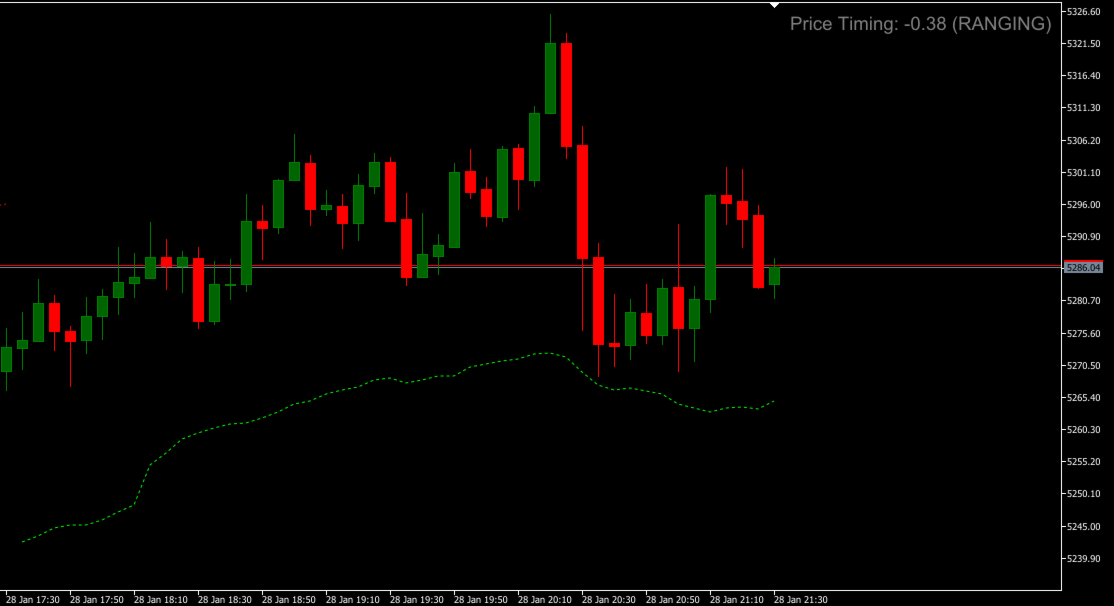
An additional tool based on statistical price behavior, designed to assist with entry and exit timing.
-
Measures price deviation
-
Classifies the market into four states: ranging, bullish, bearish, and breakout
-
Highlights potential extreme movements
-
Displays the current market state clearly
This feature works independently from the pullback zones.
Application
The indicator was initially developed and tested on BTCUSD and can be applied to other assets with parameter adjustments.
Recommended for
-
Scalping, day trading, and swing trading traders
-
Trend and pullback strategies
-
Price action traders
-
Traders seeking objective market reading
Best practices
-
Use multiple timeframe analysis
-
Confirm entries with market structure
-
Look for additional confluence
-
Apply consistent risk management
Limitations
-
Does not generate automatic buy or sell signals
-
Does not predict future movements
-
Does not replace risk management
-
Does not use real volume or order flow
-
May perform less effectively in ranging markets
Risk warning
Trading in financial markets involves high risk and may result in financial losses. Always use stop loss, proper risk management, and test on a demo account before trading on a live account.















































Good indicator. I use to trade pullbacks and to determine reversals/continuation once price approaches the red/green lines.