MasterForce Pattern Panel
- Utilities
-
Joas Da Silva Veiga
 Hello, I am from Brazil. I develop my own MT5 tools and indicators independently, based on my needs and my day trading studies. I am new here on MQL5 and I share tools and indicators that I personally use and develop, some free and others paid. If you can help me continue my work by purchasing one
 - Version: 1.0
- Activations: 20
mt5 indicator, momentum indicator, trend indicator, scalping strategy, buy sell signals, technical analysis, oscillator indicator, support resistance, price action, breakout trading, forex strategy, swing trading, pattern recognition, market momentum, trading signals
What is MasterForce Pattern Panel
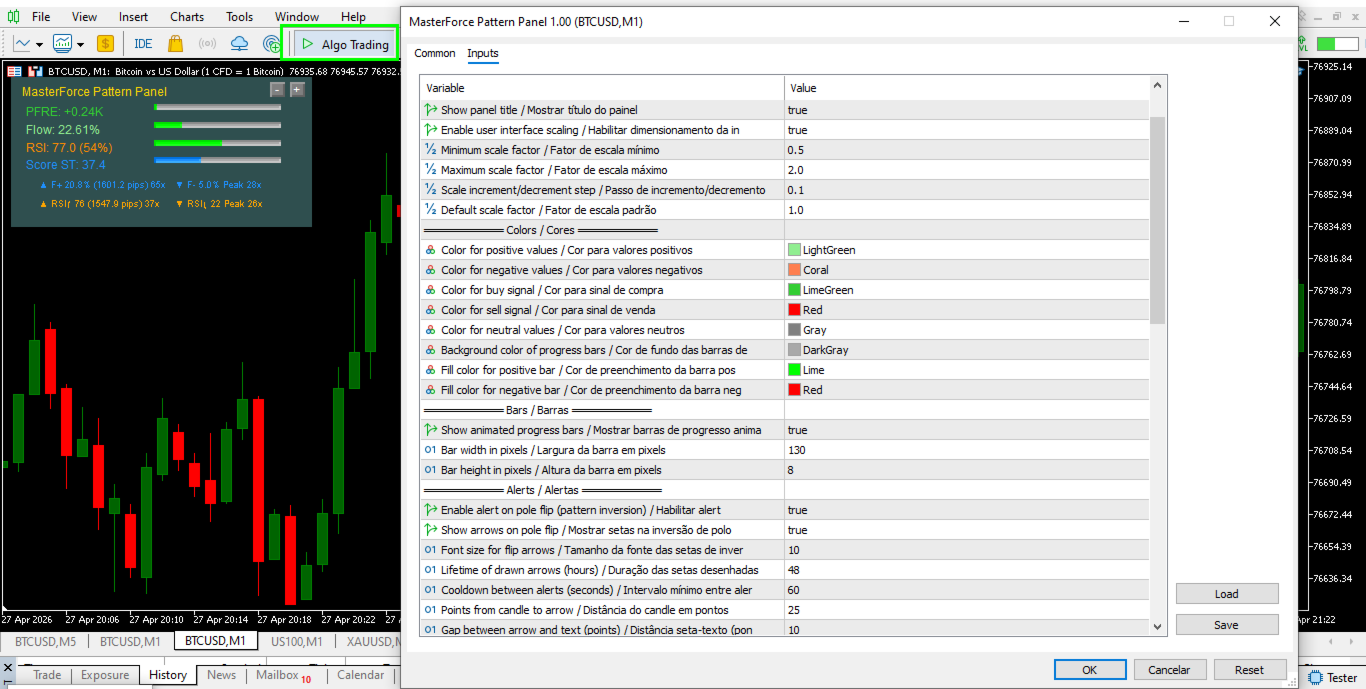
MasterForce Pattern Panel is an advanced tool for MetaTrader 5 that transforms raw market data into actionable buy and sell pattern insights.
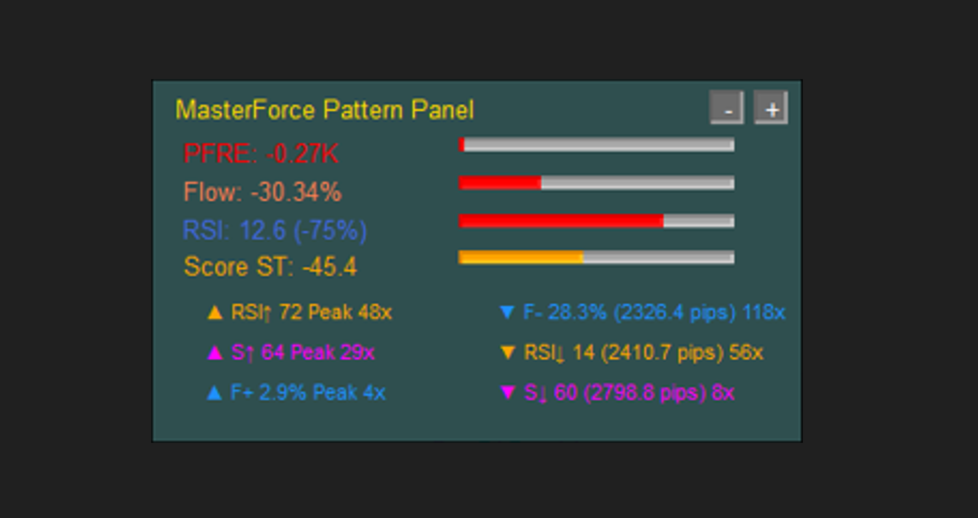
The tool monitors four essential dimensions of price behavior:
PFRE (Power Flow Real Estate) measures the difference between buying and selling pressure tick by tick. Positive values indicate buyer dominance, while negative values indicate seller dominance.
Flow represents the acceleration of market movement, showing whether the trend is gaining or losing strength.
RSI identifies overbought and oversold conditions with high sensitivity to recent price movements.
Unified Score combines the main data and generates a value from -100 to +100, summarizing the current market condition.
The key advantage of this tool is its ability to recognize recurring patterns. Whenever a component reaches a relevant level, a pattern is created (e.g., P+, F-), and the price movement that follows is recorded. Over time, the tool builds statistical data, allowing decisions based on repetition and probability.
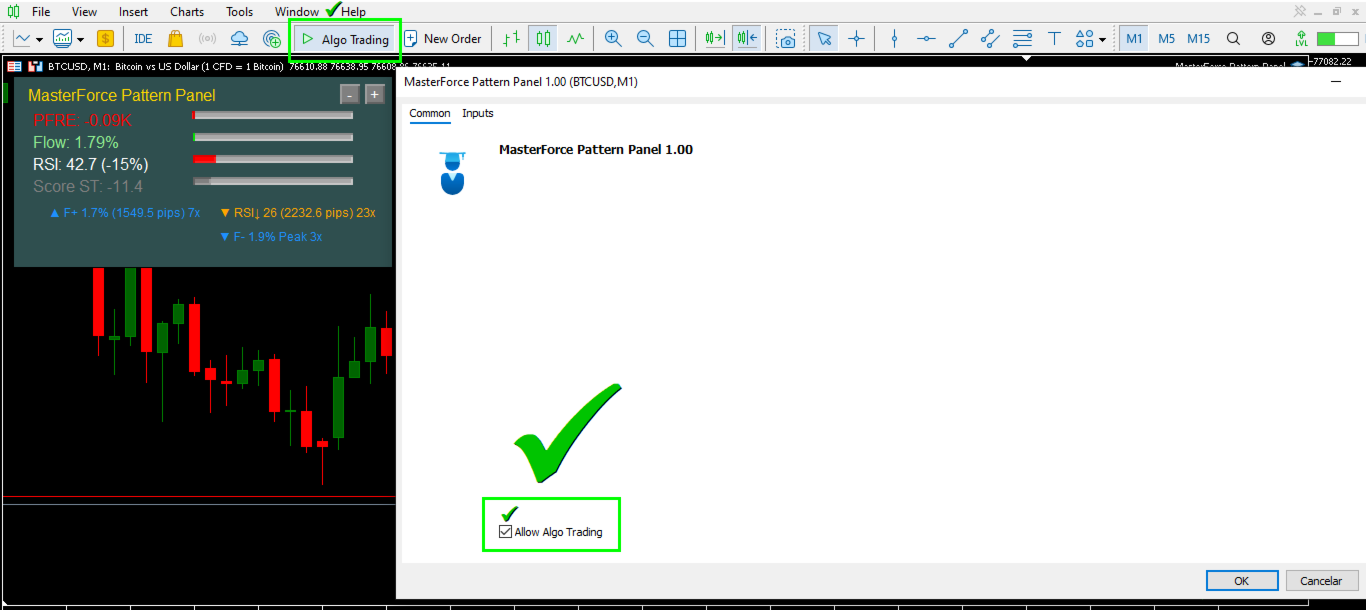
For the tool to work correctly, Algo Trading must be enabled.
Abbreviations and meanings
F = Flow
P = PFRE
S = Score ST
Positive pole signals indicate buying strength.
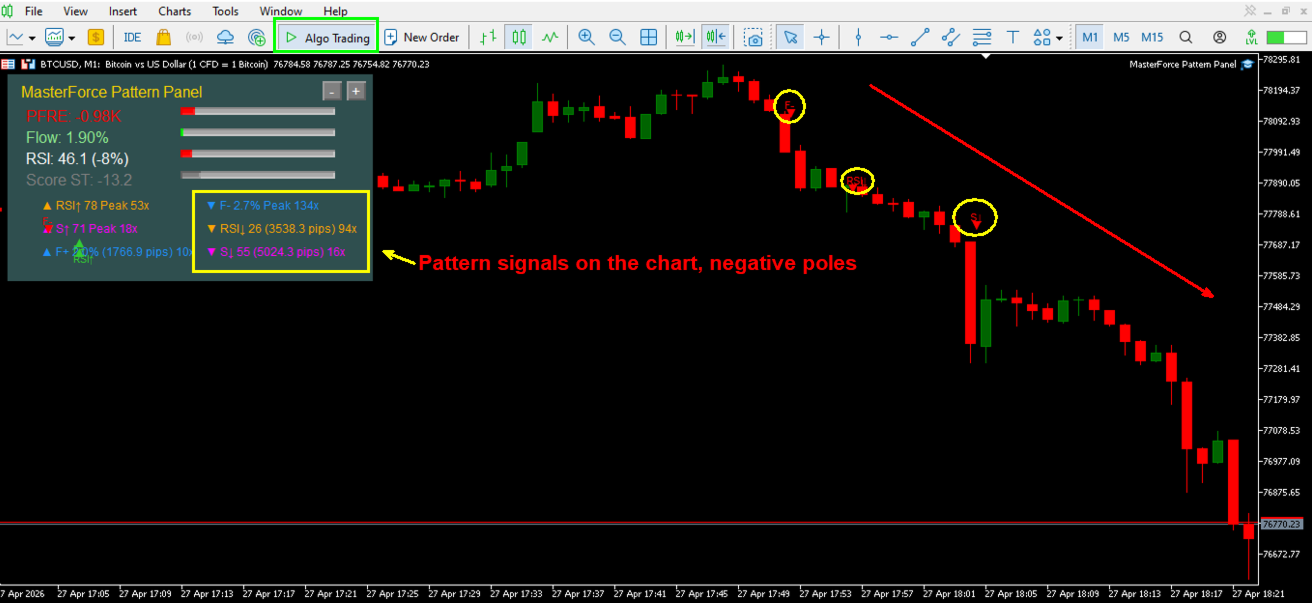
Negative pole signals indicate selling strength.
How the tool displays patterns
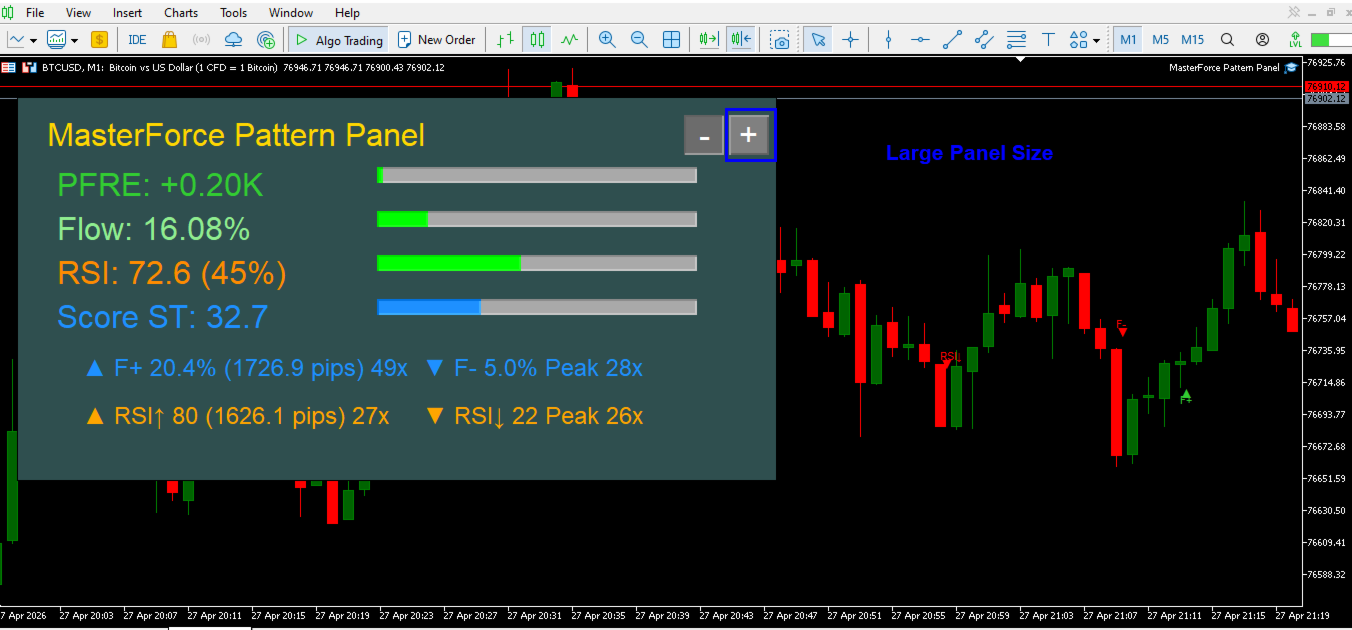
The panel presents information in a clear and structured way:
-
Strength bars for Flow, PFRE, RSI, and Score
-
Positive patterns on the left side
-
Negative patterns on the right side
Each pattern displays direction, movement intensity, average movement in pips, and number of occurrences.
Patterns above 15 occurrences are considered stronger and more stable.
The peak represents the maximum strength that a pole reached before changing direction.
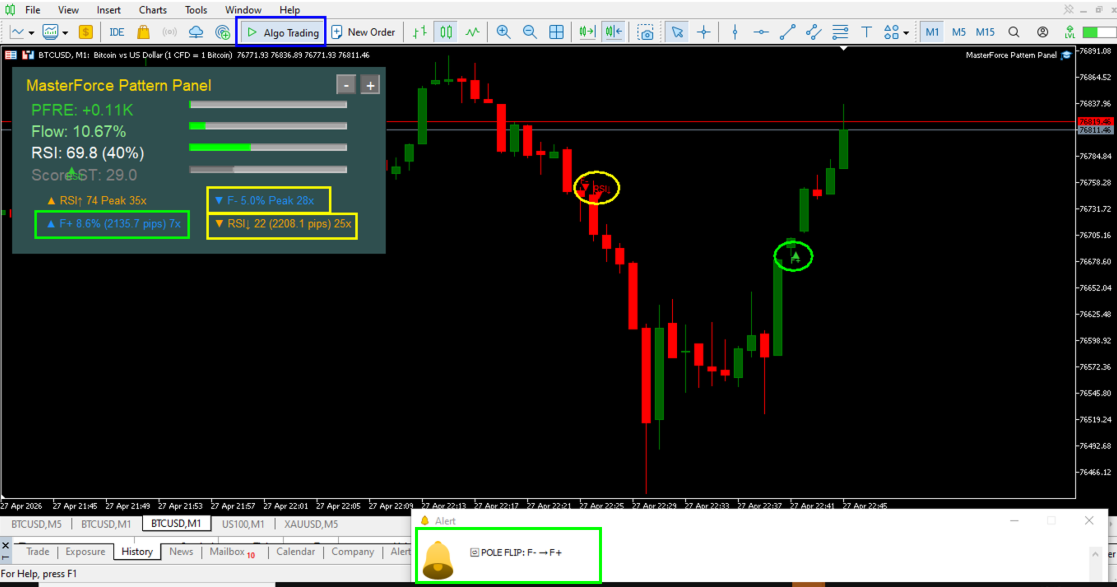
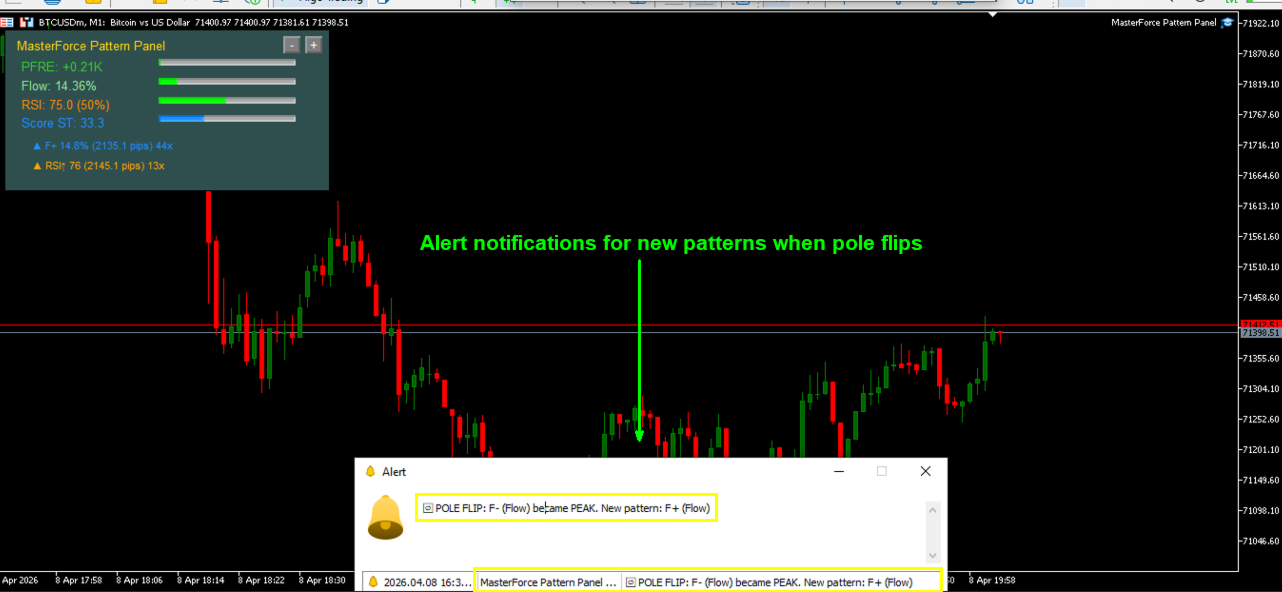
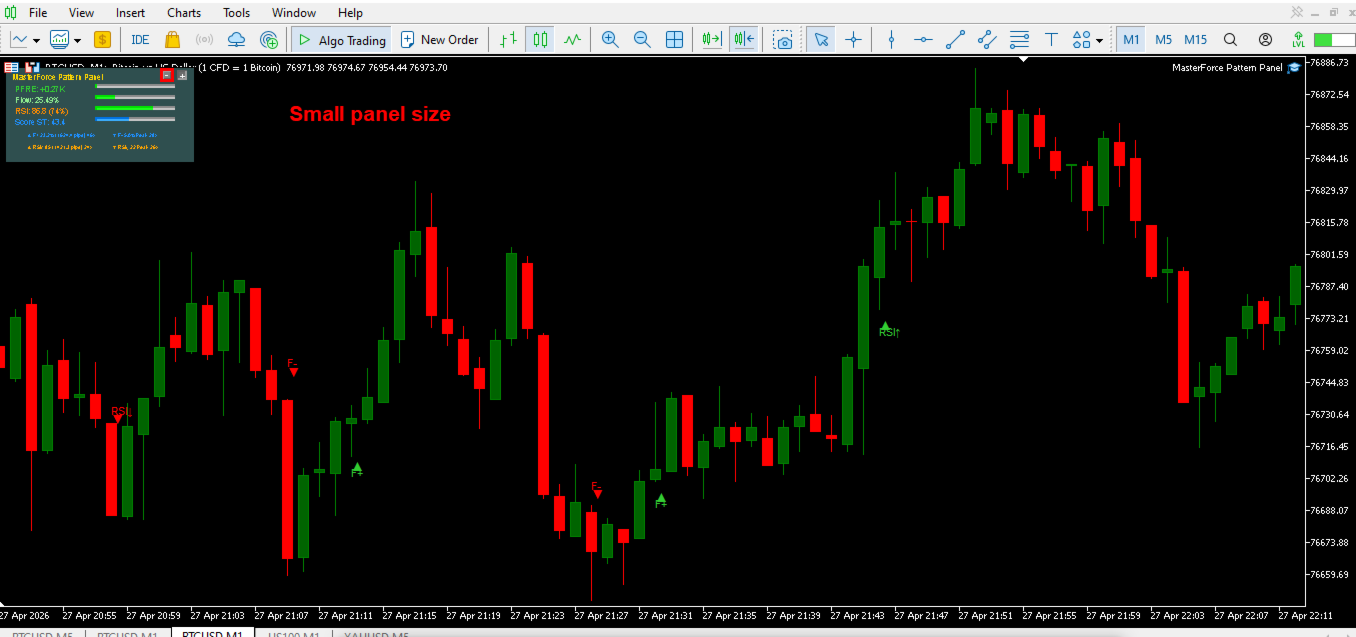
Additionally, the tool displays arrows on the chart whenever a pole changes direction. These arrows indicate potential reversal points or the start of a pullback, helping with real-time decision-making.
How to use the tool
To use the tool correctly, it is essential to analyze the market context and current strength before making decisions.
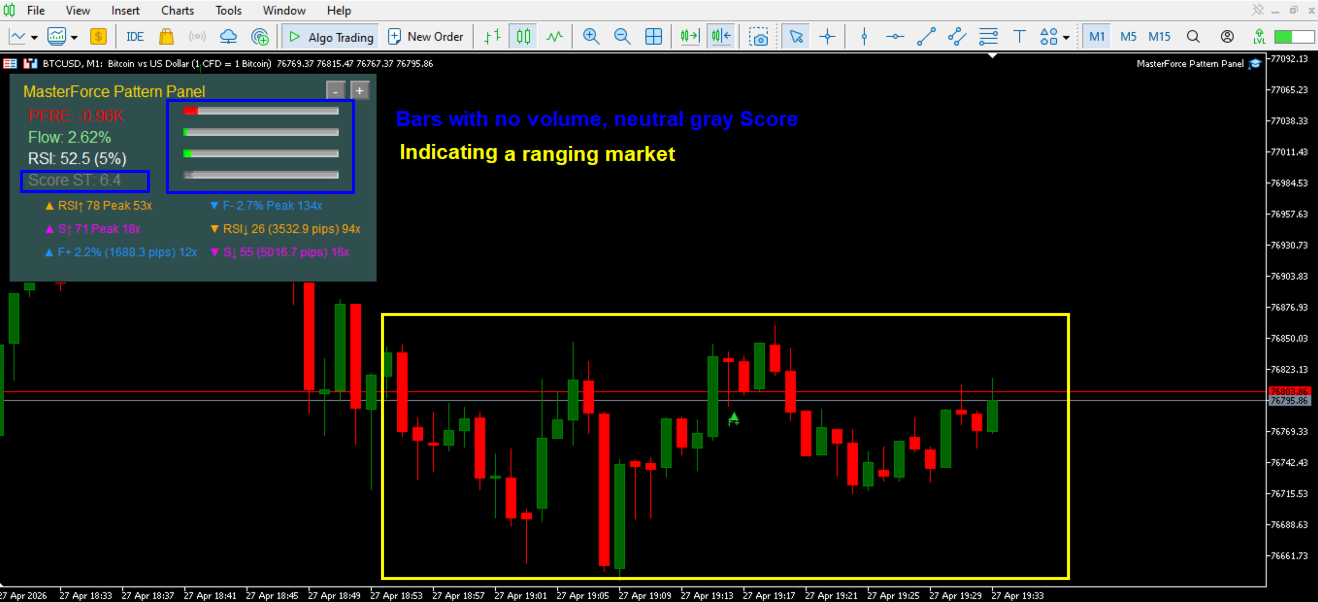
Sideways market
When the Score T is gray, the market is sideways.
In this scenario, trend-based trades tend to be less effective. It is recommended to avoid them or focus only on short movements.
Strength reading
F represents market movement.
P represents buying or selling pressure.
S represents the overall strength summary.
Positive and negative pole signals show which side is dominating the market at that moment.
Pattern interpretation
Patterns with a higher number of occurrences tend to be more reliable.
Patterns above 15 repetitions indicate greater stability.
The peak shows how far the strength moved before reversing, helping define movement limits.
Support and resistance pattern
When a pattern appears at a top or bottom and starts accumulating without breaking that level, it indicates that an opposing force is holding the price.
In this situation, price may perform a pullback, continue the movement, or even reverse direction.
This behavior creates potential support or resistance zones.
It is also important to observe the previous peak values in “X”. If a pattern has been respected multiple times, there is a higher probability it will be respected again.
Trading with the tool
The tool performs best in non-sideways markets.
Before entering a trade:
-
Check that the Score is not in a sideways zone
-
Analyze the current market strength
Practical example:
If a pattern F+ appears and then an F- appears, this may indicate a pullback.
In this case, the trader can use previous top and bottom levels as reference or use a moving average as support.
You can also use the TrendBands Momentum Ultra tool, available for purchase in my MQL5 store, which works very well as support and resistance in this type of analysis.
If price reaches these regions, respects the pattern, increases the number of occurrences, and does not break the previous low, it may be a good opportunity to enter a pullback and follow the trend.
Trend continuation
When conditions remain aligned, with consistent strength, increasing patterns, and no opposite breakouts, the trend tends to continue.
Final considerations
MasterForce Pattern Panel is a tool based on strength reading and repetition of market patterns.
For best results:
Avoid trading in sideways markets.
Prioritize patterns with higher recurrence.
Observe price behavior at key regions.
Always combine with overall market context.
The longer the tool runs, the more data it accumulates, making patterns more reliable over time.
Buy Confirmation
The panel confirms a potential buy when:
-
PFRE: positive (green)
-
Flow %: positive (green)
-
RSI: above 50
-
Score ST: greater than or equal to +40
Abbreviations
-
F+ = Positive Flow
-
P+ = Positive PFRE
-
RSI↑ = RSI rising
-
S↑ = Positive Score ST
Sell Confirmation
The panel confirms a potential sell when:
-
PFRE: negative (red)
-
Flow %: negative (orange)
-
RSI: below 50
-
Score ST: less than or equal to -40
Abbreviations
-
F- = Negative Flow
-
P- = Negative PFRE
-
RSI↓ = RSI falling
-
S↓ = Negative Score ST
To use this indicator correctly, it is important to observe the market context and the current market strength before making any trading decisions.
When the Score ST is gray, it means the market is ranging. In this situation, it is not recommended to use the indicator for trend-following trades, except for short-term trades.
Understanding the PatternsNormally, the abbreviations appear together, indicating the dominant market strength.
When two patterns appear on the same side, this may already indicate the current market trend.
Examples:
-
F+ and RSI↑ = two patterns pointing to buying pressure.
-
F- and RSI↓ = two patterns pointing to selling pressure.
The more abbreviations pointing in the same direction, the stronger the trend tends to be.
Example
Suppose the panel is showing:
-
F+
-
RSI↑
-
S↑
All abbreviations are on the positive side, indicating buying strength.
If only:
-
F-
-
RSI↓
change to the negative side, while:
-
S↑
remains positive, the main trend is still considered bullish.
In this case, the change in F and RSI may represent only a pullback.
However, when two or more abbreviations change sides at the same time, the pullback may be stronger.
As long as the last abbreviation remains on the original side, the primary trend may still be intact.
Meaning of the Abbreviations-
F = Flow
-
P = PFRE
-
S = Score ST
The positive (+) and negative (-) signals represent:
-
Buying pressure.
-
Selling pressure.
Patterns above 15x usually represent stronger and more stable movements.
The Peak field shows the maximum value reached by that side before changing to the opposite side.
Support and ResistanceWhen a pattern appears near a market bottom or top, it may continue accumulating strength without being able to break that price level.
This may indicate that an opposing force is holding the market at that area.
In these situations, the price may:
-
Make a pullback and continue the main trend.
-
Completely reverse its direction.
These areas can become temporary support or resistance levels.
It is also important to observe the X values recorded by previous peaks. If a specific level has been respected multiple times in the past, there is a possibility that the market may respect that level again.
Trading with the IndicatorThe indicator performs best in trending markets.
Before entering a trade:
-
Check that the Score ST is not gray.
-
Identify the dominant market strength.
-
Observe which patterns are currently active.
Trading Pullbacks
If the main trend is showing:
-
F+
and then:
-
F-
appears, this may indicate a pullback.
To identify possible retracement areas, you can use:
-
Moving averages.
-
Previous highs and lows.
-
The TrendBands Momentum Ultra indicator (available in my store).
When the price reaches one of these areas and the pattern continues increasing its X count without breaking the previous high or low, this may indicate a good opportunity to enter in the direction of the main trend.
Entry MethodWhen the panel is clean, with no active patterns, I usually wait for at least two patterns pointing in the same direction.
Sell Example
-
The first pattern appears:
-
F-
-
-
Shortly after, the following pattern appears:
-
RSI↓
-
In this case, I consider entering a sell trade when the second pattern appears.
Even so, I try to avoid selling directly into a bottom. For this reason, I use the strength shown by the Quantum Pulse Force indicator (available in my store) to confirm whether there is still room for the bearish move to continue.
Risk warning
Financial markets involve risk. No tool guarantees results. It is recommended to test on a demo account before trading with real money.