
QuantumTrade Panel
- Indicators
-
Joas Da Silva Veiga
 Hello, I am from Brazil. I develop my own MT5 tools and indicators independently, based on my needs and my day trading studies. I am new here on MQL5 and I share tools and indicators that I personally use and develop, some free and others paid. If you can help me continue my work by purchasing one
 - Version: 1.3
- Updated: 27 April 2026
The panel is an advanced market-reading tool that transforms price and volume data into clear signals of trend, buying/selling pressure, and objective trade projections — all centralized in a single panel directly on the chart.
It combines dynamic market behavior analysis with risk management and automatic trade projection, displaying real-time metrics such as Gamma Zero, Volumes, Trend, Delta Risk, and Accumulated Risk.
In addition, the indicator maintains intelligent data persistence, automatically saving critical information such as buy/sell peaks and accumulated risk, ensuring continuity even after changing timeframes or restarting the terminal.
With configurable alerts (sound, push, and email) and automatic adaptation to different asset types, the panel provides a consolidated and practical view for decision-making.
Why use it?
This panel allows you to quickly identify who is dominating the market (buyers or sellers), define objective entry, stop, and target levels without manual calculations, and reduce chart noise through a clean and organized display.
It also automates trend and market pressure analysis, maintains data continuity even after terminal restarts, and centralizes all relevant information in one place.
What does the panel display?
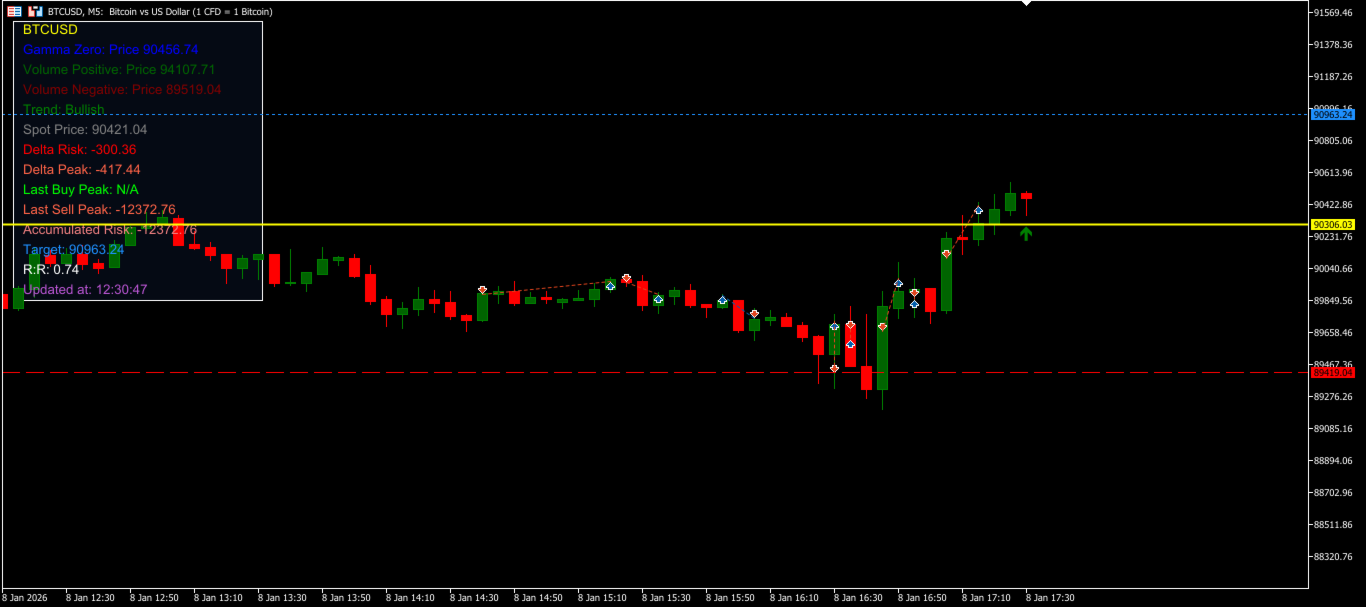
The panel is fixed in the upper-left corner of the chart and presents real-time information organized into two main groups.
Core market data:
Asset: analyzed symbol
Gamma Zero: equilibrium level based on price and volume
Positive Volume: region of strongest buying pressure
Negative Volume: region of strongest selling pressure
Trend: current market direction (Bullish or Bearish)
Spot Price: current price
Pressure and risk metrics:
Delta Risk: dominance indicator showing whether buyers or sellers are in control
Delta Peak: highest recent intensity of market pressure
Last Buy/Sell Peak: extreme accumulated strength levels
Accumulated Risk: continuous evolution of dominant pressure
Target: projected take profit level
R:R: risk/reward ratio of the suggested trade
Last Update: time of the last update
Trade projection and chart lines
Based on the current trend and volatility (ATR), the indicator automatically calculates three operational levels.
Entry: adjusted level to optimize the entry point
Stop Loss: positioned proportionally to market volatility
Take Profit: defined based on projected movement and risk/reward
The corresponding horizontal lines are drawn directly on the chart, representing entry (yellow), stop loss (red dashed), and take profit (blue dotted).
An arrow visually indicates the suggested trade direction, either buy or sell. All lines can be individually shown or hidden in the settings.
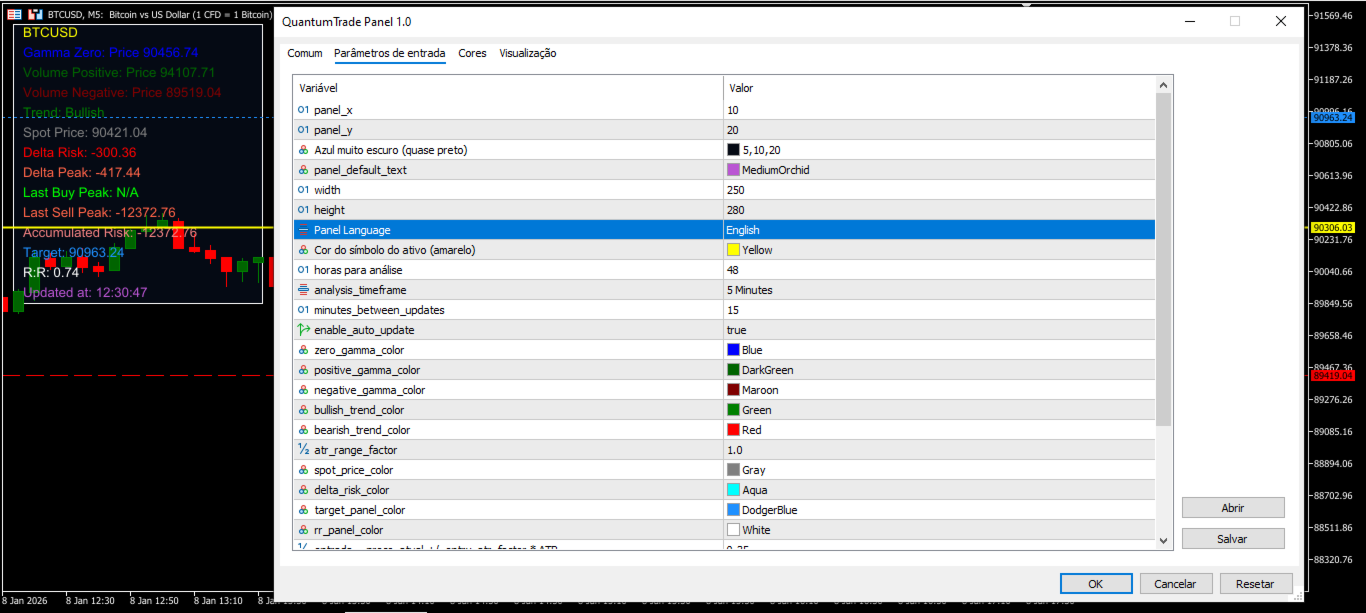
Configurable parameters
Panel position and appearance
X Position / Y Position: defines the panel position on the chart
Panel background color: defines the background color
Default text color: defines the default text color
Panel width / height: defines the panel dimensions
Language
Panel language: allows selection between English, Portuguese, or Spanish
Analysis parameters
Analyzed hours: defines the historical period analyzed
Analysis timeframe: defines the timeframe used in calculations
Update interval (minutes): defines time between updates
Auto update enabled: enables or disables automatic updates
Analysis symbol: defines the analyzed asset ("auto" uses the current chart)
Delta peak calculation period (hours): defines the window used to detect Delta Risk peaks
Element colors
Symbol color: defines the asset color
Gamma Zero color: defines Gamma Zero color
Positive Volume color: defines buying pressure color
Negative Volume color: defines selling pressure color
Bullish trend color / Bearish trend color: defines trend colors
Spot price color: defines current price color
Delta Risk color: defines Delta Risk color (can dynamically change between green and red)
Target color: defines take profit color
R:R color: defines risk/reward color
Trade projection
ATR factor for entry: defines entry adjustment based on ATR
ATR factor for stop loss: defines stop distance
ATR factor for take profit: defines target distance
Safety margin (points): defines an additional margin to avoid tight stops
Alerts
Enable sound alerts: enables sound notifications
Enable push notifications: enables mobile notifications
Enable email alerts: enables email notifications
Buy signal sound: defines the sound for buy signals
Sell signal sound: defines the sound for sell signals
Minimum alert interval (seconds): defines minimum time between alerts
Chart visibility
Show all lines: enables display of all lines
Show entry line: controls entry line visibility
Show stop loss line: controls stop line visibility
Show take profit line: controls target line visibility
Show trade direction arrow: controls direction arrow visibility
Automatic asset adjustment
Enable automatic asset adjustment: automatically adapts the indicator behavior according to the asset type and price digits
Alert behavior
Whenever a new buy or sell signal is generated, the indicator checks the configured minimum interval between alerts and, when allowed, sends the notification based on selected options.
After an alert is triggered, new signals of the same type are temporarily limited, avoiding excessive notifications and keeping only relevant events.
State persistence
The panel automatically stores important data such as Accumulated Risk and market peaks using terminal Global Variables.
This ensures that information is not lost when switching timeframes or restarting the indicator.
Data can be manually cleared through the Global Variables window (F3 in MT5) by removing entries with the corresponding indicator prefix.
















































very good indicator, good support as well