Quantum Pulse Force
- Indicators
-
Joas Da Silva Veiga
 Hello, I am from Brazil. I develop my own MT5 tools and indicators independently, based on my needs and my day trading studies. I am new here on MQL5 and I share tools and indicators that I personally use and develop, some free and others paid. If you can help me continue my work by purchasing one
 - Version: 1.7
- Updated: 27 June 2026
- Activations: 20
trend indicator, market flow, momentum indicator, price action, forex indicator, buy sell signals, reversal indicator, volatility indicator, trading signals, MT5 indicator, technical analysis, scalping indicator, smart money, market strength, algorithmic trading
Quantum Pulse Force is a technical indicator for MetaTrader 5 designed to analyze price movement acceleration, identify phases of trend and sideways movement, and highlight relevant market points based on multiple quantitative filters.
Unlike traditional indicators that show direction only, its main focus is to measure the strength and evolution of the movement, allowing a more precise reading of market behavior in real time.
Flow Percentage
The core of the indicator is the percentage change in the difference between two moving averages.
This calculation shows whether the distance between the averages is increasing or decreasing, indicating acceleration or deceleration of the movement.
Interpretation:
-
Positive values indicate acceleration to the upside
-
Negative values indicate acceleration to the downside
-
Values near zero indicate loss of strength or a sideways market
This reading allows changes to be anticipated before they become visible through price alone.
Candle Coloring
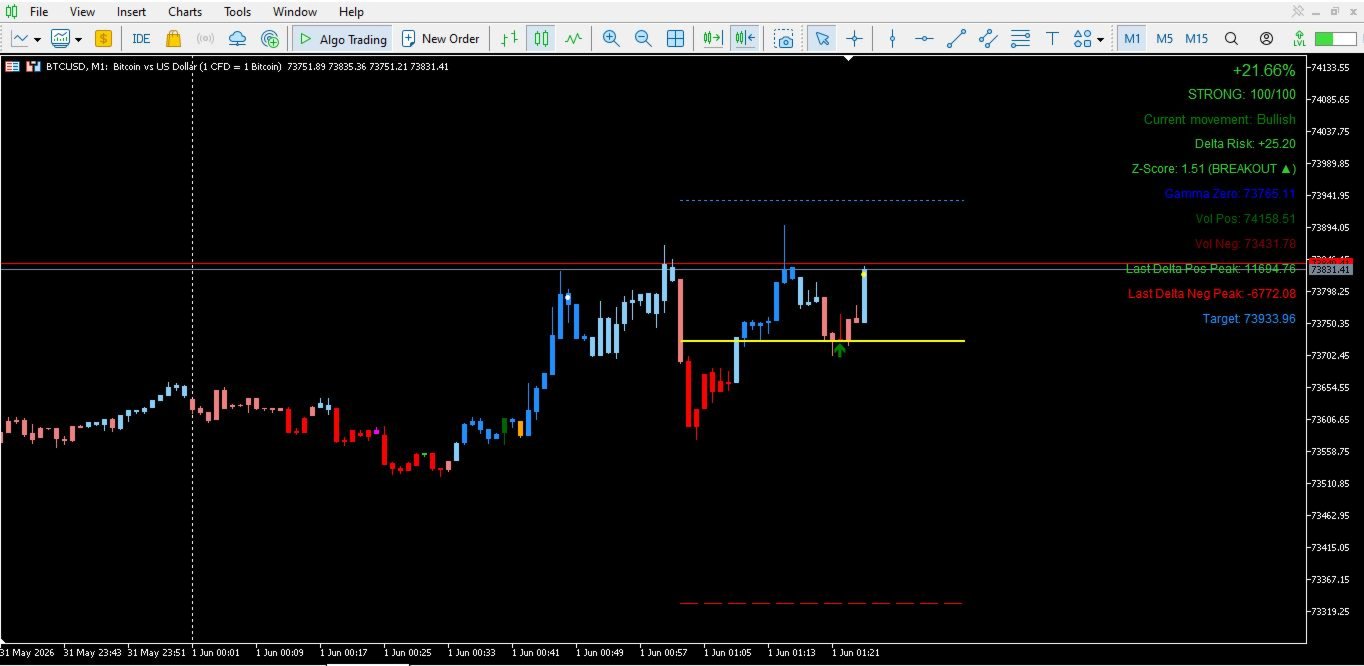
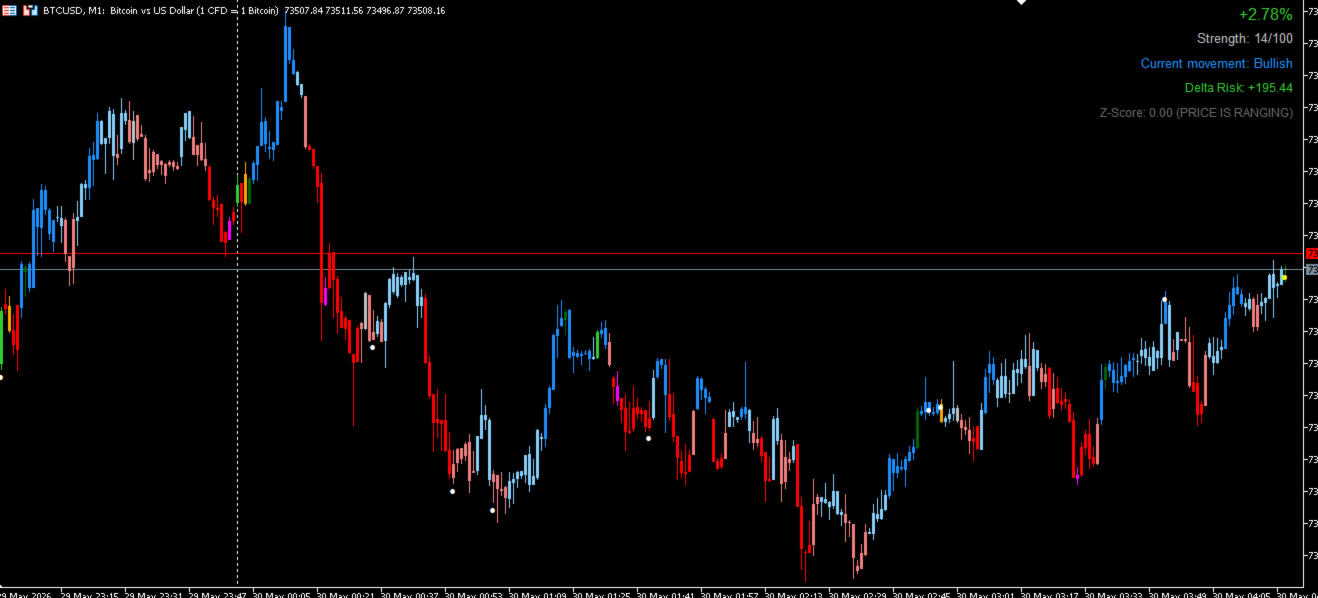
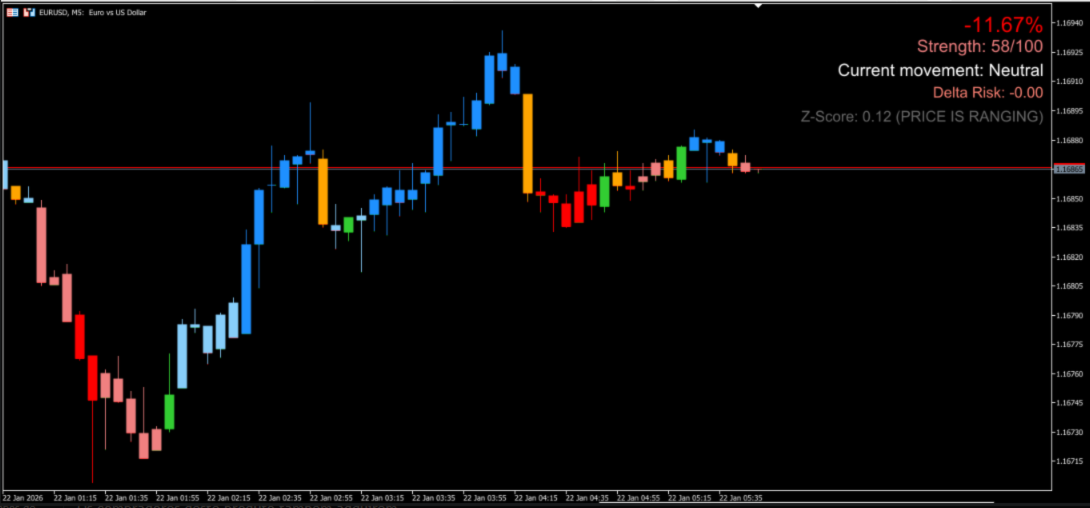
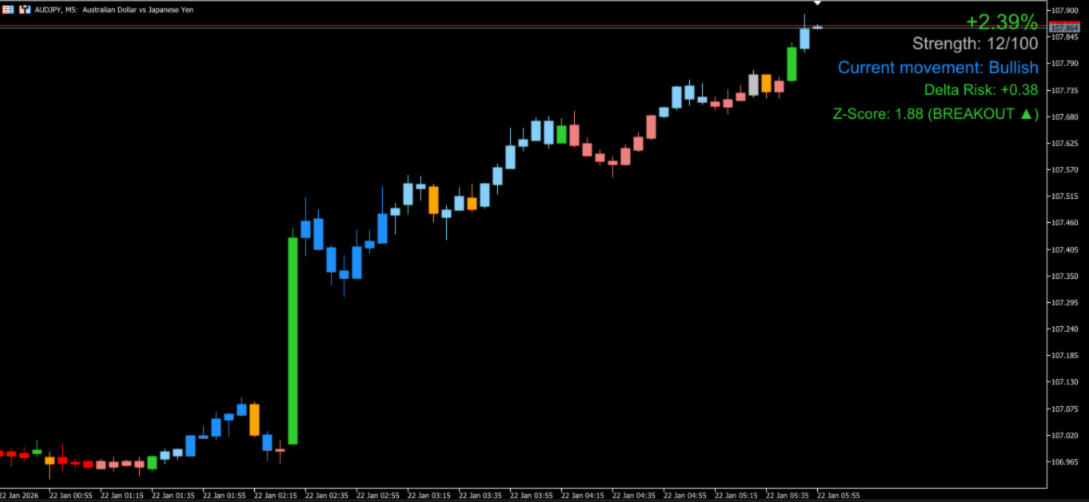
The indicator automatically changes candle colors to reflect the current market state.
The colors represent:
-
Strong blue: strong upward movement
-
Strong red: strong downward movement
-
Light blue: weak upward movement
-
Light red: weak downward movement
-
Green: possible reversal to the upside
-
Orange: possible reversal to the downside
-
Dark green: possible buying flow reversal in the movement.
-
Pink: possible selling flow reversal in the movement.
The coloring is based on the combination of percentage flow, movement strength, and statistical context.
Z-Score System and Range Detection
The indicator uses the Z-Score to identify when the market is in a consolidation phase.
The Z-Score measures how far price is from the mean in terms of standard deviation.
How it works:
-
When price remains close to the mean for a period, the market is classified as sideways
-
During this period, the indicator highlights the range channel visually
-
The candles behave neutrally to indicate low trend probability
In addition, upper and lower channel limit lines are drawn.
Breakouts are identified when price leaves this range with strength.
Convergence Signals
The indicator generates buy and sell signals when multiple conditions are met at the same time.
Main conditions:
-
Flow direction (positive or negative)
-
Minimum movement strength
-
Z-Score confirmation
These signals appear as arrows on the chart and are designed to reduce weak or false entries.
Optionally, signals can be filtered during sideways periods.
Market Strength (Strength Score)
The indicator calculates a real-time score for movement strength.
This score considers:
-
Intensity of percentage flow
-
Movement momentum
-
Market context (range or breakout)
Strength varies on a scale from 0 to 100 and can be displayed as a line on the chart.
Interpretation:
-
High values indicate strong and consistent movements
-
Low values indicate weakness or indecision
Reversal Detection
The indicator includes a dedicated system to identify possible changes in direction.
A reversal is detected when:
-
The direction of movement changes
-
There is sufficient minimum strength
-
Additional conditions are met
Additional filters may include:
-
Minimum number of opposite candles
-
Volume confirmation
-
Minimum difference between the averages
When a reversal is identified, the candle receives a specific color and may trigger an alert.
Quantum Trend
Quantum Trend analyzes recent market behavior based on candle bodies.
It calculates the sum of the movements of the latest bars and classifies the trend as:
-
Strong bullish
-
Bullish
-
Neutral
-
Bearish
-
Strong bearish
This component works as an additional filter to confirm the dominant direction.
Delta Risk
Delta Risk measures the balance between buyers and sellers.
It is calculated based on:
-
Position of the close within the bar
-
Movement amplitude
-
Tick volume
Interpretation:
-
Positive values indicate buying dominance
-
Negative values indicate selling dominance
-
Values near zero indicate balance
It may also indicate loss of strength or a shift in control between market participants.
Alert System
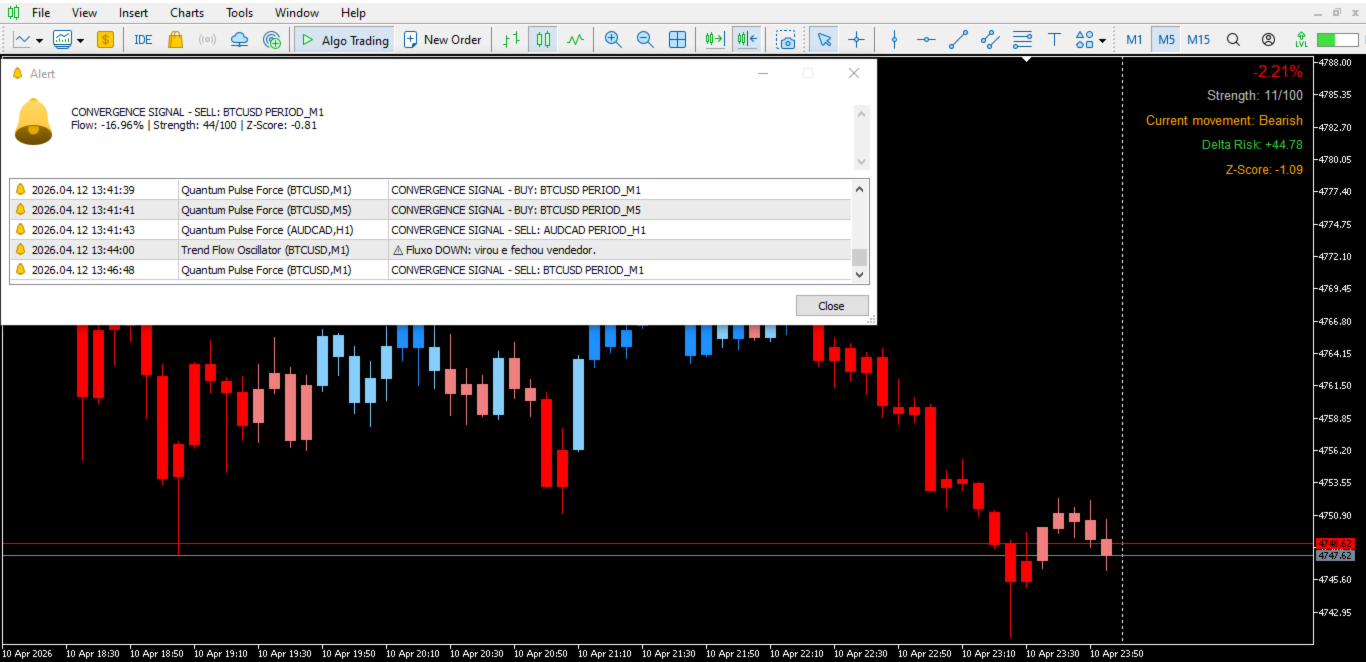
The indicator includes multiple configurable alert types.
Main monitored events:
-
Channel breakout
-
Strong signals
-
Reversals
-
Direction changes
-
Divergence
-
Z-Score extremes
-
Convergence signals
Each alert has frequency control to prevent excessive repetition.
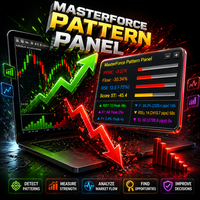
Information Panel
The panel displayed on the chart provides a summarized real-time view of the market.
Displayed information:
-
Percentage flow
-
Movement strength
-
Dominant direction
-
Delta Risk value
-
Z-Score state
-
Divergence indication
This panel allows for quick reading without the need for multiple indicators.
Configuration Parameters
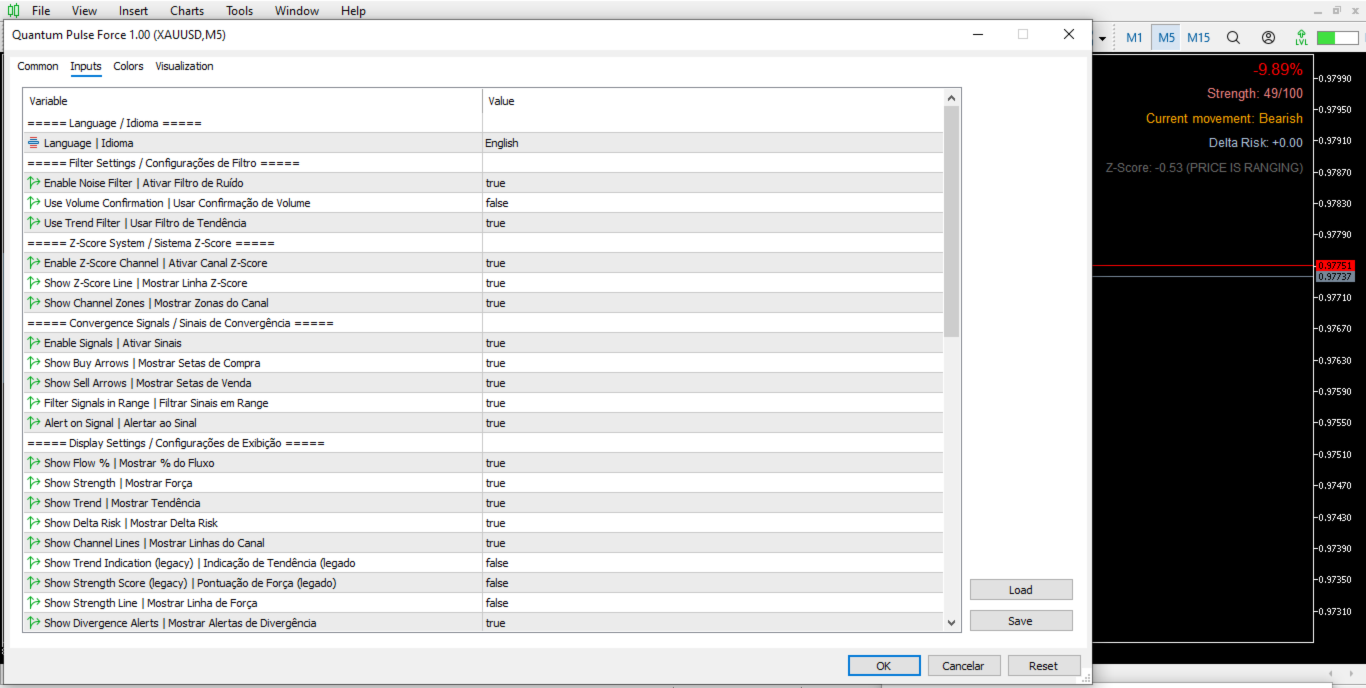
The indicator is highly customizable and organized into configuration groups.
Main groups:
-
Language
-
Analysis filters
-
Z-Score system
-
Convergence signals
-
Visual display
-
Text size
-
Quantum system
-
Candle coloring
-
Alerts
-
Reversal settings
This makes it possible to adapt the indicator to different trading styles.
Practical Use
The indicator can be used to:
-
Identify trends with greater precision
-
Avoid trades in sideways markets
-
Confirm entries with multiple filters
-
Detect loss of strength before reversals
-
Monitor market behavior in real time
It is suitable for different assets and works best in short- and medium-term movements.
Important Notes
This indicator is a technical analysis tool.
-
It does not execute trades automatically
-
It does not guarantee results
-
It should be used with risk management
-
Testing on a demo account is recommended before using it on a live account
Risk Disclaimer
Trading financial markets involves a risk of capital loss. Quantum Pulse Force does not guarantee profits and should be used only as a decision-support tool. The user is responsible for their own trading decisions.