Liquidation Reversal Signals MT4 Scanner
- Indicators
-
Duc Hoan Nguyen
 ->| I am a dedicated developer and programmer specializing in MQL4, MQL5, and Pine Script for TradingView, with a strong track record of success in building high-performing, tailored solutions for MT4, MT5, and TradingView platforms. Over the years, I have worked extensively within the financial and
 - Version: 1.0
- Activations: 10
New tools will be $30 for the first week or the first 3 purchases!
Trading Tools Channel on MQL5: Join my MQL5 channel to update the latest news from me
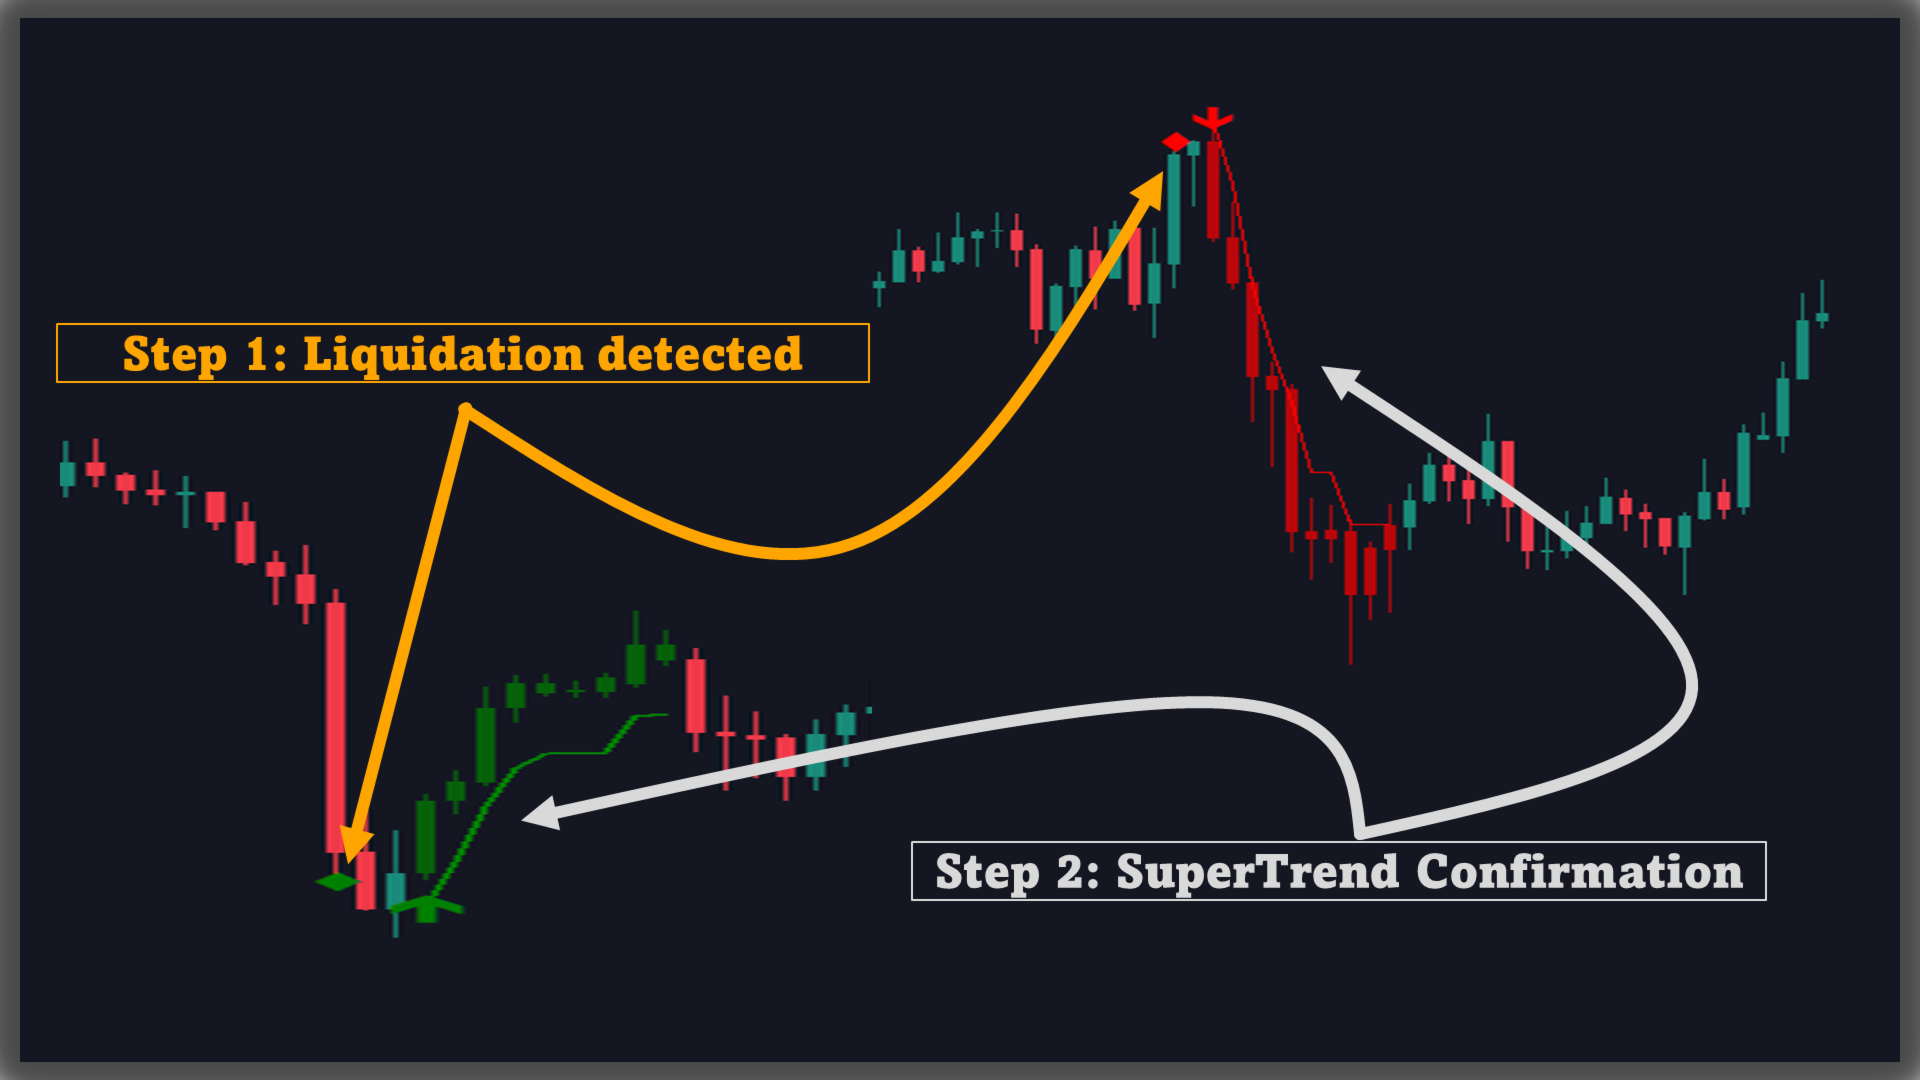
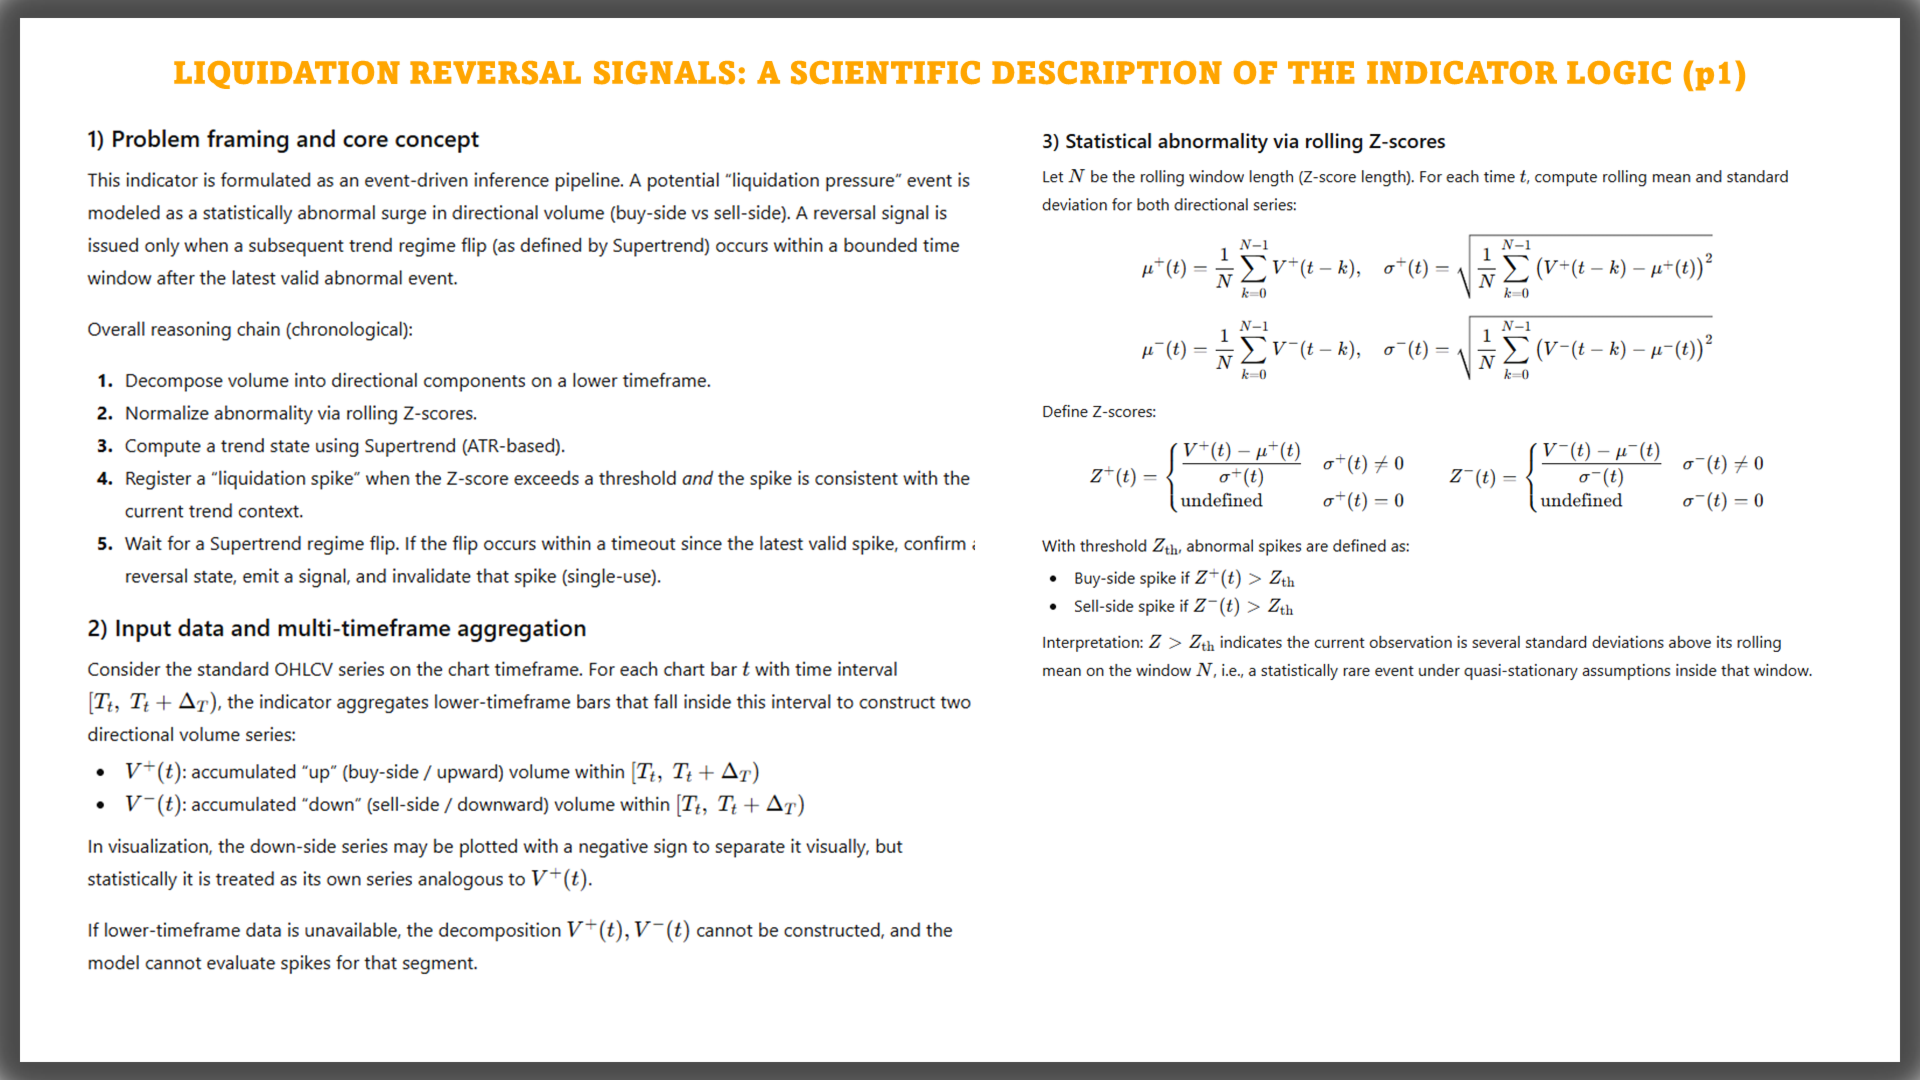
Liquidation Reversal Signals is an indicator designed to mark directional liquidation phases and confirm reversal points by combining Z-score volume extremes with Supertrend state changes. Instead of printing an arrow whenever a trend simply “changes color,” this tool separates the workflow into two clear layers:
-
Liquidation events: recorded when directional volume (up/down volume) from a Lower Timeframe produces a statistically significant spike beyond a defined threshold.
-
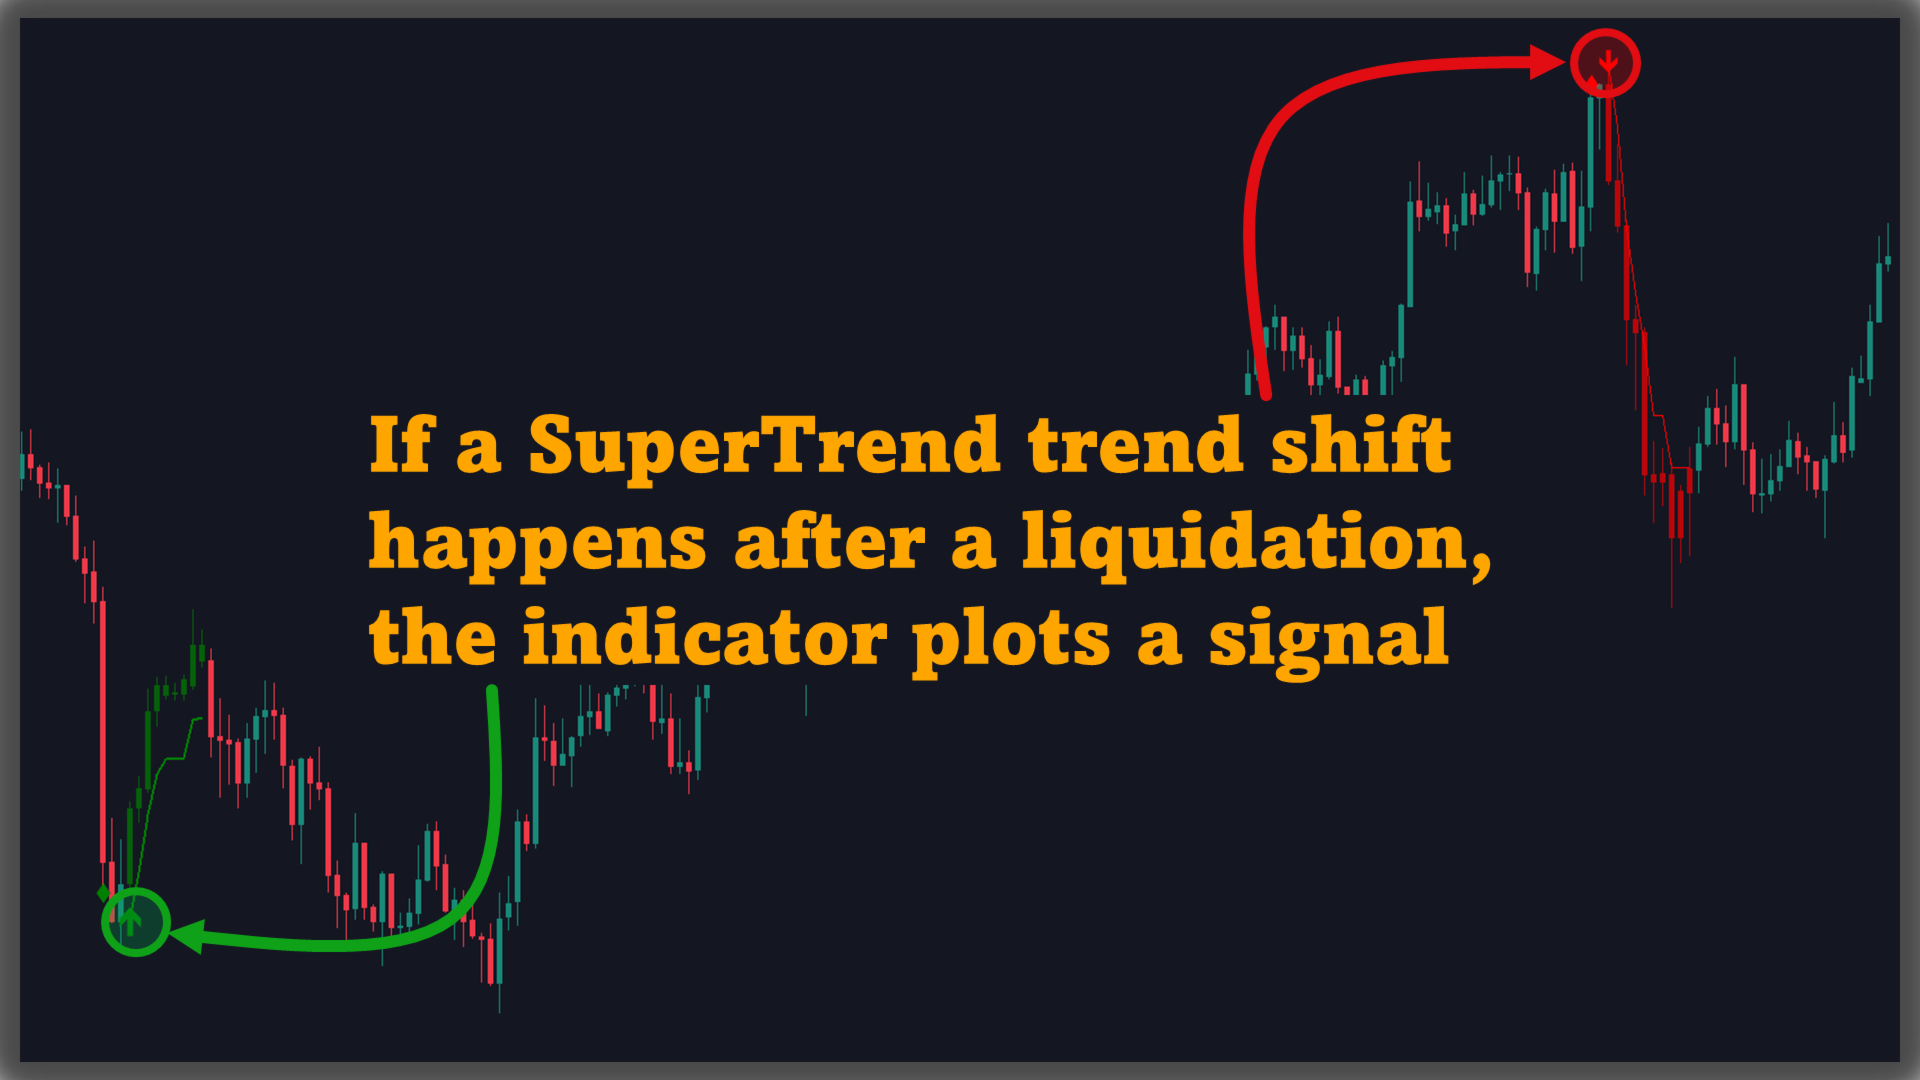
Reversal signals: confirmed only when Supertrend flips state while the recorded liquidation event remains valid inside a Timeout window.
This two-step structure makes the chart easier to read: you can see where the spike occurred, and only when a confirmation condition is met will BUY/SELL appear.
See more MT5 version at: Liquidation Reversal Signals MT5 Scanner
See more MT4 version at: Liquidation Reversal Signals MT4 Scanner
See more products at: All Products
1. Core engine: Z-score volume + Supertrend + Timeout
1.1. Directional volume from a Lower Timeframe
The indicator pulls data from a user-selected Lower Timeframe (typically a lower chart period) and splits volume into:
- Up volume: volume associated with upward movement
- Down volume: volume associated with downward movement
Using a lower timeframe adds more granularity to the directional volume input than relying only on the current chart timeframe.
1.2. Z-score normalization to identify spikesEach directional volume stream is normalized via Z-score using:
- Z Score Length: lookback window for mean and standard deviation
- Z-Score Threshold: spike threshold (events are recorded only when the threshold is exceeded)
This mechanism highlights statistically significant deviations of volume relative to its recent baseline.
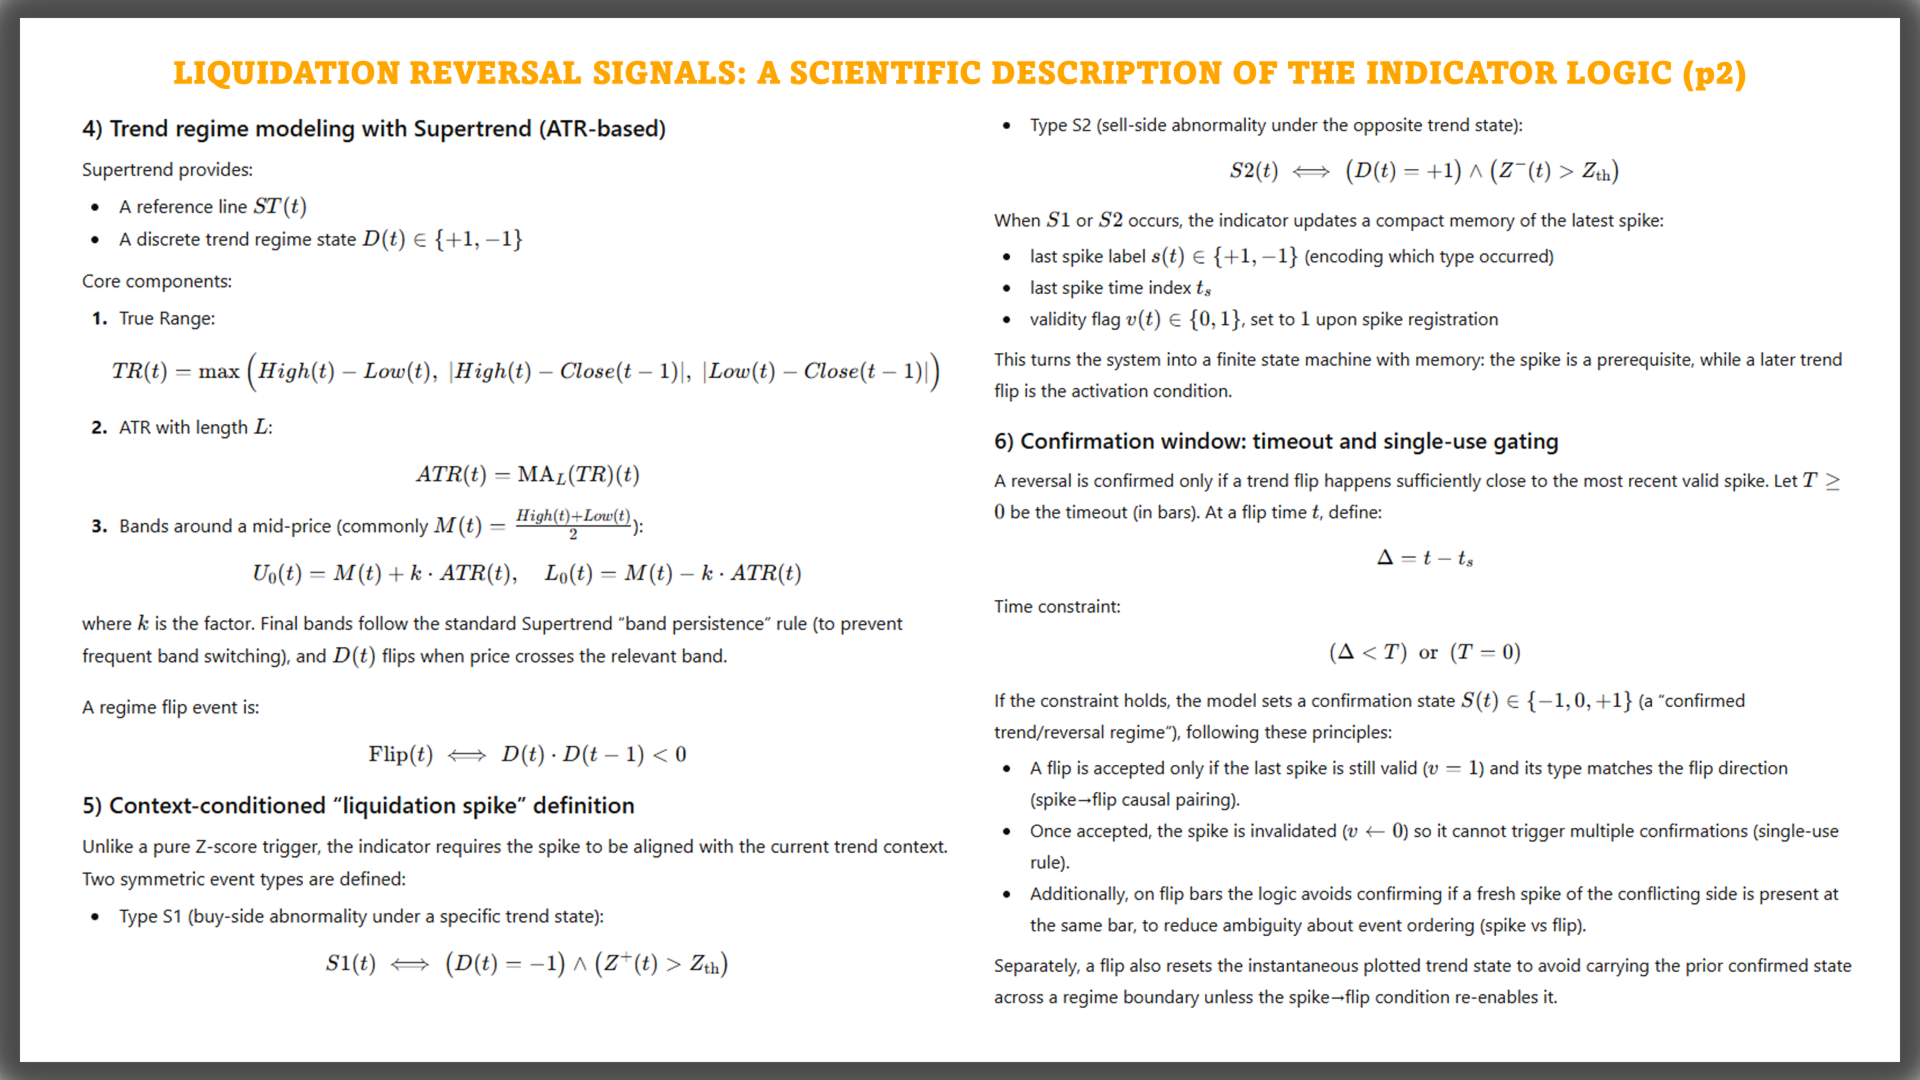
1.3. Supertrend as trend context and flip trigger
2.What you see on the chartOn the current chart, the indicator computes Supertrend using:
- SuperTrend Factor
- SuperTrend Length
Supertrend is both drawn on the chart and used as a state switch to detect transitions between bullish and bearish regimes.
1.4. Timeout: validity window for confirmationWhen a liquidation spike is recorded, the indicator stores its direction and bar reference and keeps it valid for:
- Liquidation Timeout Bars (0 = no limit)
A reversal signal is confirmed only if a Supertrend flip occurs within this validity window.
The display is modular so you can enable/disable each layer as needed.
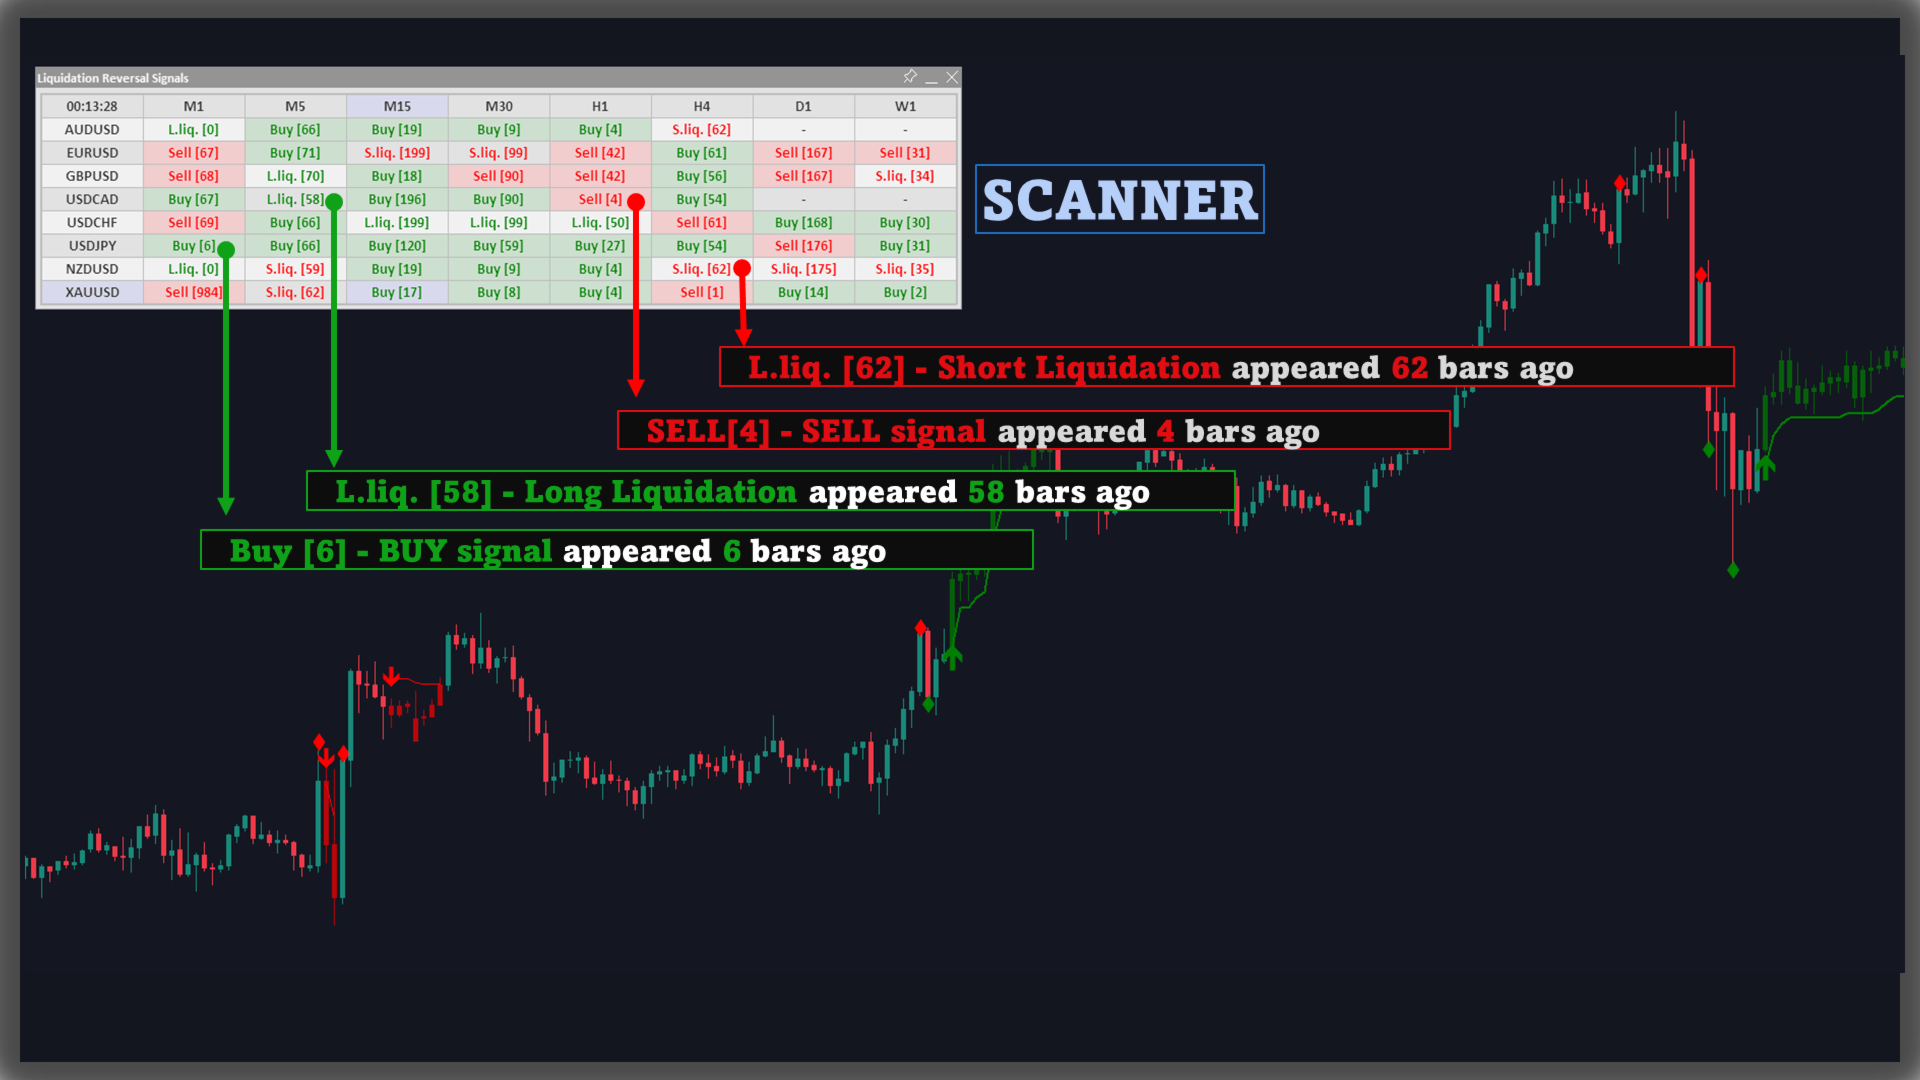
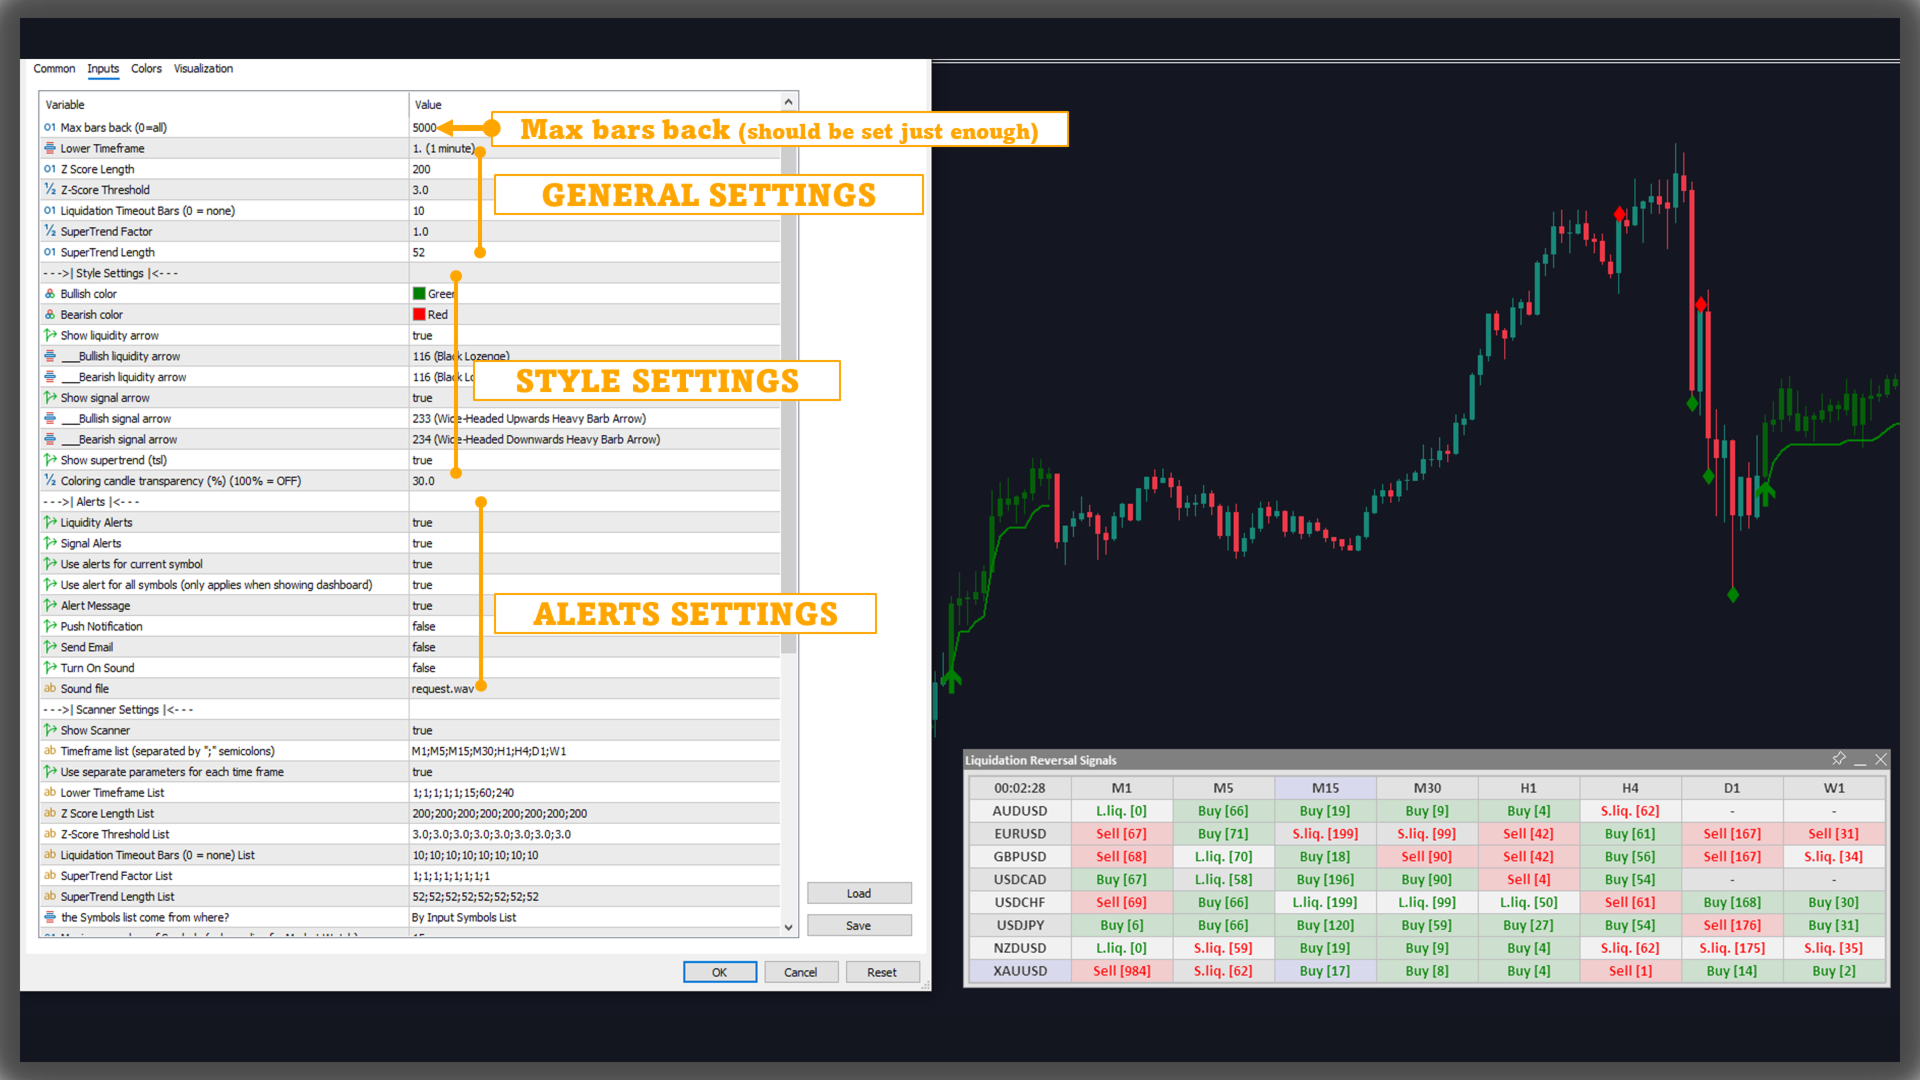
2.1. Liquidation marks (Show liquidity arrow)3. Key inputs and what they control Data & performanceTwo separate marks are available:
- Long Liquidation: symbol plotted below the candle
- Short Liquidation: symbol plotted above the candle
These marks are offset using ATR to avoid overlapping candles and to make spike locations easy to spot. You can choose separate arrow codes for each type.
2.2. BUY/SELL signal arrows (Show signal arrow)Once confirmation conditions are met, the indicator prints: BUY/SELL
Signal arrows are a separate layer from liquidation marks. You can set distinct arrow codes for BUY and SELL.
2.3. Supertrend lines (Show supertrend)Supertrend is drawn as two state-colored lines:
- a line representing the bullish phase
- a line representing the bearish phase
Bullish/bearish colors are configurable.
2.4. Candle coloring (Coloring candle transparency)Optional candle coloring is supported using:
- Coloring candle transparency (%)
- 100% = candle coloring off
- lower values apply state-based coloring with the chosen transparency
This helps emphasize state without overwhelming the price action.
-
Max bars back: limits the historical bars processed (0 = all), useful for balancing history depth and performance.
-
Lower Timeframe: timeframe used to source directional volume.
-
Z Score Length: longer values stabilize the baseline; shorter values react faster.
-
Z-Score Threshold: higher values filter for stronger spikes; lower values capture more spikes.
-
Liquidation Timeout Bars: maximum number of bars after a spike during which a Supertrend flip can confirm the signal.
-
SuperTrend Factor and SuperTrend Length: control how Supertrend tracks price and how frequently it flips.
The indicator provides two independent alert groups, each with its own on/off switch:
Liquidity Alerts5. Multi-symbol & multi-timeframe ScannerTriggered on:
Signal Alerts
- Long Liquidation
- Short Liquidation
Triggered on: BUY/SELL
Available alert channels:
- Alert Message
- Push Notification
- Send Email
- Sound (enable/disable and select the sound file)
You can also choose whether alerts apply to:
- the current symbol, or
- all symbols when using scanner/dashboard mode.
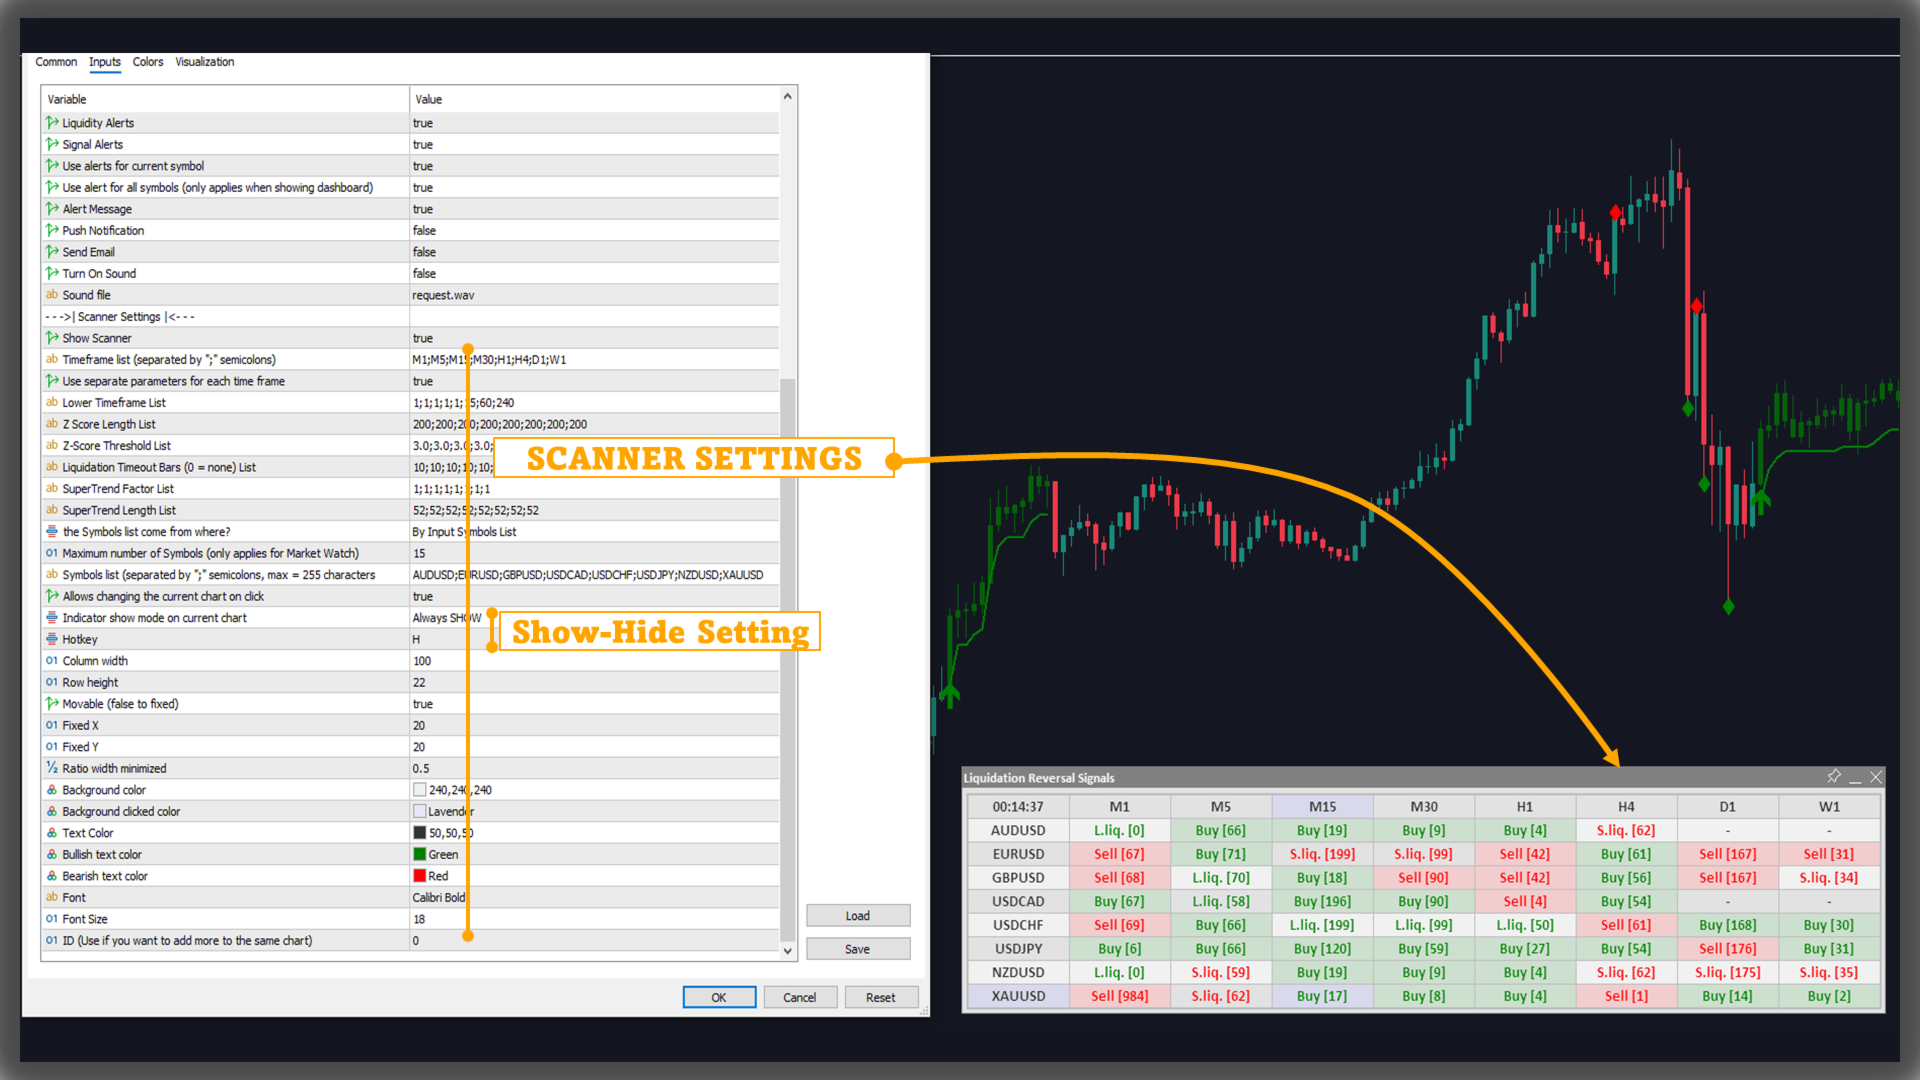
Scanner mode is intended for monitoring multiple symbols and timeframes in a table layout.
5.1. Timeframe list & per-timeframe parameter sets6. Data availability note and other
5.2. Symbol list & Market Watch limits
- Timeframe list: a ;-separated list of timeframes
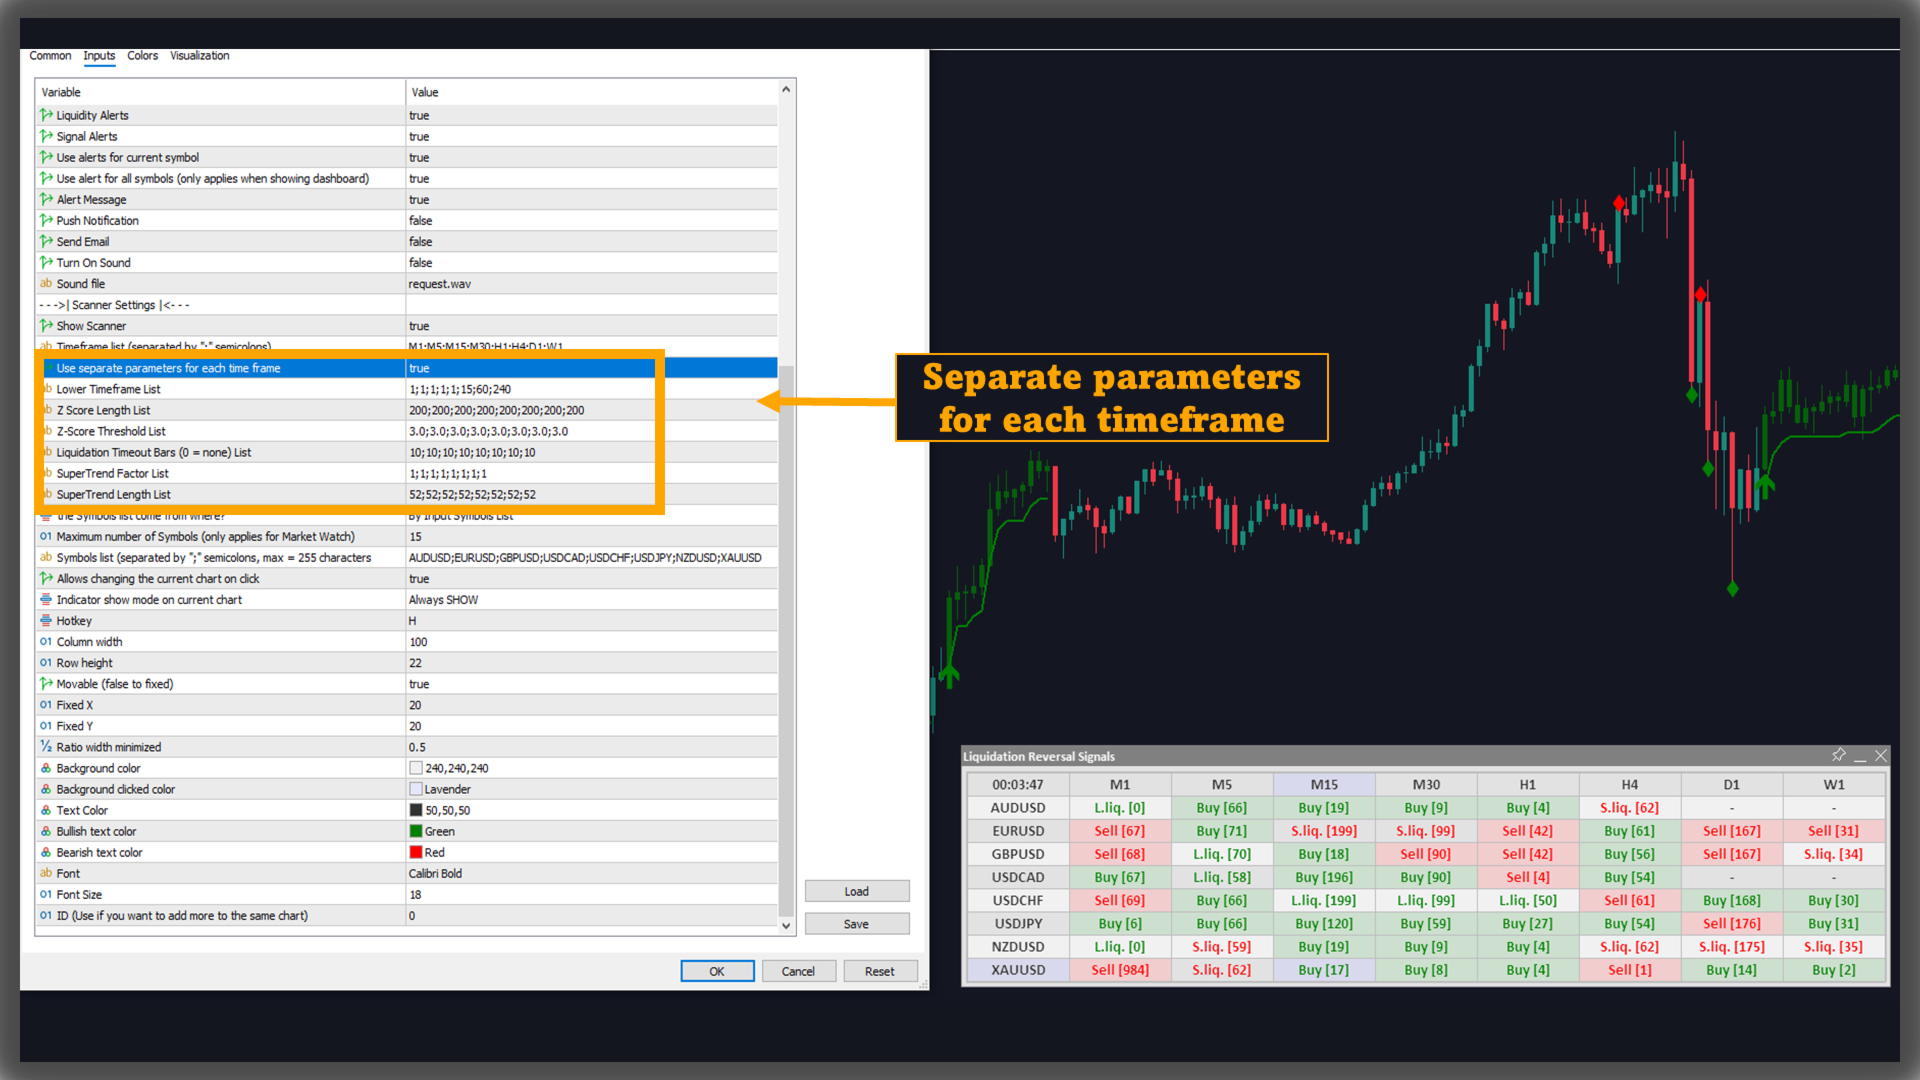
- Use separate parameters for each time frame: allows each timeframe to use its own parameter set through list-based configurations (Lower TF / Z-score / Timeout / Supertrend).
5.3. Interaction & layout controls
- Symbols list: a ;-separated list of symbols
- options to select symbol sources and cap the number of symbols when Market Watch contains many instruments.
- optional click-to-switch symbol behavior
- table controls: column width, row height, fixed or draggable position, X/Y anchors, minimized width ratio, background/text colors (including bullish/bearish text colors), font and font size, and table ID for running multiple tables.
A hotkey is also available for show/hide behavior depending on the selected display mode.
Directional volume is sourced from the selected Lower Timeframe. If that timeframe’s data is not available in the terminal yet, you may need to open the corresponding chart period to load data before the indicator can operate fully.
Using data from only one lower timeframe for all charts may not be necessary, so you can specify which chart uses which lower timeframe by using "separate parameters". Note that when using this function, other parameters will also be affected, so you need to adjust other parameters accordingly to avoid unnecessary confusion.
For example: enable "separate parameters" with lower timeframe list: "1;1;1;1;1;15;60;240" corresponding to timeframe list: "M1;M5;M15;M30;H1;H4;D1;W1". Then, the lower timeframe is determined by:
- M1: use lower timeframe M1 (1)
- M5: use lower timeframe M1 (1)
- M15: use lower timeframe M1 (1)
- M30: use lower timeframe M1 (1)
- H1: use lower timeframe M1 (1)
- H4: use lower timeframe M15 (15)
- D1: use lower timeframe H1 (60)
- W1: use lower timeframe H4 (240).
--> When using Scanner, you should use this option to optimize trading speed and efficiency.
Reducing the Z-Score Threshold will make signals easier to identify, resulting in more signals. You can increase or decrease this parameter to suit your trading style.