Liquidation Reversal Signals MT4 Scanner

Offerta speciale: ALL TOOLS, solo $35 ciascuno!

Nuovi strumenti saranno a $30 per la prima settimana o per i primi 3 acquisti

Trading Tools Channel on MQL5: Unisciti al mio canale MQL5 per aggiornarti sulle ultime novità da parte mia

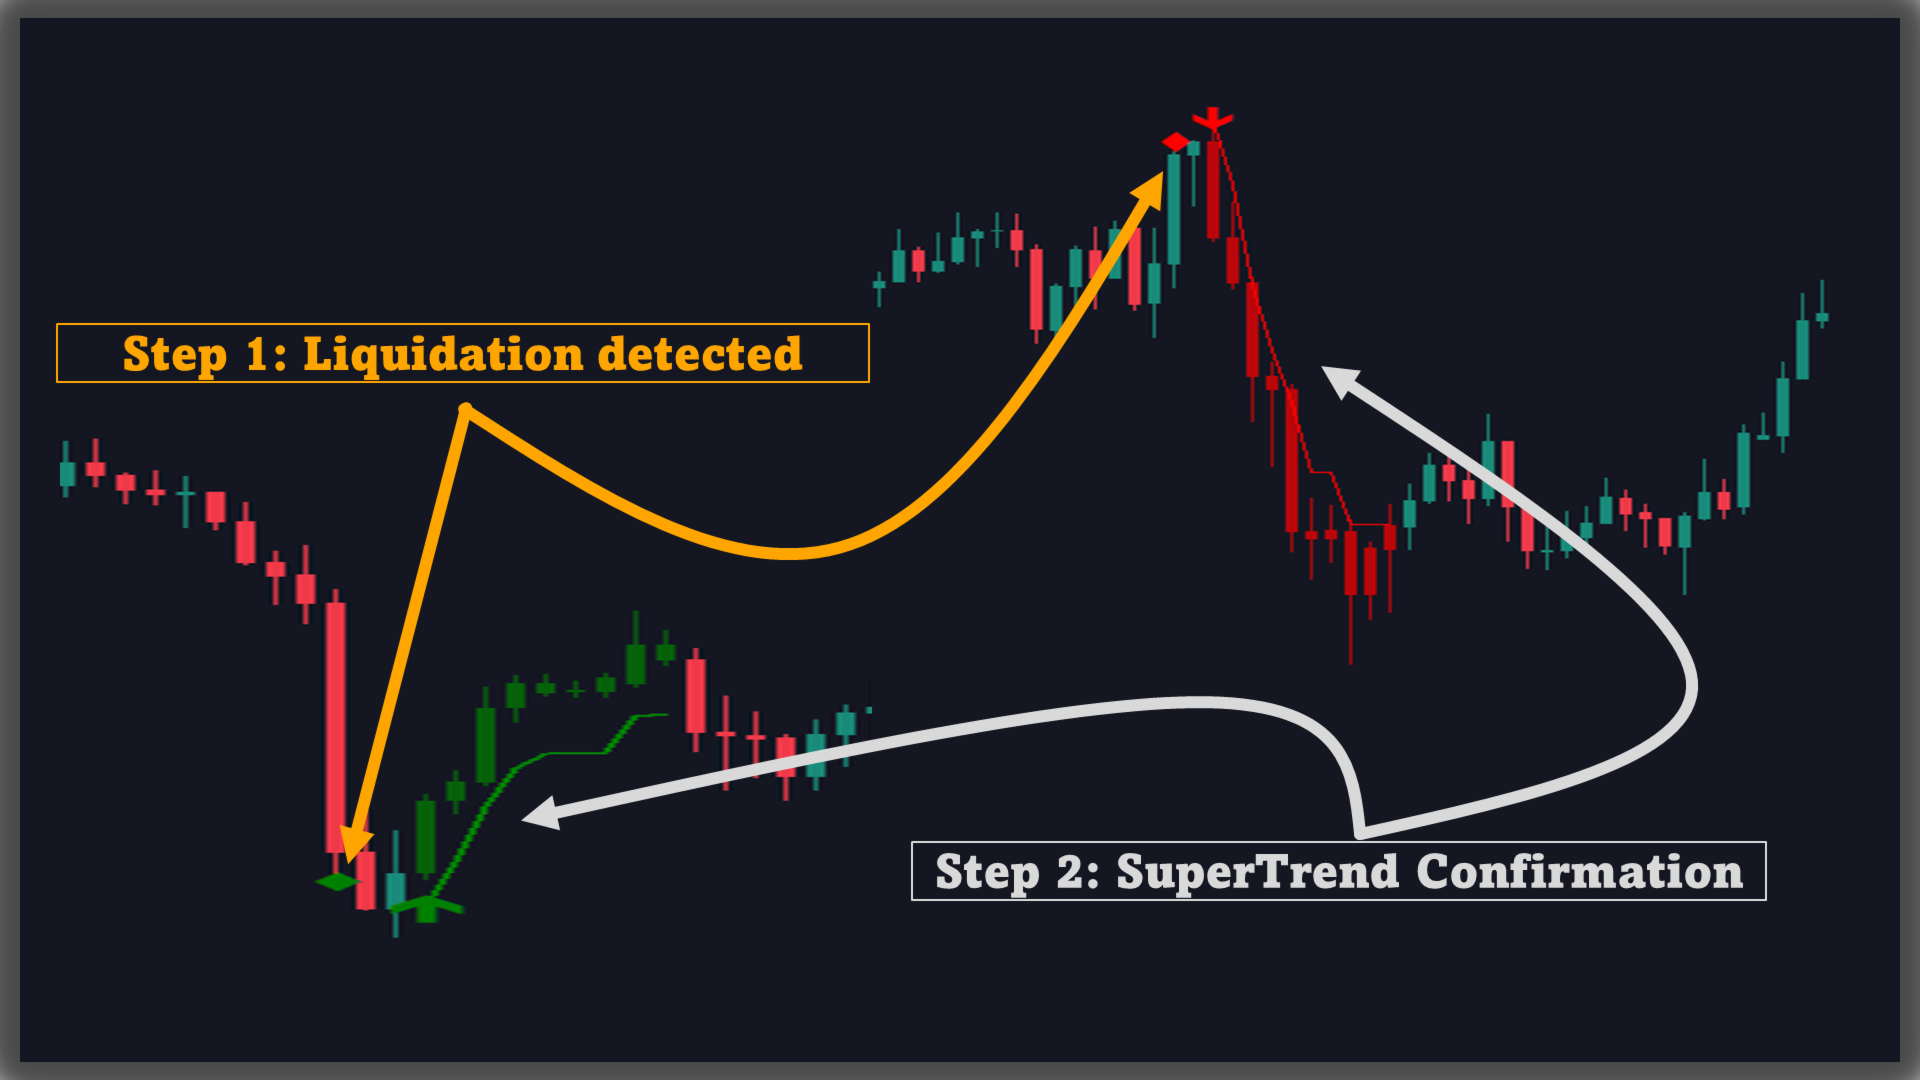
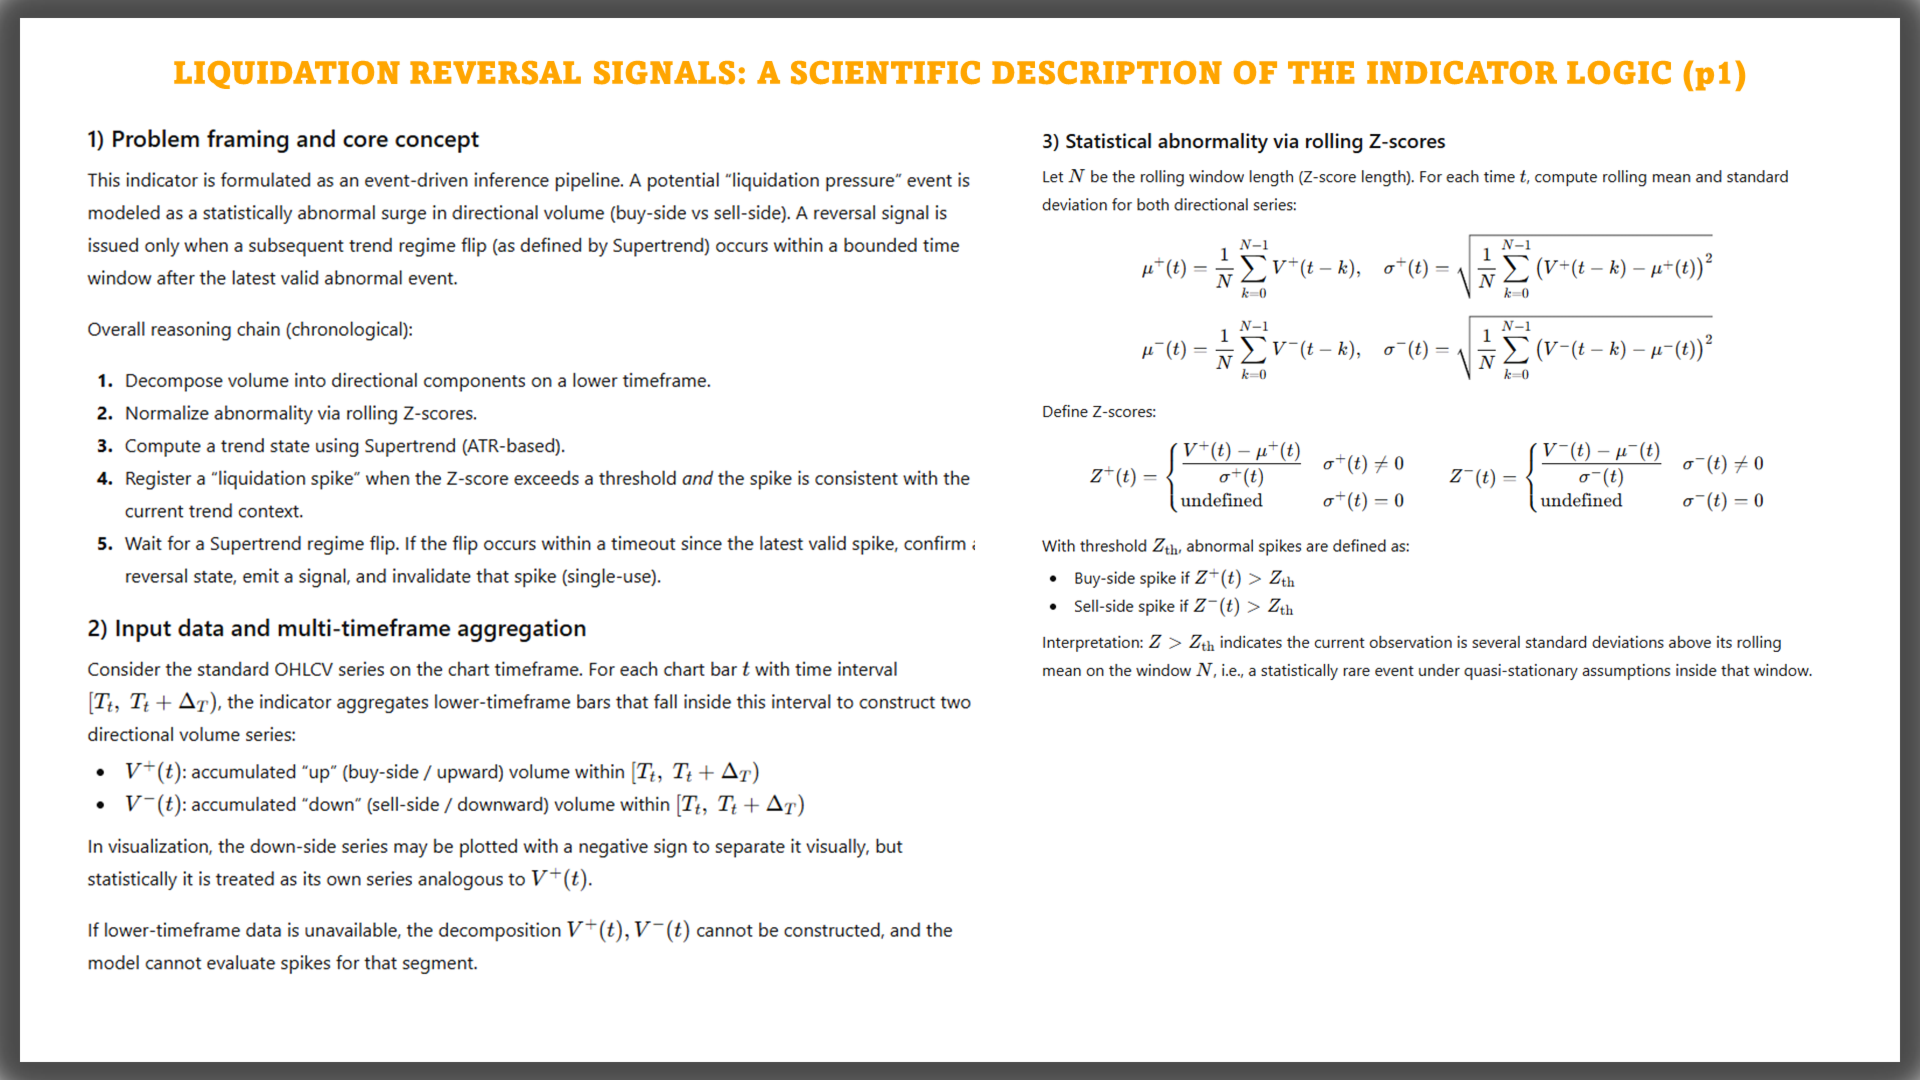
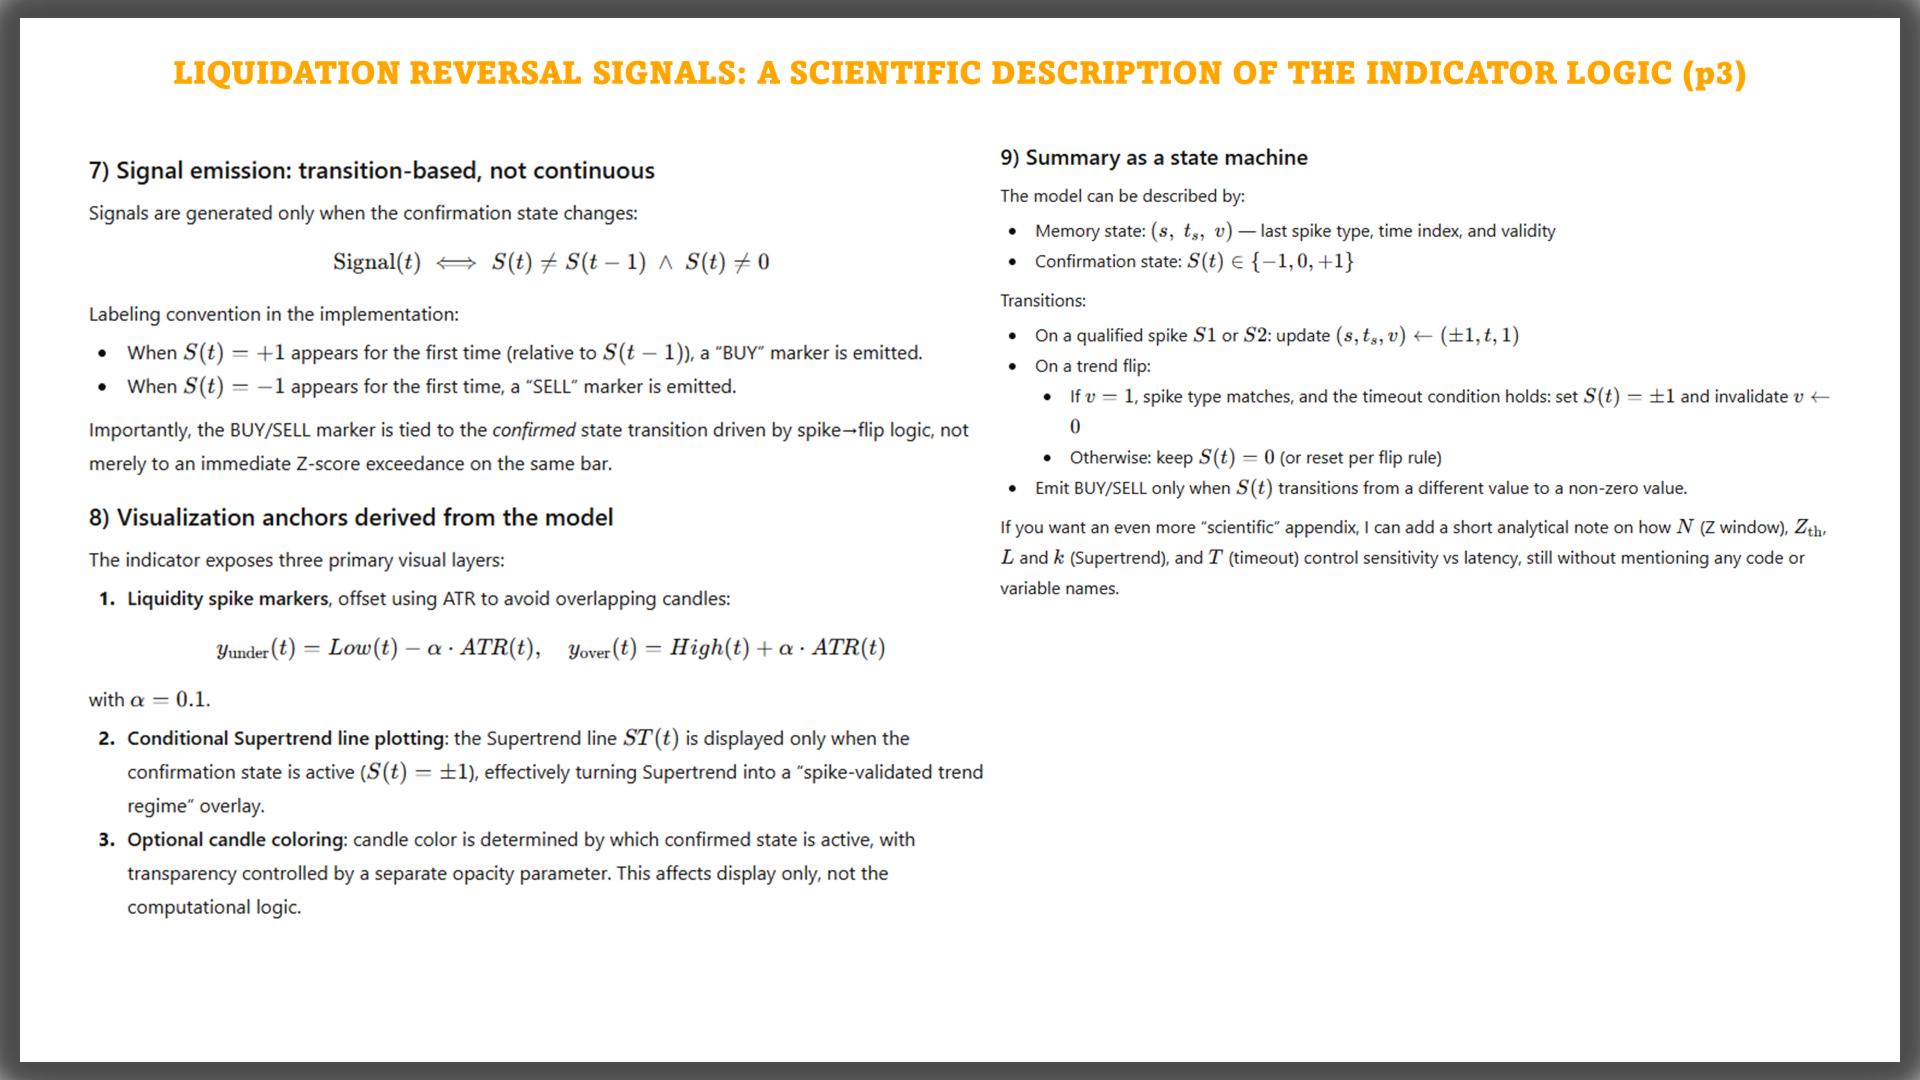
Liquidation Reversal Signals è un indicatore progettato per marcare fasi di liquidazione direzionali e confermare punti di inversione combinando estremi di volume Z-score con cambi di stato del Supertrend. Invece di stampare una freccia ogni volta che un trend semplicemente “cambia colore”, questo strumento separa il flusso di lavoro in due livelli chiari:

  1. Eventi di liquidazione: registrati quando il volume direzionale (volume up/down) da un Lower Timeframe produce un picco statisticamente significativo oltre una soglia definita.

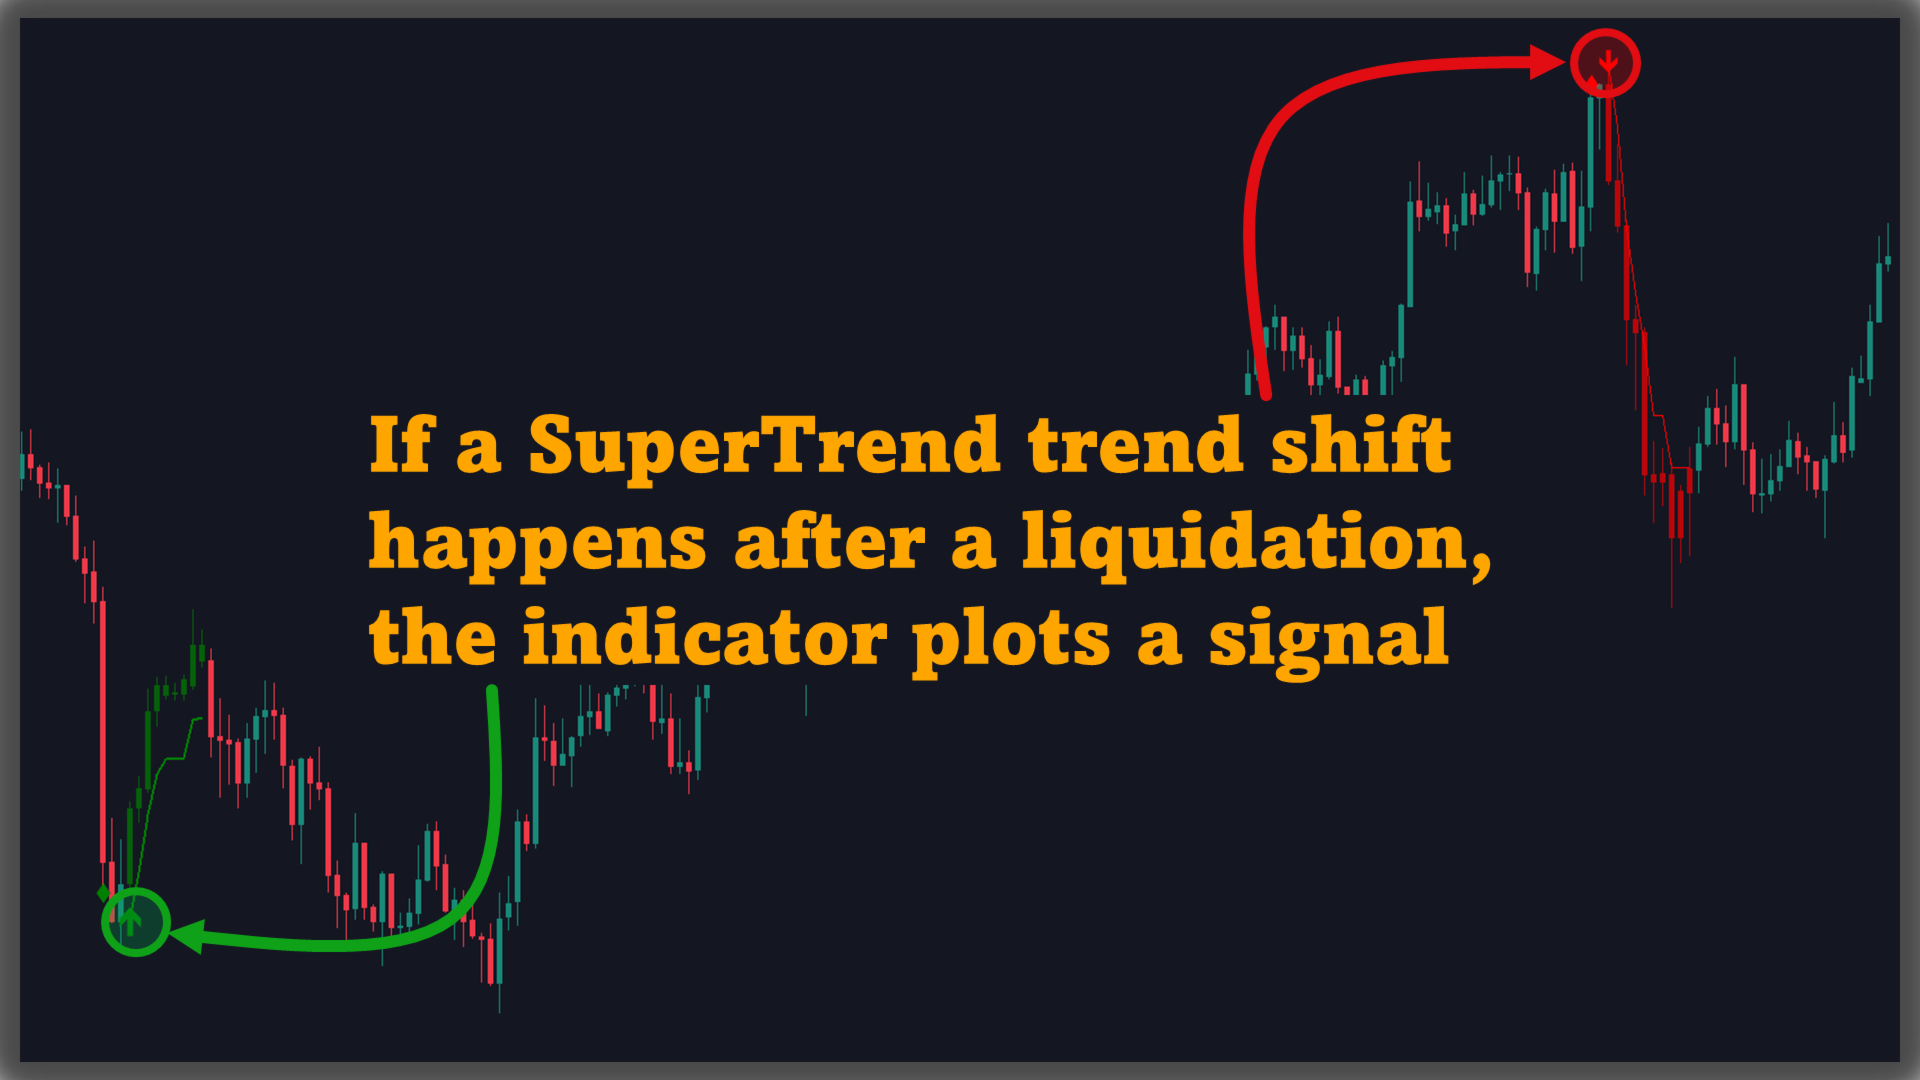
  2. Segnali di inversione: confermati solo quando Supertrend cambia stato mentre l’evento di liquidazione registrato resta valido dentro una finestra di Timeout.

Questa struttura in due passaggi rende il grafico più facile da leggere: puoi vedere dove è avvenuto il picco, e solo quando una condizione di conferma è soddisfatta BUY/SELL apparirà.

Vedi più versione MT5 su: Liquidation Reversal Signals MT5 Scanner

Vedi più versione MT4 su: Liquidation Reversal Signals MT4 Scanner

Vedi più prodotti su: All Products

1. Motore principale: Z-score volume + Supertrend + Timeout

1.1. Volume direzionale da un Lower Timeframe

L’indicatore estrae i dati da un Lower Timeframe selezionato dall’utente (tipicamente un periodo grafico più basso) e divide il volume in:

  • Up volume: volume associato al movimento rialzista
  • Down volume: volume associato al movimento ribassista

L’uso di un lower timeframe aggiunge più granularità all’input del volume direzionale rispetto al basarsi solo sul timeframe del grafico corrente.

1.2. Normalizzazione Z-score per identificare i picchi

Ogni flusso di volume direzionale viene normalizzato tramite Z-score usando:

  • Z Score Length: finestra lookback per media e deviazione standard
  • Z-Score Threshold: soglia di picco (gli eventi vengono registrati solo quando la soglia viene superata)

Questo meccanismo evidenzia deviazioni statisticamente significative del volume rispetto alla sua baseline recente.

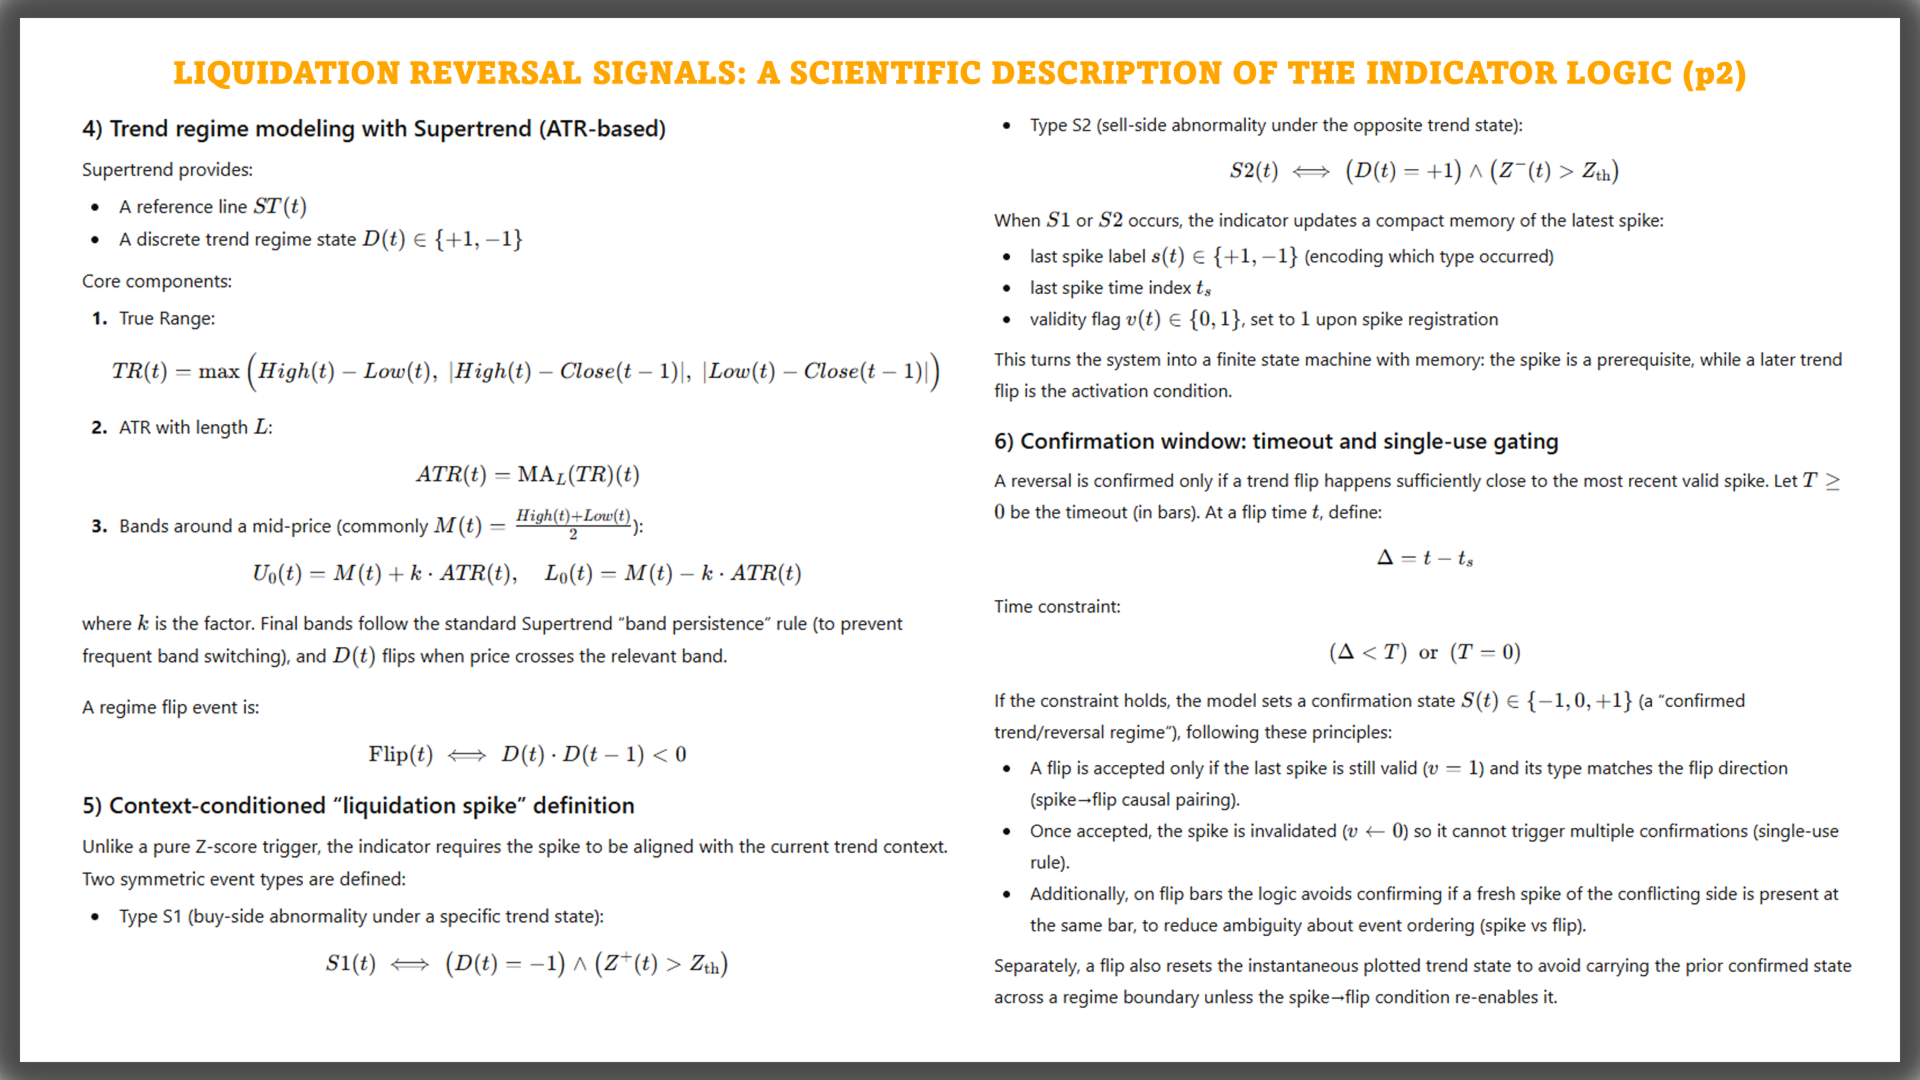
1.3. Supertrend come contesto di trend e trigger di flip

Nel grafico corrente, l’indicatore calcola Supertrend usando:

  • SuperTrend Factor
  • SuperTrend Length

Supertrend viene disegnato sul grafico ed è usato come interruttore di stato per rilevare transizioni tra regimi rialzisti e ribassisti.

1.4. Timeout: finestra di validità per la conferma

Quando viene registrato un picco di liquidazione, l’indicatore memorizza direzione e riferimento della barra e lo mantiene valido per:

  • Liquidation Timeout Bars (0 = nessun limite)

Un segnale di inversione viene confermato solo se un flip del Supertrend avviene entro questa finestra di validità.

2. Cosa vedi sul grafico

La visualizzazione è modulare, così puoi abilitare/disabilitare ogni livello secondo necessità.

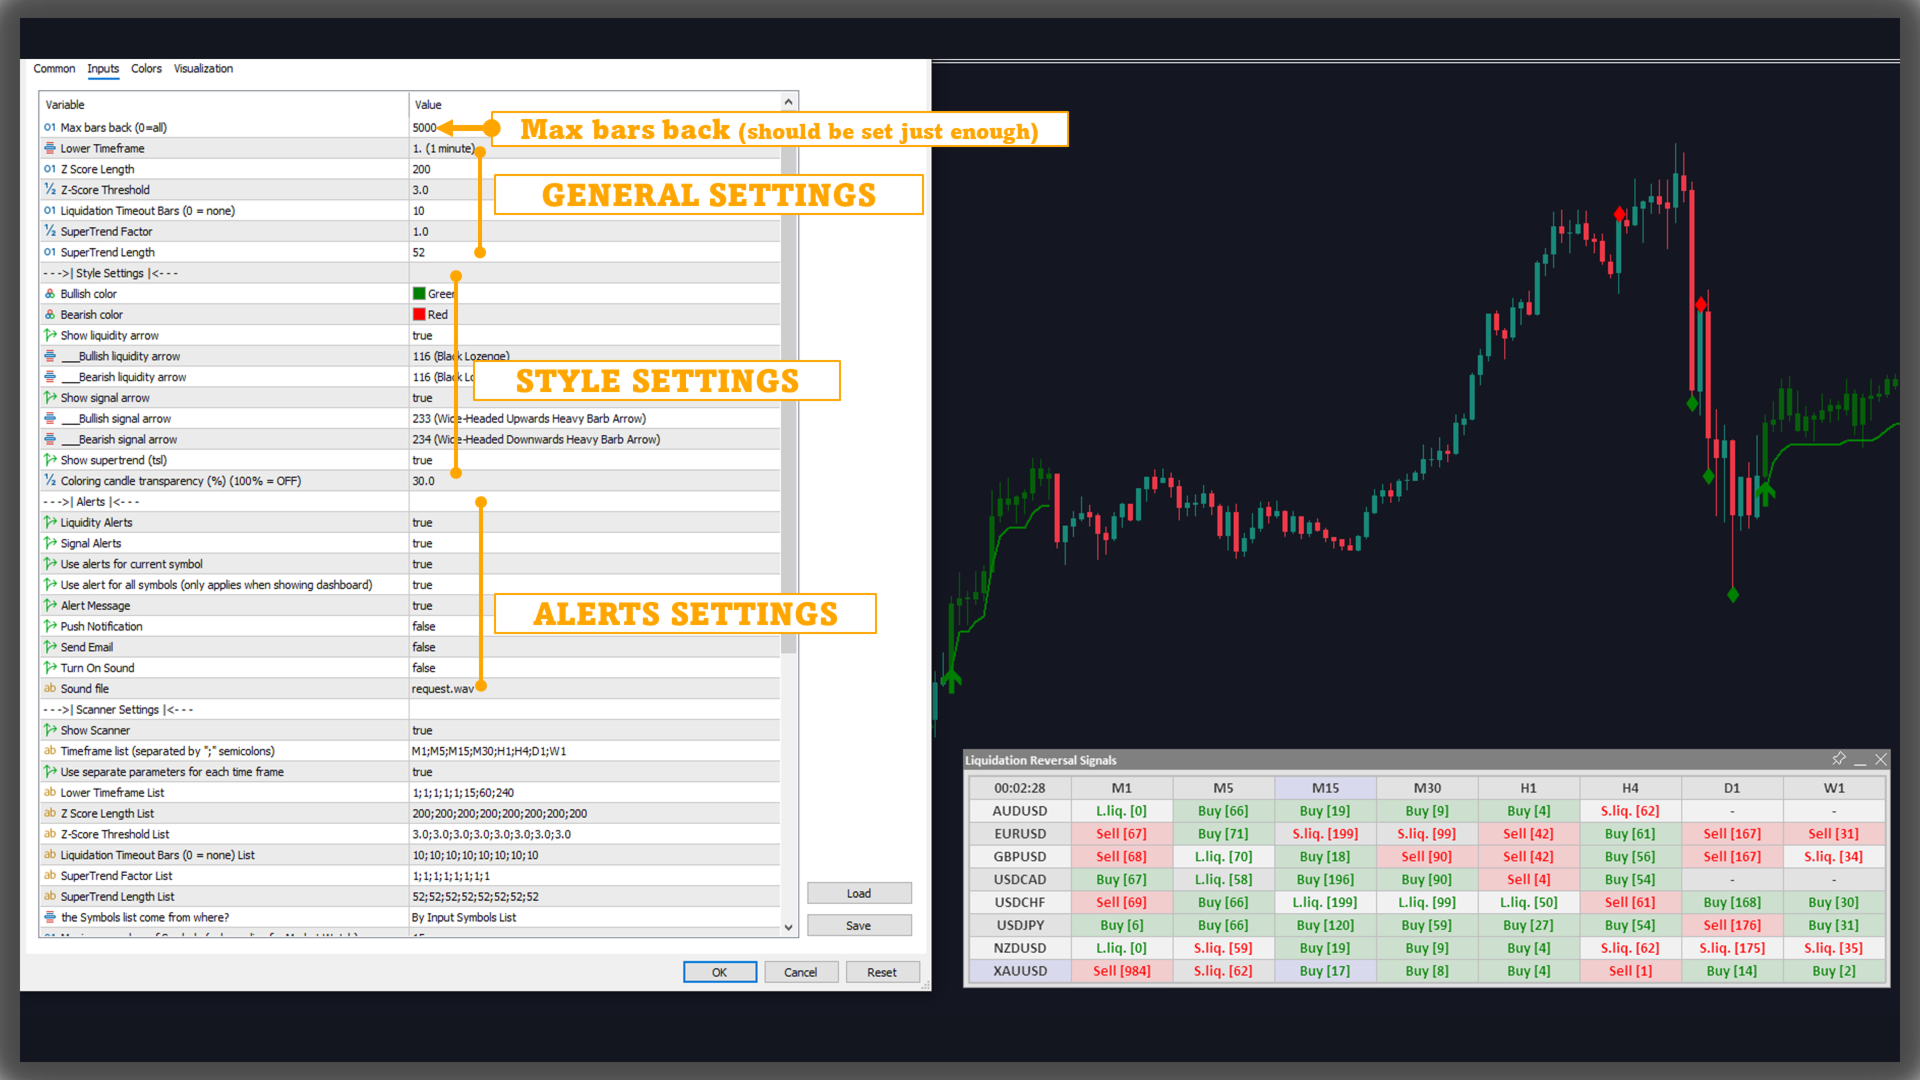
2.1. Marcature di liquidazione (Show liquidity arrow)

Sono disponibili due marcature separate:

  • Long Liquidation: simbolo tracciato sotto la candela
  • Short Liquidation: simbolo tracciato sopra la candela

Queste marcature sono offset usando ATR per evitare sovrapposizioni con le candele e rendere facili da individuare le posizioni dei picchi. Puoi scegliere arrow codes separati per ogni tipo.

2.2. Frecce segnale BUY/SELL (Show signal arrow)

Una volta soddisfatte le condizioni di conferma, l’indicatore stampa: BUY/SELL

Le frecce segnale sono un livello separato rispetto alle marcature di liquidazione. Puoi impostare arrow codes distinti per BUY e SELL.

2.3. Linee Supertrend (Show supertrend)

Supertrend è disegnato come due linee colorate per stato:

  • una linea che rappresenta la fase rialzista
  • una linea che rappresenta la fase ribassista

I colori rialzista/ribassista sono configurabili.

2.4. Colorazione delle candele (Coloring candle transparency)

È supportata una colorazione opzionale delle candele usando:

  • Coloring candle transparency (%)
    • 100% = colorazione candele off
    • valori più bassi applicano una colorazione basata sullo stato con la trasparenza scelta

Questo aiuta a enfatizzare lo stato senza sovraccaricare l’azione del prezzo.

3. Input chiave e cosa controllano Data & performance
  • Max bars back: limita le barre storiche processate (0 = tutte), utile per bilanciare profondità dello storico e performance.

  • Lower Timeframe: timeframe usato per ricavare il volume direzionale.

Z-score (sensibilità ai picchi)
  • Z Score Length: valori più lunghi stabilizzano la baseline; valori più corti reagiscono più velocemente.

  • Z-Score Threshold: valori più alti filtrano picchi più forti; valori più bassi catturano più picchi.

Conferma basata sul tempo
  • Liquidation Timeout Bars: numero massimo di barre dopo un picco durante il quale un flip del Supertrend può confermare il segnale.

Supertrend (sensibilità di flip)
  • SuperTrend Factor and SuperTrend Length: controllano come Supertrend segue il prezzo e quanto spesso cambia stato.

4. Alerts: separa “events” da “signals”

L’indicatore fornisce due gruppi di alert indipendenti, ciascuno con il proprio switch on/off:

Liquidity Alerts

Attivati su:

  • Long Liquidation
  • Short Liquidation
Signal Alerts

Attivati su: BUY/SELL

Canali di alert disponibili:

  • Alert Message
  • Push Notification
  • Send Email
  • Sound (abilita/disabilita e seleziona il file audio)

Puoi anche scegliere se gli alert si applicano a:

  • il simbolo corrente, oppure
  • tutti i simboli in modalità scanner/dashboard.
5. Scanner multi-simbolo & multi-timeframe

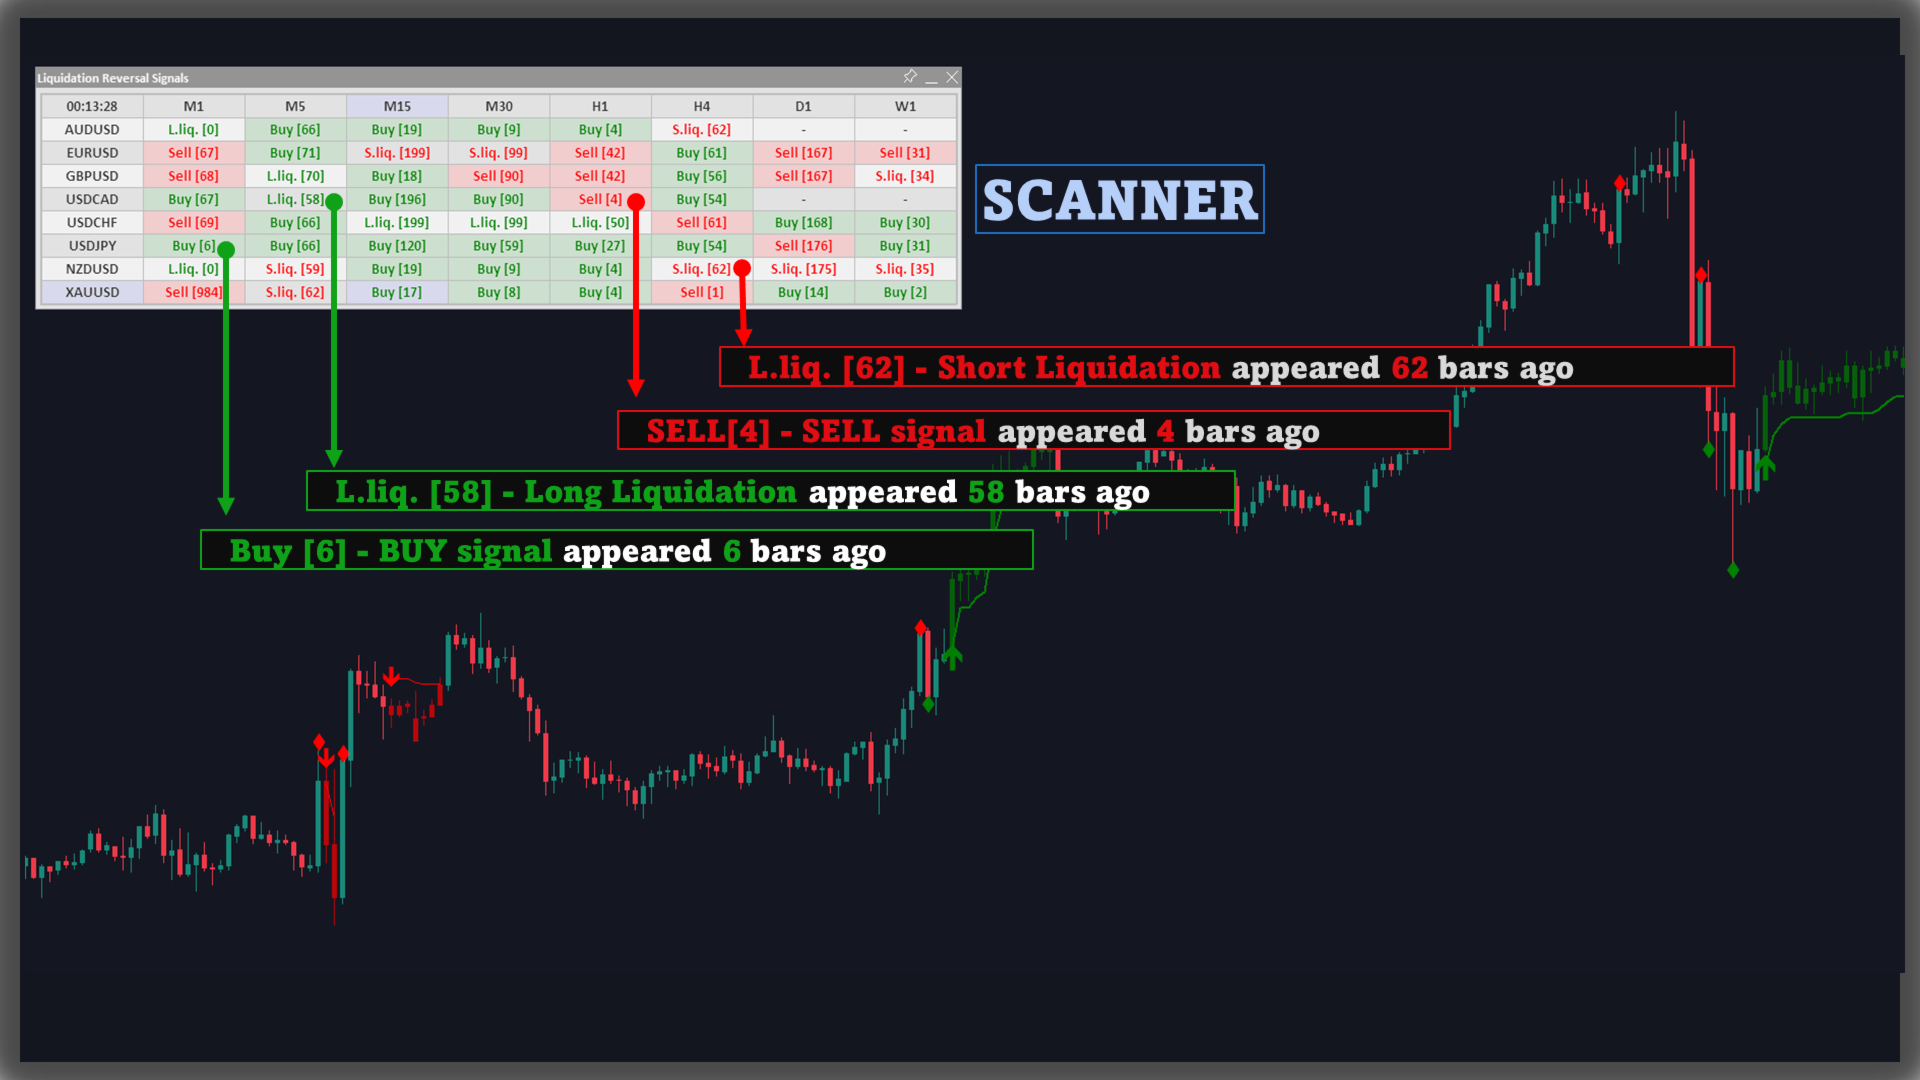
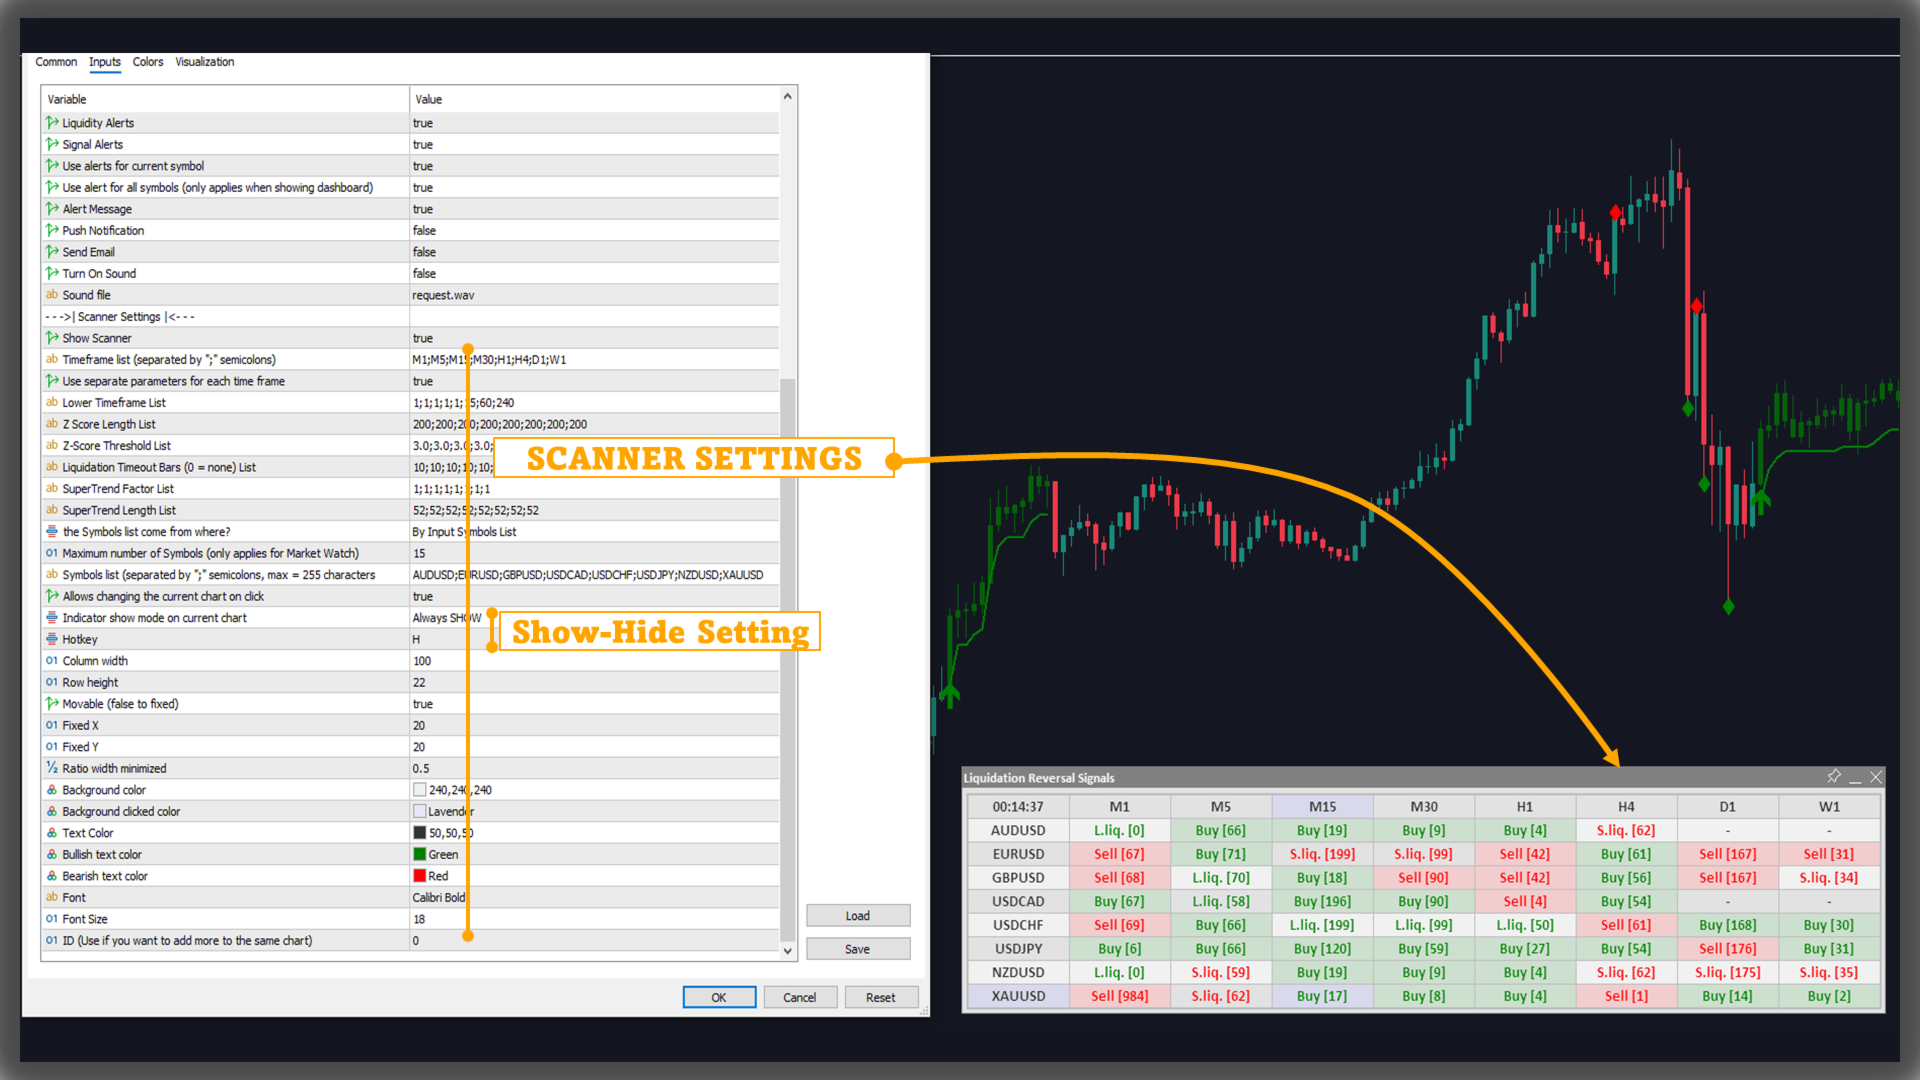
La modalità Scanner è pensata per monitorare più simboli e timeframe in un layout a tabella.

5.1. Lista timeframe & set di parametri per timeframe
  • Timeframe list: lista di timeframe separata da ;
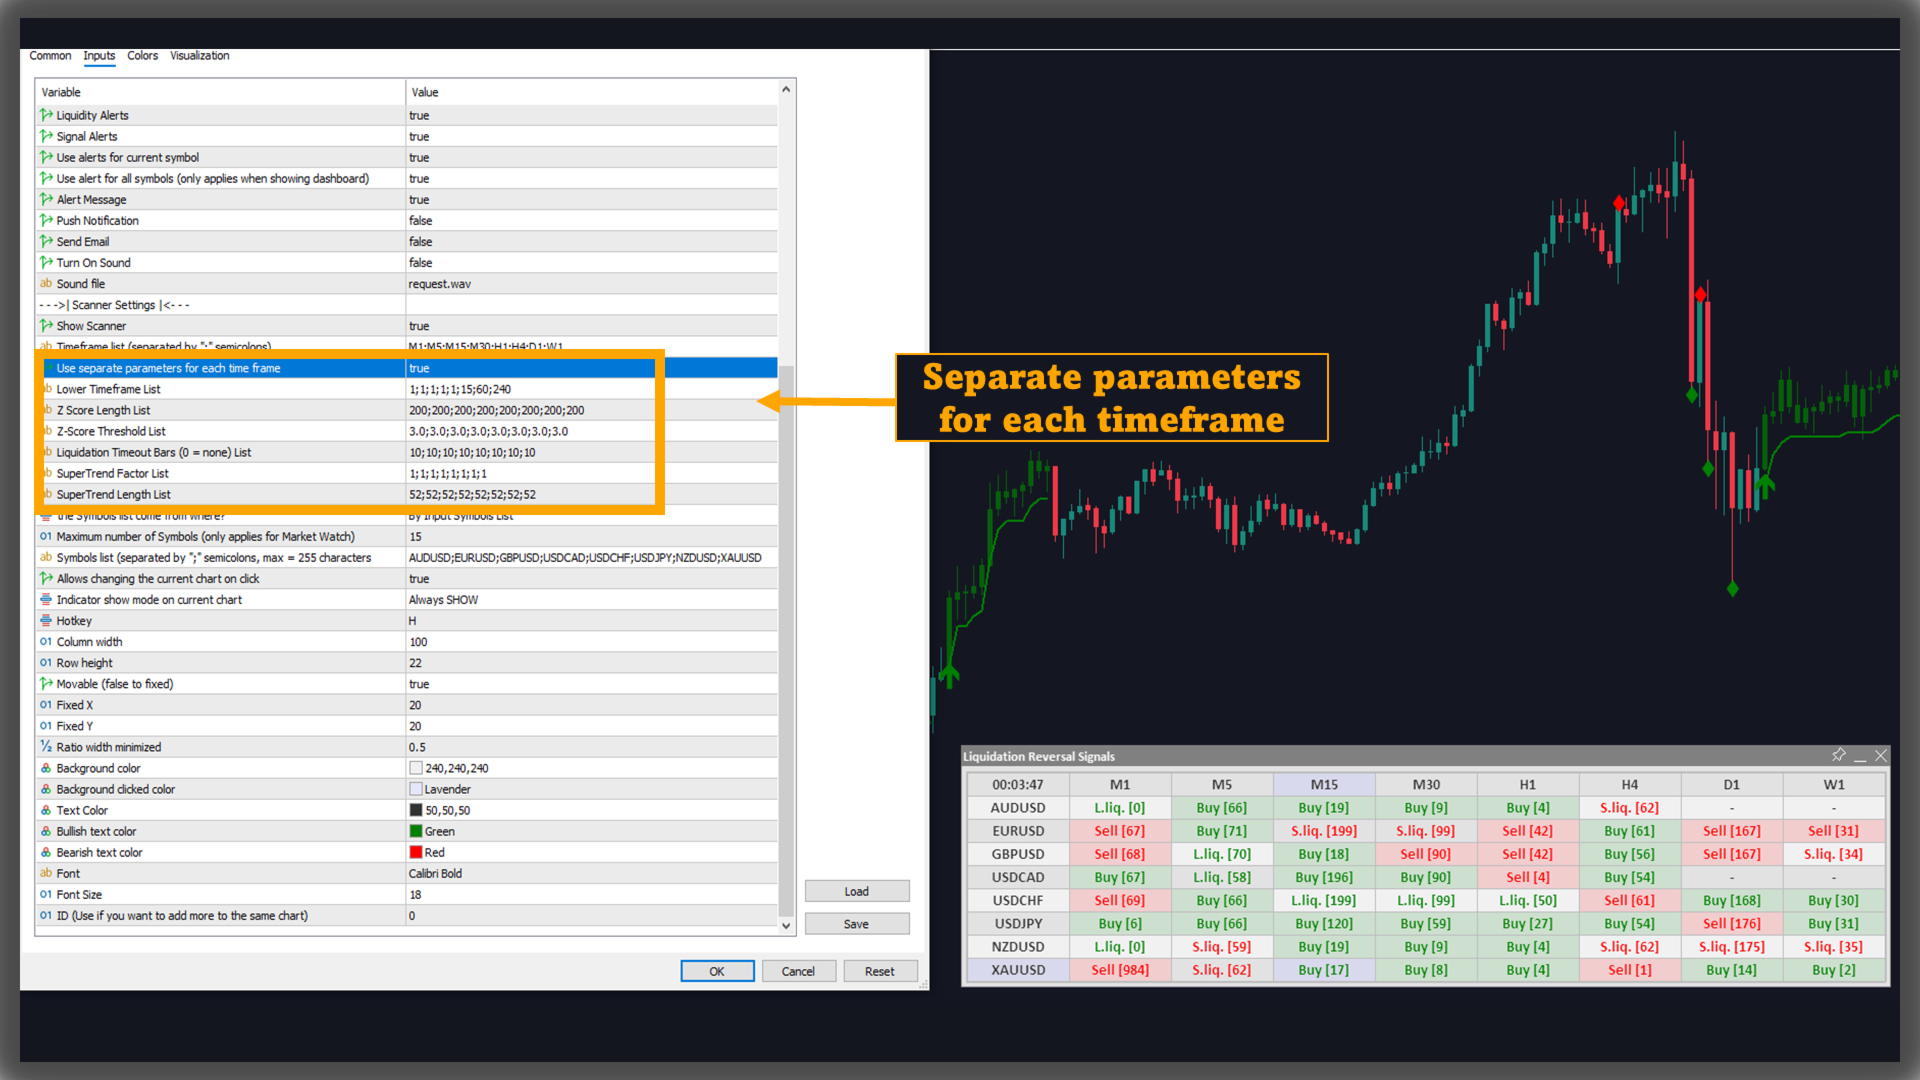
  • Usa separate parameters for each time frame: consente a ogni timeframe di usare il proprio set di parametri tramite configurazioni a lista (Lower TF / Z-score / Timeout / Supertrend).
5.2. Lista simboli & limiti Market Watch
  • Symbols list: lista di simboli separata da ;
  • opzioni per selezionare le fonti dei simboli e limitare il numero di simboli quando Market Watch contiene molti strumenti.
5.3. Controlli di interazione & layout
  • comportamento opzionale click-to-switch simbolo
  • controlli tabella: larghezza colonna, altezza riga, posizione fissa o trascinabile, ancoraggi X/Y, rapporto larghezza minimizzata, colori sfondo/testo (inclusi colori testo rialzista/ribassista), font e dimensione font, e ID tabella per eseguire più tabelle.

È disponibile anche un hotkey per show/hide a seconda della modalità di visualizzazione selezionata.

6. Nota sulla disponibilità dei dati e altro

Il volume direzionale è ricavato dal Lower Timeframe selezionato. Se i dati di quel timeframe non sono ancora disponibili nel terminale, potrebbe essere necessario aprire il relativo periodo del grafico per caricare i dati prima che l’indicatore possa operare completamente.

Usare dati da un solo lower timeframe per tutti i grafici potrebbe non essere necessario, quindi puoi specificare quale grafico usa quale lower timeframe usando "separate parameters". Nota che usando questa funzione anche altri parametri saranno influenzati, quindi devi regolarli di conseguenza per evitare confusione inutile.

Esempio: abilita "separate parameters" con la lista lower timeframe: "1;1;1;1;1;15;60;240" corrispondente alla lista timeframe: "M1;M5;M15;M30;H1;H4;D1;W1". Quindi, il lower timeframe è determinato da:

- M1: usa lower timeframe M1 (1)

- M5: usa lower timeframe M1 (1)

- M15: usa lower timeframe M1 (1)

- M30: usa lower timeframe M1 (1)

- H1: usa lower timeframe M1 (1)

- H4: usa lower timeframe M15 (15)

- D1: usa lower timeframe H1 (60)

- W1: usa lower timeframe H4 (240).

--> Quando usi Scanner, dovresti usare questa opzione per ottimizzare velocità ed efficienza di trading.

Ridurre il Z-Score Threshold renderà i segnali più facili da identificare, producendo più segnali. Puoi aumentare o diminuire questo parametro per adattarlo al tuo stile di trading.


Prodotti consigliati
Alpha Trend sign has been a very popular trading tool in our company for a long time. It can verify our trading system and clearly indicate trading signals, and the signals will not drift. Main functions: Based on the market display of active areas, indicators can be used to intuitively determine whether the current market trend belongs to a trend market or a volatile market. And enter the market according to the indicator arrows, with green arrows indicating buy and red arrows indicating se
Auto Fibo Pro m
DMITRII GRIDASOV
Indicatore "Auto FIBO Pro" Crypto_Forex: è un ottimo strumento ausiliario nel trading! - L'indicatore calcola e posiziona automaticamente sul grafico i livelli di Fibo e le linee di tendenza locali (colore rosso). - I livelli di Fibonacci indicano le aree chiave in cui il prezzo può invertirsi. - I livelli più importanti sono 23,6%, 38,2%, 50% e 61,8%. - Puoi usarlo per lo scalping di inversione o per il trading di zone grid. - Ci sono molte opportunità per migliorare il tuo sistema attuale us
Trendiness Index
Libertas LLC
5 (3)
"The trend is your friend" is one of the best known sayings in investing, because capturing large trendy price movements can be extremely profitable. However, trading with the trend is often easier said than done, because many indicators are based on price reversals not trends. These aren't very effective at identifying trendy periods, or predicting whether trends will continue. We developed the Trendiness Index to help address this problem by indicating the strength and direction of price trend
Infinity Trend Pro
Yaroslav Varankin
1 (1)
This is a trend indicator without redrawing Developed instead of the binary options strategy (by the color of the Martingale candlestick) Also works well in forex trading When to open trades (binary options) A signal will appear in the place with a candle signaling the current candle It is recommended to open a deal for one candle of the current timeframe M1 and M5 When a blue dot appears, open a deal up When a red dot appears, open a trade down. How to open trades on Forex. When a signal is rec
PABT Pattern Indicator - it's classical system one of the signal patterns. Indicator logic - the Hi & Lo of the bar is fully within the range of the preceding bar, look to trade them as pullback in trend. In the way if indicator found PABT pattern it's drawing two lines and arrow what showing trend way.  - First line - it's entry point and drawing at: 1. On the high of signal bar or on middle of the signal bar (depending from indicator mode) for buy; 2. On the low of signal bar or on middle of t
Distinctive
Tatiana Savkevych
Distinctive is a forex trending arrow indicator for identifying potential entry points. I like it, first of all, because it has a simple mechanism of work, adaptation to all time periods and trading tactics. Created on the basis of a regression channel with filters. Plotting the Lawrence indicator signals on a price function chart using a mathematical approach. How it works - when the price breaks out in the overbought / oversold zone (channel levels), a buy or sell signal is generated. Everyt
The Th3Eng PipFinite indicator is based on a very excellent analysis of the right trend direction with perfect custom algorithms. It show the true direction and the best point to start trading. With StopLoss point and Three Take Profit points. Also it show the right pivot of the price and small points to order to replace the dynamic support and resistance channel, Which surrounds the price. And Finally it draws a very helpful Box on the left side on the chart includes (take profits and Stop loss
Trade with Gann on your side!! MASTER CIRCLE 360 CIRCLE CHART, originally created by Gann admitted that this is “The Mother of all charts”. It is one of the last studies that this great trader left for us. The numeric tab le is apparently quite simple like all the tables and is based on square numbers, the SQUARE OF 12 and is by evolution, one of the most important square numbers. Here we can find CYCLE, PRICE AND TIME thanks to angles and grades, to show past and future support and resistance.
Trend PA
Mikhail Nazarenko
5 (3)
The Trend PA indicator uses   Price Action   and its own filtering algorithm to determine the trend. This approach helps to accurately determine entry points and the current trend on any timeframe. The indicator uses its own algorithm for analyzing price changes and Price Action. Which gives you the advantage of recognizing, without delay, a new nascent trend with fewer false positives. Trend filtering conditions can be selected in the settings individually for your trading style. The indicator
Trend Ray
Andriy Sydoruk
The indicator shows the potential trend direction by cyclical-wave dependence. Thus, all the rays of the intersection will be optimal rays, in the direction of which the price is expected to move, taking into account the indicator period. Rays can be used as a direction for potential market movement. But we must not forget that the approach must be comprehensive, the indicator signals require additional information to enter the market.
"Impulses and Corrections 4" is created to help traders navigate the market situation. The indicator shows multi-time frame upward and downward "Impulses" of price movements. These impulses are the basis for determining the "Base" , which is composed of zones of corrections of price movements, as well as "Potential" zones for possible scenarios of price movement. Up and down impulses are determined based on a modified formula of Bill Williams' "Fractals" indicator. The last impulse is always "U
L'indicatore SMC Venom Model BPR è uno strumento professionale per i trader che operano nell'ambito del concetto di Smart Money (SMC). Identifica automaticamente due modelli chiave sul grafico dei prezzi: FVG   (Fair Value Gap) è una combinazione di tre candele, in cui c'è un gap tra la prima e la terza candela. Forma una zona tra livelli in cui non c'è supporto di volume, il che spesso porta a una correzione dei prezzi. BPR   (Balanced Price Range) è una combinazione di due modelli FVG che for
RSI Speed mp
DMITRII GRIDASOV
Indicatore Crypto_Forex "RSI SPEED" per MT4 - ottimo strumento predittivo, senza bisogno di ridisegnare. - Il calcolo di questo indicatore si basa su equazioni fisiche. L'RSI SPEED è la derivata prima dell'RSI stesso. - L'RSI SPEED è ottimo per scalping di ingresso nella direzione del trend principale. - Usalo in combinazione con un indicatore di trend appropriato, ad esempio HTF MA (come nelle immagini). - L'indicatore RSI SPEED mostra la velocità con cui l'RSI cambia direzione: è molto sensi
The   RSI Divergence + FVG Signal   indicator combines   Relative Strength Index (RSI) Divergence   with   Fair Value Gap (FVG)   detection to generate high-probability buy and sell signals based on both momentum shifts and institutional imbalance zones. Core Features: RSI Divergence Detection : Identifies both regular and hidden bullish/bearish divergences between price and RSI. Divergences indicate potential trend reversals or continuation. FVG Zone Recognition : Detects Fair Value Gaps (imbal
Super Reversal Pattern
Parfait Mujinga Ndalika
Super Reversal Pattern Indicator Unlock the power of advanced pattern recognition with our Super Reversal Pattern Indicator. Designed for traders seeking precision and reliability, this indicator identifies one of the most effective reversal patterns in technical analysis, offering a significant edge in your trading strategy. Key Features: Non-Repainting Accuracy: Enjoy the confidence of non-repainting technology. Once a Super Reversal Pattern is detected, it remains static, providing consiste
FX Flow
Eva Stella Conti
FX Flow   indicator can be used as an anticipator of the next trend, preferably confirmed by Price Action or another oscillator (RSi, Stochastic ..). It takes the money flows of the major currencies USD EUR GBP AUD NZD CAD CHF JPY into account, and processes them. Excellent tool for indices, but also for correlations between currencies. Works on each timeframes.  Blue line: Bull market Yellow line: Bear market Note : if the indicator opens the window, but does not draw lines, load the historie
Price Magnet — Price Density and Attraction Levels Indicator Price Magnet is a professional analytical tool designed to identify key support and resistance levels based on statistical Price Density. The indicator analyzes a specified historical period and detects price levels where the market spent the most time. These zones act as “magnets,” attracting price action or forming a structural base for potential reversals. Unlike traditional Volume Profile tools, Price Magnet focuses on price-time d
Naturu MT4
Ivan Stefanov
“Naturu” è un indicatore manuale che utilizza la simmetria della natura come algoritmo. Conquista il mercato con una strategia semplice e saggezza nascosta! Quando carichi l’indicatore, vedrai due linee: Top e Bottom. Clicca una volta su una linea per attivarla. Per spostarla, basta cliccare sulla candela dove vuoi posizionarla. Definisci un punto alto e un punto basso, e l’indicatore calcola automaticamente: Una zona magenta che mostra dove gli interessi di tori e orsi sono più vicini, ossia l’
VR Cub
Vladimir Pastushak
VR Cub è un indicatore per ottenere punti di ingresso di alta qualità. L'indicatore è stato sviluppato per facilitare i calcoli matematici e semplificare la ricerca dei punti di ingresso in una posizione. La strategia di trading per la quale è stato scritto l'indicatore ha dimostrato la sua efficacia per molti anni. La semplicità della strategia di trading è il suo grande vantaggio, che consente anche ai trader alle prime armi di commerciare con successo con essa. VR Cub calcola i punti di apert
[ZhiBiCCI] indicators are suitable for all cycle use, and are also suitable for all market varieties. [ZhiBiCCI] Green solid line is a reversal of bullish divergence. The green dotted line is a classic bullish divergence. [ZhiBiCCI] The solid line to the red is a reverse bearish divergence. The red dotted line is a classical bearish divergence. [ZhiBiCCI] can be set in the parameters (Alert, Send mail, Send notification), set to (true) to send instant signals to the alarm window, email, insta
Laser Trend
Nicolas Zouein
The trend is your friend! This is what this indicator is all about. Follow this famous saying and be safe. Characteristics: Buy/Sell signals fixed on the close of a bar. Works on all symbols and all timeframes. Clear visual market trend laser line, Buy/Sell signal arrows, market strength meter, TP1 & TP2 boxes. Visual signals when to enter, when to exit the market. No repainting. Compatible with Flexible EA for trading automation. (Ask for a free set file optimized to perform 2010-2018) Parame
Noize Absorption Index MT4
Ekaterina Saltykova
5 (1)
Noize Absorption Index - is the manual trading system that measures the difference of pressure between bears forces and bulls forces. Green line - is a noize free index that showing curent situation. Zero value of index shows totally choppy/flat market.Values above zero level shows how powerfull bullish wave is and values below zero measures bearish forces.Up arrow appears on bearish market when it's ready to reverse, dn arrow appears on weak bullish market, as a result of reverse expectation. S
Trend Scanner
Vladimir Kalendzhyan
4.33 (6)
By purchasing this indicator, you have the right to receive a free copy of one of   my other indicator's or advisor’s!  (All future updates are included. No limits) . To get it , please contact me by  mql5 message ! The Trend Scanner trend line indicator displays the trend direction and its changes. The indicator works on all currency pairs and  timeframes. The indicator simultaneously displays multiple readings on the price chart: the support and resistance lines of the currency pair, the exist
Overview Harmonic Patterns MT4 is a technical analysis indicator designed for the MetaTrader 5 platform. It identifies and displays harmonic price patterns, such as Butterfly, Cypher, Crab, Bat, Shark, and Gartley, in both bullish and bearish directions. The indicator calculates key price levels, including entry, stop loss, and three take-profit levels, to assist traders in analyzing market movements. Visual elements and customizable alerts enhance usability on the chart. Features Detects six ha
This is an arrow indicator without a future function,developed based on the most advanced profit trading algorithms.It has the most innovative and advanced dual trend analysis module, as well as the latest and highly effective market trend prediction algorithm.Trends are your friends, and following larger trends can earn the maximum profit in foreign exchange. This indicator helps traders identify current trends and track them. Someone once made a profit of 10 times in a week by relying on it.No
Fractal Zig Zag
Mikhail Nazarenko
A   professional version of the ZigZag indicator for visualizing the structure of price movements by fractals. Fractal ZigZag fixes the flaws of the standard version of the ZigZag indicator MT4. It uses Price action and a unique filtering algorithm to determine fractals. Suitable for all types of trading. Ideal for trading according to the WM pattern "Sniper" strategy !!! Features Marks the place of price reversal during the formation of a new fractal with specified parameters. Suitable for al
"The Squeeze indicator attempts to identify periods of consolidation in a market. In general the market is either in a period of quiet consolidation or vertical price discovery. By identifying these calm periods, we have a better opportunity of getting into trades with the potential for larger moves. Once a market enters into a "squeeze," we watch the overall market momentum to help forecast the market direction and await a release of market energy." The StdATR Squeeze Channel combines standard
Spread and Close MT4
Alexander Denisovich Jegorov
Spread & Candle Close Timer Indicator for MT4  Optimize your trading with this lightweight and efficient indicator, designed to display the real-time spread and candle close countdown directly on your MT4 chart. Features: Live Spread Monitoring – Instantly see market conditions. Candle Close Timer – Stay prepared for the next price movement. Simple & Non-Intrusive Design – No unnecessary settings, just clear and accurate data. Ideal for scalpers, day traders, and those who need real-time exec
Stepping Trend
Mpendulo Chiliza
The Stepping Trend Indicator     The Steppi ng Trend indicator uses the  average true range  (ATR indicator) in its calculation. This gives you control to set your own average true range period, I set the Default as 10.   Indicator Details. Green Arrow Up: This means you are at the starting point of a new bullish trend, it’s time to buy.   Red  Arrow  Down : This means you are at the starting point of a new  bearish  trend, it’ s time to sell .   What if you miss the Arrow Signal?   No prob
Indicatore Crypto_Forex "Morning Star pattern" per MT4. - L'indicatore "Morning Star pattern" è un indicatore molto potente per il trading Price Action: nessuna rielaborazione, nessun ritardo. - L'indicatore rileva i pattern rialzisti Morning Star sul grafico: segnale freccia blu sul grafico (vedi immagini). - Con avvisi su PC, dispositivi mobili ed e-mail. - È disponibile anche il suo fratello, l'indicatore ribassista "Evening Star pattern" (segui il link qui sotto). - L'indicatore "Morning S
Gli utenti di questo prodotto hanno anche acquistato
Gann Made Easy
Oleg Rodin
4.83 (162)
Gann Made Easy è un sistema di trading Forex professionale e facile da usare che si basa sui migliori principi del trading utilizzando la teoria di mr. WD Gann. L'indicatore fornisce segnali ACQUISTA e VENDI accurati, inclusi i livelli di Stop Loss e Take Profit. Puoi fare trading anche in movimento utilizzando le notifiche PUSH. CONTATTAMI DOPO L'ACQUISTO PER RICEVERE GRATUITAMENTE LE ISTRUZIONI DI TRADING E OTTIMI INDICATORI EXTRA! Probabilmente hai già sentito parlare molte volte dei metodi d
M1 Sniper
Oleg Rodin
5 (22)
M1 SNIPER è un sistema di indicatori di trading facile da usare. Si tratta di un indicatore a freccia progettato per l'intervallo temporale M1. L'indicatore può essere utilizzato come sistema autonomo per lo scalping sull'intervallo temporale M1 e come parte del tuo sistema di trading esistente. Sebbene questo sistema di trading sia stato progettato specificamente per il trading sull'intervallo temporale M1, può comunque essere utilizzato anche con altri intervalli temporali. Inizialmente ho pro
PRO Renko System
Oleg Rodin
5 (30)
PRO Renko System è un sistema di trading altamente accurato appositamente progettato per il trading di grafici RENKO. Questo è un sistema universale che può essere applicato a vari strumenti di trading. Il sistema neutralizza efficacemente il cosiddetto rumore di mercato che consente di accedere a segnali di inversione accurati. L'indicatore è molto facile da usare e ha un solo parametro responsabile della generazione del segnale. Puoi facilmente adattare lo strumento a qualsiasi strumento di
Advanced Supply Demand
Bernhard Schweigert
4.91 (299)
Speciale Trading- SCONTO DEL 40% La soluzione migliore per qualsiasi trader principiante o esperto! Questo indicatore è uno strumento di trading unico, di alta qualità e conveniente, perché abbiamo incorporato una serie di funzionalità proprietarie e una nuova formula. Con questo aggiornamento, potrai visualizzare doppie zone di timeframe. Non solo potrai visualizzare un TF più alto, ma anche entrambi, il TF del grafico e il TF più alto: MOSTRA ZONE ANNIDATE. Tutti i trader che operano con Of
Market Makers
Mohamed Hassan
5 (3)
After purchase, contact me privately to receive 1 month of free testing with EA Forex Proton! This advanced MT4 trading robot automatically executes signals from any MT4 indicator, including Market Makers. The latest version also includes AI integration, allowing each trade signal to be analyzed using Artificial Intelligence. Live Signal with EA Forex Proton: Click here Market Makers is a powerful price action trading system designed to identify high-probability Buy and Sell opportunities based
Trend Screener
STE S.S.COMPANY
4.79 (95)
Indicatore di tendenza, soluzione unica rivoluzionaria per il trading di tendenze e il filtraggio con tutte le importanti funzionalità di tendenza integrate in un unico strumento! È un indicatore multi-timeframe e multi-valuta al 100% non ridipingibile che può essere utilizzato su tutti i simboli/strumenti: forex, materie prime, criptovalute, indici e azioni. OFFERTA A TEMPO LIMITATO: l'indicatore di screening di supporto e resistenza è disponibile a soli 65$ e a vita. (Prezzo originale 250$) (o
Segnale GoldRush Trend Arrow L'indicatore GoldRush Trend Arrow Signal fornisce un'analisi precisa e in tempo reale dei trend, pensata appositamente per gli scalper ad alta velocità e a breve termine nel mercato XAU/USD. Progettato specificamente per il timeframe di 1 minuto, questo strumento mostra frecce direzionali che indicano chiari punti di ingresso, consentendo agli scalper di navigare con sicurezza nelle condizioni di mercato volatili. L'indicatore è composto da frecce di avviso PRIMA
NAM Divergences
NAM TECH GROUP, CORP.
5 (1)
MT4 Multi-timeframe Divergence and Overbougt/Oversold detection indicator. Features - Fully customizable on chart control panel, provides complete interaction. - Hide and show control panel wherever you want. - Real time information about non-capitalized divergences. - Real time information about overbougt / oversold situations. - Real time information about regular divergences. - Real time information about hidden divergences. - Oscillators available for divergences detection: AO, RSI, CCI, MA
Super Signal – Skyblade Edition Sistema professionale di segnali di tendenza senza repaint / senza ritardo con tasso di vincita eccezionale | Per MT4 / MT5 Funziona meglio su timeframe più bassi, come 1 minuto, 5 minuti e 15 minuti. Caratteristiche principali: Super Signal – Skyblade Edition è un sistema intelligente di segnali progettato specificamente per il trading di tendenza. Utilizza una logica di filtraggio multilivello per identificare esclusivamente i movimenti direzionali forti, supp
L'indicatore " Dynamic Scalper System " è progettato per il metodo di scalping, ovvero per il trading all'interno di onde di trend. Testato sulle principali coppie di valute e sull'oro, è compatibile con altri strumenti di trading. Fornisce segnali per l'apertura di posizioni a breve termine lungo il trend, con ulteriore supporto al movimento dei prezzi. Il principio dell'indicatore. Le frecce grandi determinano la direzione del trend. Un algoritmo per generare segnali per lo scalping sotto fo
Auto Optimized Parabolic RSI: Motore di Momentum 3D Avanzato La maggior parte degli indicatori per trader privati fallisce perché si affida a parametri statici che smettono di funzionare nel momento in cui la volatilità del mercato cambia. Auto Optimized Parabolic RSI risolve il problema dell'"obsolescenza dell'indicatore" ricalcolando continuamente il proprio vantaggio matematico, portando un adattamento quantitativo di livello istituzionale direttamente sul tuo terminale MT5. Il Vantaggio Prin
Scalper Inside PRO
Alexey Minkov
4.74 (69)
Scalper Inside PRO – Since 2020. An exclusive indicator that utilizes an innovative algorithm to swiftly and accurately determine the market trend. The indicator automatically calculates opening, closing, and profit levels, providing detailed trading statistics. With these features, you can choose the most appropriate trading instrument for the current market conditions. Additionally, you can easily integrate your own arrow indicators into Scalper Inside Pro to quickly evaluate their statistics
Apollo SR Master è un indicatore di Supporto/Resistenza con caratteristiche speciali che rendono il trading con le zone di Supporto/Resistenza più semplice e affidabile. L'indicatore calcola le zone di Supporto/Resistenza in tempo reale senza alcun ritardo, rilevando i massimi e i minimi dei prezzi locali. Quindi, per confermare la nuova area SR formata, l'indicatore mostra un segnale speciale che segnala che la zona SR può essere presa in considerazione e utilizzata come un vero e proprio segna
ATTUALMENTE SCONTATO DEL 40% La soluzione migliore per ogni principiante o trader esperto! Questo indicatore è uno strumento di trading unico, di alta qualità e conveniente perché abbiamo incorporato una serie di caratteristiche proprietarie e una nuova formula. Con un solo grafico è possibile leggere la forza delle valute per 28 coppie Forex! Immaginate come migliorerà il vostro trading perché sarete in grado di individuare l'esatto punto di innesco di una nuova tendenza o di un'opportunità
Ultimate Sniper Dashboard
Hispraise Chinedum Abraham
4.82 (22)
Scontato a 299 dollari! I prezzi potrebbero aumentare in futuro! Leggi la descrizione qui sotto! Il miglior sistema di ingresso per la plancia Ultimate Sniper: LIVELLI DINAMICI FINALI. (Si prega di controllare i miei prodotti) L'Ultimate Sniper Dashboard funziona SOLO sui mercati live a causa dei limiti di test della MT4 multicurrency. Vi presentiamo l'Ultimate Sniper Dashboard! Il nostro migliore che contiene sia HA-Sniper, MA-Sniper e molte modalità speciali. Il cruscotto Ultimate Sniper è
Currency Strength Wizard è un indicatore molto potente che ti fornisce una soluzione all-in-one per un trading di successo. L'indicatore calcola la potenza di questa o quella coppia forex utilizzando i dati di tutte le valute su più intervalli di tempo. Questi dati sono rappresentati in una forma di indice di valuta facile da usare e linee elettriche di valuta che puoi utilizzare per vedere il potere di questa o quella valuta. Tutto ciò di cui hai bisogno è collegare l'indicatore al grafico che
Atomic Analyst
Issam Kassas
5 (5)
Innanzitutto, vale la pena sottolineare che questo indicatore di trading non è repaint, non è ridisegno e non presenta ritardi, il che lo rende ideale sia per il trading manuale che per quello automatico. Manuale utente: impostazioni, input e strategia. L'Analista Atomico è un indicatore di azione del prezzo PA che utilizza la forza e il momentum del prezzo per trovare un miglior vantaggio sul mercato. Dotato di filtri avanzati che aiutano a rimuovere rumori e segnali falsi, e aumentare il pote
BTMM State Engine Pro is a MetaTrader 4 indicator for traders who use the Beat The Market Maker approach: Asian session context, kill zone timing, level progression, peak formation detection, and a multi-pair scanner from a single chart. It combines cycle state logic with a built-in scanner dashboard so you do not need the same tool on many charts at once. What it does Draws the Asian session range; session times can follow broker server offset or be set in inputs. Tracks level progression (L
Smetti di indovinare. Inizia a fare trading con un vantaggio statistico. Gli indici azionari non si negoziano come il forex. Hanno sessioni definite, gap notturni e seguono pattern statistici prevedibili. Questo indicatore ti fornisce i dati di probabilità di cui hai bisogno per fare trading su indici come DAX, S&P 500 e Dow Jones con fiducia. Cosa lo rende diverso La maggior parte degli indicatori ti mostra cosa è successo. Questo ti mostra cosa probabilmente succederà dopo. Ogni giorno di trad
KT Alpha Hunter Arrows MT4
KEENBASE SOFTWARE SOLUTIONS
La maggior parte degli indicatori a frecce ti dà un segnale e poi ti lascia capire da solo tutto il resto. KT Alpha Hunter Arrows ti offre un piano di trading completo. Ogni freccia di segnale viene visualizzata con un piano già tracciato: linea di ingresso, stop loss, quattro livelli di take profit e un verdetto edge in tempo reale che ti indica se quel simbolo e quel timeframe meritano di essere tradati in quel momento. Il pacchetto include un Trade Manager EA che gestisce l’esecuzione dopo il
Dynamic Forex28 Navigator
Bernhard Schweigert
4.43 (7)
Dynamic Forex28 Navigator - Lo strumento di trading Forex di nuova generazione. ATTUALMENTE SCONTATO DEL 49%. Dynamic Forex28 Navigator è l'evoluzione dei nostri indicatori popolari di lunga data, che combinano la potenza di tre in uno: Advanced Currency Strength28 Indicator (695 recensioni) + Advanced Currency IMPULSE con ALERT (520 recensioni) + CS28 Combo Signals (Bonus). Dettagli sull'indicatore https://www.mql5.com/en/blogs/post/758844 Cosa offre l'indicatore di forza di nuova generazione?
ATTUALMENTE SCONTATO DEL 40%! La soluzione migliore per ogni principiante o trader esperto! Questo indicatore è uno strumento di trading unico, di alta qualità e conveniente perché abbiamo incorporato una serie di caratteristiche proprietarie e una formula segreta. Con un solo grafico fornisce avvisi per tutte le 28 coppie di valute. Immaginate come migliorerà il vostro trading perché sarete in grado di individuare l'esatto punto di innesco di una nuova tendenza o opportunità di scalping! Co
- Real price is 80$ - 50% Discount (It is 39$ now) - just for 2 purchases. Contact me for instruction, add group and any questions! - Non-repaint - I just sell my products in Elif Kaya profile, any other websites are stolen old versions, So no any new updates or support. - Lifetime update free Related product:   Bitcoin Expert Introduction The breakout and retest strategy is traded support and resistance levels. it involves price breaking through a previous level.  The break and retest strateg
FX Volume
Daniel Stein
4.63 (38)
FX Volume: Scopri il Vero Sentimento di Mercato dalla Prospettiva di un Broker Panoramica Rapida Vuoi portare la tua strategia di trading a un livello superiore? FX Volume ti offre informazioni in tempo reale su come i trader retail e i broker sono posizionati—molto prima che compaiano report in ritardo come il COT. Che tu miri a guadagni costanti o desideri semplicemente un vantaggio più solido sui mercati, FX Volume ti aiuta a individuare grandi squilibri, confermare i breakout e perfezionar
TPSpro RFI Levels
Roman Podpora
4.86 (28)
ISTRUZIONI RUS  /  ISTRUZIONI   ENG  /  Versione MT5 Funzioni principali: Visualizza le zone attive di venditori e acquirenti! L'indicatore mostra tutti i livelli/zone di primo impulso corretti per acquisti e vendite. Quando questi livelli/zone vengono attivati, ovvero dove inizia la ricerca dei punti di ingresso, i livelli cambiano colore e vengono riempiti con colori specifici. Vengono visualizzate anche delle frecce per una percezione più intuitiva della situazione. LOGIC AI - Visualizzazion
Cycle Sniper
Elmira Memish
4.39 (36)
Please contact us after your purchase and we will send you the complimentary indicators to complete the system Cycle Sniper is not a holy grail but when you use it in a system which is explained in the videos, you will feel the difference. If you are not willing to focus on the charts designed with Cycle Sniper and other free tools we provide, we recommend not buying this indicator. We recommend watching the videos about the indiactor and system before purchasing. Videos, settings  and descri
Documentation for connecting Metatrader 4 with Python with a simple drag and drop EA.   A full end-to-end solution ,fully tested ,fast and efficient! The Pytrader ecosystem consists of a python script and a MT4 EA. (  MT5  version ) Further for the licensing an indicator is used.  The communication between the python script and the EA is based on sockets. EA is the  Server   and the python script the  Client .  It is always query(function / python script) and output(data / server). The EA doe
Route Lines Prices - è un indicatore progettato per individuare le direzioni di prezzo. La sua interfaccia semplice contiene diversi algoritmi per il calcolo del comportamento dei prezzi e della direzione futura. Questi algoritmi includono il calcolo della volatilità e lo smussamento dei prezzi in base ai timeframe utilizzati. L'indicatore ha un singolo parametro per modificare il valore di " Calculating price values ". Il valore predefinito di 1 fornisce un calcolo automatico bilanciato, che p
Volatility Trend System - un sistema di trading che fornisce segnali per le voci. Il sistema di volatilità fornisce segnali lineari e puntuali nella direzione del trend, nonché segnali per uscirne, senza ridisegnare e ritardi. L'indicatore di tendenza monitora la direzione della tendenza a medio termine, mostra la direzione e il suo cambiamento. L'indicatore di segnale si basa sui cambiamenti della volatilità e mostra gli ingressi nel mercato. L'indicatore è dotato di diversi tipi di avvisi. Pu
Stratos Pali
Michela Russo
4.43 (7)
Stratos Pali Indicator   is a revolutionary tool designed to enhance your trading strategy by accurately identifying market trends. This sophisticated indicator uses a unique algorithm to generate a complete histogram, which records when the trend is Long or Short. When a trend reversal occurs, an arrow appears, indicating the new direction of the trend. Important Information Revealed Leave a review and contact me via mql5 message to receive My Top 5 set files for Stratos Pali at no cost! Dow
Altri dall’autore
Volumatic VIDyA MT4
Duc Hoan Nguyen
4.5 (4)
Special offer : ALL TOOLS , just $35 each! New tools   will be   $30   for the   first week   or the   first 3 purchases !  Trading Tools Channel on MQL5 : Join my MQL5 channel to update the latest news from me Volumatic VIDYA (Variable Index Dynamic Average) è un indicatore avanzato progettato per monitorare le tendenze e analizzare la pressione di acquisto e vendita in ogni fase di una tendenza. Utilizzando il Variable Index Dynamic Average come tecnica principale di smorzamento dinamico, que
Special offer : ALL TOOLS , just $35 each! New tools   will be   $30   for the   first week   or the   first 3 purchases !  Trading Tools Channel on MQL5 : Join my MQL5 channel to update the latest news from me L'indicatore Volumetric Order Blocks Multi Timeframe è uno strumento potente progettato per i trader che cercano approfondimenti sul comportamento del mercato identificando le aree di prezzo chiave dove i partecipanti significativi accumulano ordini. Queste aree, note come blocchi d'ordi
Special offer : ALL TOOLS , just $35 each! New tools   will be   $30   for the   first week   or the   first 3 purchases !  Trading Tools Channel on MQL5 : Join my MQL5 channel to update the latest news from me Presentiamo il SuperTrend ATR Multiplier with Scanner for MT5 – uno strumento versatile e potente progettato per aiutarti a essere sempre un passo avanti alle tendenze di mercato, con funzionalità personalizzabili e avvisi in tempo reale. Basato sulla logica comprovata del SuperTrend di
FREE
Special offer : ALL TOOLS , just $35 each! New tools   will be   $30   for the   first week   or the   first 3 purchases !  Trading Tools Channel on MQL5 : Join my MQL5 channel to update the latest news from me Cominciamo con le caratteristiche eccezionali: L'EA è dotato di un FILTRO NOTIZIE e di un FILTRO RSI. Basso rischio (alcune coppie di valute hanno un DrawDown <10%, persino del 5%). Questo EA non utilizza alcuna funzione di martingala o griglia. L'EA può visualizzare zone visive per il t
Supertrend Fakeout MT5
Duc Hoan Nguyen
5 (4)
Special offer : ALL TOOLS , just $35 each! New tools   will be   $30   for the   first week   or the   first 3 purchases !  Trading Tools Channel on MQL5 : Join my MQL5 channel to update the latest news from me L'indicatore Supertrend Fakeout è una versione migliorata del classico indicatore Supertrend , progettata per fornire segnali di tendenza più affidabili. Integrando funzionalità avanzate come Fakeout Index Limit e Fakeout ATR Mult , questo indicatore aiuta a filtrare i falsi segnali di i
FREE
Special offer : ALL TOOLS , just $35 each! New tools   will be   $30   for the   first week   or the   first 3 purchases !  Trading Tools Channel on MQL5 : Join my MQL5 channel to update the latest news from me L'indicatore Liquidity Pools è uno strumento avanzato che identifica e segna potenziali zone di liquidità sul grafico analizzando aree di massimo e minimo con frequenti tocchi di stoppino, insieme al numero di rivisitazioni e al volume scambiato all'interno di ciascuna zona. Questo strum
Special offer : ALL TOOLS , just $35 each! New tools   will be   $30   for the   first week   or the   first 3 purchases !  Trading Tools Channel on MQL5 : Join my MQL5 channel to update the latest news from me Nell'ambiente in continua evoluzione del trading finanziario, identificare e analizzare accuratamente i livelli di supporto e resistenza è essenziale per prendere decisioni di investimento informate. SnR Retest and Break Multi-Timeframe è un indicatore di supporto e resistenza progettato
Special offer : ALL TOOLS , just $35 each! New tools   will be   $30   for the   first week   or the   first 3 purchases !  Trading Tools Channel on MQL5 : Join my MQL5 channel to update the latest news from me Massimizza il tuo vantaggio nel trading con Follow Line MT5 con Scanner, un indicatore avanzato basato sulla volatilità progettato per trader seri. Questo strumento combina la potenza delle Bande di Bollinger con impostazioni personalizzabili, offrendo intuizioni precise sui movimenti de
FREE
Special offer : ALL TOOLS , just $35 each! New tools   will be   $30   for the   first week   or the   first 3 purchases !  Trading Tools Channel on MQL5 : Join my MQL5 channel to update the latest news from me L'indicatore Volumetric Order Blocks Multi Timeframe è uno strumento potente progettato per i trader che cercano approfondimenti sul comportamento del mercato identificando le aree di prezzo chiave dove i partecipanti significativi accumulano ordini. Queste aree, note come blocchi d'ordi
OA SnR Power MT5
Duc Hoan Nguyen
5 (3)
Special offer : ALL TOOLS , just $35 each! New tools   will be   $30   for the   first week   or the   first 3 purchases !  Trading Tools Channel on MQL5 : Join my MQL5 channel to update the latest news from me Panoramica OA SnR Power è uno strumento potente progettato per aiutare i trader a identificare e valutare la forza dei livelli di supporto e resistenza. Integrando fattori chiave come il volume di trading, la frequenza dei rimbalzi e il numero di test, questo indicatore offre una vision
FREE
Special offer : ALL TOOLS , just $35 each! New tools   will be   $30   for the   first week   or the   first 3 purchases !  Trading Tools Channel on MQL5 : Join my MQL5 channel to update the latest news from me Trendlines with Breaks Scanner è uno strumento di trading all’avanguardia progettato per aiutare i trader a identificare tendenze critiche e rilevare rotture in tempo reale. Con linee di tendenza generate automaticamente basate su punti pivot, questo indicatore consente ai trader di cogl
Volumatic VIDyA MT5
Duc Hoan Nguyen
5 (2)
Special offer : ALL TOOLS , just $35 each! New tools   will be   $30   for the   first week   or the   first 3 purchases !  Trading Tools Channel on MQL5 : Join my MQL5 channel to update the latest news from me Volumatic VIDYA (Variable Index Dynamic Average) è un indicatore avanzato progettato per monitorare le tendenze e analizzare la pressione di acquisto e vendita in ogni fase di una tendenza. Utilizzando il Variable Index Dynamic Average come tecnica principale di smorzamento dinamico, que
Supertrend Fakeout MT4
Duc Hoan Nguyen
4.25 (4)
Special offer : ALL TOOLS , just $35 each! New tools   will be   $30   for the   first week   or the   first 3 purchases !  Trading Tools Channel on MQL5 : Join my MQL5 channel to update the latest news from me L'indicatore Supertrend Fakeout è una versione migliorata del classico indicatore Supertrend , progettata per fornire segnali di tendenza più affidabili. Integrando funzionalità avanzate come Fakeout Index Limit e Fakeout ATR Mult , questo indicatore aiuta a filtrare i falsi segnali di i
FREE
Special offer : ALL TOOLS , just $35 each! New tools   will be   $30   for the   first week   or the   first 3 purchases !  Trading Tools Channel on MQL5 : Join my MQL5 channel to update the latest news from me Nell’attuale panorama di trading finanziario caratterizzato da elevata volatilità, identificare con precisione i livelli di supporto e resistenza è fondamentale affinché i trader possano prendere decisioni informate. Predictive Ranges Scanner Multi-TF è uno strumento avanzato progettato
Special offer : ALL TOOLS , just $35 each! New tools   will be   $30   for the   first week   or the   first 3 purchases !  Trading Tools Channel on MQL5 : Join my MQL5 channel to update the latest news from me L'indicatore del modello di inversione a tre barre offre uno strumento potente per i trader, identificando e evidenziando automaticamente i modelli di inversione a tre barre direttamente sul grafico dei prezzi. Questo indicatore è una risorsa preziosa per individuare potenziali inversion
Liquidity Pools MT4
Duc Hoan Nguyen
5 (1)
Special offer : ALL TOOLS , just $35 each! New tools   will be   $30   for the   first week   or the   first 3 purchases !  Trading Tools Channel on MQL5 : Join my MQL5 channel to update the latest news from me L'indicatore Liquidity Pools è uno strumento avanzato che identifica e segna potenziali zone di liquidità sul grafico analizzando aree di massimo e minimo con frequenti tocchi di stoppino, insieme al numero di rivisitazioni e al volume scambiato all'interno di ciascuna zona. Questo strum
Offerta speciale : ALL TOOLS , solo $35 ciascuno! New tools   will be   $30   for the   first week   or the   first 3 purchases !  Trading Tools Channel on MQL5 : Join my MQL5 channel to update the latest news from me In un ambiente di trading volatile, uno strumento di analisi potente e intuitivo può aiutarti a cogliere rapidamente le opportunità. Fibonacci Trend Scanner non solo integra le funzioni tradizionali dell’indicatore Fibonacci e SuperTrend, ma amplia anche le funzionalità con la sca
Special offer : ALL TOOLS , just $35 each! New tools   will be   $30   for the   first week   or the   first 3 purchases !  Trading Tools Channel on MQL5 : Join my MQL5 channel to update the latest news from me Kalman Trend Levels è un indicatore avanzato di follow-up delle tendenze che utilizza la tecnologia all'avanguardia dei filtri di Kalman per fornire ai trader segnali analitici potenti. Progettato per precisione e adattabilità, questo strumento non solo identifica zone critiche di suppor
Special offer : ALL TOOLS , just $35 each! New tools   will be   $30   for the   first week   or the   first 3 purchases !  Trading Tools Channel on MQL5 : Join my MQL5 channel to update the latest news from me Trendlines with Breaks Scanner è uno strumento di trading all’avanguardia progettato per aiutare i trader a identificare tendenze critiche e rilevare rotture in tempo reale. Con linee di tendenza generate automaticamente basate su punti pivot, questo indicatore consente ai trader di cogl
Special offer : ALL TOOLS , just $35 each! New tools   will be   $30   for the   first week   or the   first 3 purchases !  Trading Tools Channel on MQL5 : Join my MQL5 channel to update the latest news from me Indicatore di Canale di Regressione Lineare è un potente strumento di analisi tecnica che aiuta i trader a identificare trend di prezzo e potenziali punti di inversione. Calcolando e visualizzando canali di regressione lineare, bande e proiezioni future, questo indicatore offre una prosp
RSI Divergence MT5 Scanner
Duc Hoan Nguyen
3.33 (3)
Special offer : ALL TOOLS , just $35 each! New tools   will be   $30   for the   first week   or the   first 3 purchases !  Trading Tools Channel on MQL5 : Join my MQL5 channel to update the latest news from me Nei mercati finanziari dinamici, identificare i segnali di inversione di tendenza è essenziale per un trading efficace. L'RSI Divergence Scanner è progettato per aiutarti a rilevare segnali di divergenza RSI su varie coppie di valute e timeframe in modo accurato ed efficiente. Vedi più v
FREE
AI Channels MT4
Duc Hoan Nguyen
5 (1)
Special offer : ALL TOOLS , just $35 each! New tools   will be   $30   for the   first week   or the   first 3 purchases !  Trading Tools Channel on MQL5 : Join my MQL5 channel to update the latest news from me L'indicatore AI Channels utilizza il clustering K-means mobile —una potente tecnica di apprendimento automatico nell'analisi dei cluster—per fornire intuizioni in tempo reale sulle tendenze di prezzo sottostanti. Questo indicatore crea canali adattivi basati su dati di prezzo raggruppati
FREE
AI Channels MT5
Duc Hoan Nguyen
5 (1)
Special offer : ALL TOOLS , just $35 each! New tools   will be   $30   for the   first week   or the   first 3 purchases !  Trading Tools Channel on MQL5 : Join my MQL5 channel to update the latest news from me L'indicatore AI Channels utilizza il clustering K-means mobile —una potente tecnica di apprendimento automatico nell'analisi dei cluster—per fornire intuizioni in tempo reale sulle tendenze di prezzo sottostanti. Questo indicatore crea canali adattivi basati su dati di prezzo raggruppati
FREE
Special offer : ALL TOOLS , just $35 each! New tools   will be   $30   for the   first week   or the   first 3 purchases !  Trading Tools Channel on MQL5 : Join my MQL5 channel to update the latest news from me Massimizza il tuo vantaggio nel trading con Follow Line con Scanner, un indicatore avanzato basato sulla volatilità progettato per trader seri. Questo strumento combina la potenza delle Bande di Bollinger con impostazioni personalizzabili, offrendo intuizioni precise sui movimenti dei pr
FREE
Special offer : ALL TOOLS , just $35 each! New tools   will be   $30   for the   first week   or the   first 3 purchases !  Trading Tools Channel on MQL5 : Join my MQL5 channel to update the latest news from me Nei mercati finanziari dinamici, identificare i segnali di inversione di tendenza è essenziale per un trading efficace. L'RSI Divergence Scanner è progettato per aiutarti a rilevare segnali di divergenza RSI su varie coppie di valute e timeframe in modo accurato ed efficiente. Vedi più v
FREE
Special offer : ALL TOOLS , just $35 each! New tools   will be   $30   for the   first week   or the   first 3 purchases !  Trading Tools Channel on MQL5 : Join my MQL5 channel to update the latest news from me Presentiamo il SuperTrend by Kivanc Ozbilgic with Scanner – uno strumento versatile e potente progettato per aiutarti a essere sempre un passo avanti alle tendenze di mercato, con funzionalità personalizzabili e avvisi in tempo reale.  Puoi regolare il metodo di calcolo dell' ATR tra RMA
FREE
Special offer : ALL TOOLS , just $35 each! New tools   will be   $30   for the   first week   or the   first 3 purchases !  Trading Tools Channel on MQL5 : Join my MQL5 channel to update the latest news from me Il Fibonacci Confluence Toolkit Multi-Timeframe è uno strumento avanzato di analisi tecnica progettato per trader professionisti, che aiuta a identificare potenziali zone di inversione del prezzo combinando segnali e modelli chiave del mercato. Con capacità di visualizzazione multi-timef
Special offer : ALL TOOLS , just $35 each! New tools   will be   $30   for the   first week   or the   first 3 purchases !  Trading Tools Channel on MQL5 : Join my MQL5 channel to update the latest news from me SMC è un approccio al trading che aiuta i trader a identificare le zone di liquidità, le posizioni istituzionali degli ordini e i principali punti di svolta del mercato. Sfruttando i principi SMC, i trader possono navigare nel mercato in modo più efficace, trovando punti di ingresso e us
Special offer : ALL TOOLS , just $35 each! New tools   will be   $30   for the   first week   or the   first 3 purchases !  Trading Tools Channel on MQL5 : Join my MQL5 channel to update the latest news from me Panoramica OA SnR Power è uno strumento potente progettato per aiutare i trader a identificare e valutare la forza dei livelli di supporto e resistenza. Integrando fattori chiave come il volume di trading, la frequenza dei rimbalzi e il numero di test, questo indicatore offre una vision
FREE
Special offer : ALL TOOLS , just $35 each! New tools   will be   $30   for the   first week   or the   first 3 purchases !  Trading Tools Channel on MQL5 : Join my MQL5 channel to update the latest news from me Nell'ambiente in continua evoluzione del trading finanziario, identificare e analizzare accuratamente i livelli di supporto e resistenza è essenziale per prendere decisioni di investimento informate. SnR Retest and Break Multi-Timeframe è un indicatore di supporto e resistenza progettato
Filtro:
Nessuna recensione
Rispondi alla recensione