Pro RSI Scanner Dashboard OB OS All Pair Timeframe

Overview
The RSI Scanner Dashboard is a comprehensive technical analysis utility and multi-symbol, multi-timeframe monitoring indicator designed for the MetaTrader terminal. The primary objective of this tool is to scan market instruments continuously to identify specific Relative Strength Index (RSI) crossover conditions based on defined overbought and oversold thresholds. By aggregating data across user-defined currency pairs and timeframes into a single graphical user interface (GUI), this dashboard eliminates the necessity of manual chart switching. It acts strictly as an analytical tool that calculates entry parameters, structural stop-loss levels utilizing the Average True Range (ATR), and multiple take-profit targets based on configurable risk-to-reward ratios. The software is built for traders who require structured mathematical filtering and a systematic approach to market scanning.

Operating Principle
The core algorithm relies on the Relative Strength Index (RSI) oscillator to determine market momentum. The system scans historical price data specifically on closed bars (Bar 1 and previously closed bars up to the defined lookback limit) to ensure the foundational entry signals are strictly non-repainting. A BUY signal is triggered when the RSI value crosses above the defined Oversold threshold from below, indicating potential upward momentum following a downward exhaustion phase. A SELL signal is generated when the RSI line crosses below the Overbought threshold from above, identifying potential downward momentum after an upward exhaustion phase. Once a core signal is detected, the dashboard calculates dynamic risk management levels. The Stop Loss (SL) is computed by extracting the ATR value at the signal bar, multiplied by a user-defined coefficient, and applied to the entry price. The Take Profit 1 (TP1) and Take Profit 2 (TP2) levels are determined by applying explicit risk-to-reward multipliers to the computed SL distance, ensuring strict mathematical proportionality for every generated setup.

Key Features
- Multi-Symbol and Multi-Timeframe Scanning: Capable of analyzing multiple instruments and timeframes concurrently within a single chart window.
- Extensive Multi-Filter Validation: Features 14 independent technical filters (including ADX, Moving Averages, Ichimoku, Awesome Oscillator, Parabolic SAR, Heiken Ashi, CCI, RVI, MACD, Support/Resistance, and Fibonacci) that can be individually toggled to validate or discard the core RSI signals.
- Dynamic On-Chart Projections: Automatically plots the historical entry level, Stop Loss, and Take Profit lines directly on the active chart to visualize the structural setup.
- Interactive Graphical Interface: An integrated, draggable panel displaying real-time data columns including Pair, Timeframe, Signal Direction, Signal Age, Entry Price, SL, TP levels, and the exact RSI value. Includes one-click buttons to instantly open the specific chart and timeframe of a generated signal.
- Comprehensive Notification System: Equipped with localized sound alerts, terminal pop-ups, push notifications to MetaTrader mobile applications, and email routing capabilities.

Operation / Setup Recommendations
- Supported Instruments: Designed for major and minor currency pairs (e.g., EURUSD, GBPUSD, USDJPY) and highly liquid commodities like XAUUSD. Before deploying on exotic pairs, evaluate the average spread characteristics.
- Supported Timeframes: Fully operational across all standard MT4/MT5 timeframes. Intraday configurations are recommended on M15, M30, and H1, while macro-structural analysis performs optimally on H4 and D1.
- Execution Environment: A low-latency VPS is recommended if the notification system (Push/Email) is heavily utilized. 
- Performance Optimization: When utilizing the dashboard on lower specification hardware, strictly limit the 'InpMaxSymbols' and reduce the 'InpBarsCopy' parameter to minimize CPU and memory consumption during the real-time background scanning processes.
- Repainting Disclosure: All core RSI signals and standard oscillator/moving average filters evaluate data on Bar 1 (Closed Candle) and are non-repainting. However, please explicitly note that if the 'Fibonacci Filter' is activated, it utilizes a structural ZigZag dynamic algorithm. The ZigZag swing points can recalculate based on future price development; therefore, the Fibonacci validation component inherently possesses repainting characteristics by mathematical design.

Input Parameters List
Scanner Settings
InpSymbols (Default: "EURUSD,GBPUSD,USDJPY,AUDUSD,USDCAD,USDCHF,NZDUSD,EURJPY,GBPJPY,XAUUSD") -> Specifies the string of financial instruments to monitor, separated by commas. Leave empty to use the Market Watch list.
InpTimeframes (Default: "M1,M5,M15,M30,H1,H4,D1") -> Specifies the timeframes to scan, separated by commas.
InpUseWatch (Default: true) -> If set to true, forces the scanner to automatically utilize all available pairs currently visible in the MetaTrader Market Watch window.
InpMaxSymbols (Default: 10) -> Defines the absolute maximum number of pairs the dashboard will load and process simultaneously to prevent memory overload.
InpScanSec (Default: 7) -> The interval time in seconds for the system timer to execute a complete market scan.
InpBarsCopy (Default: 100) -> The specific amount of historical bars downloaded and analyzed per timeframe to construct the mathematical arrays.
InpLookback (Default: 100) -> The maximum depth of historical bars the algorithm will search to identify the most recent RSI crossover signal.
InpDirection (Default: 0) -> Restricts the scanning direction. 0 allows both Buy and Sell, 1 allows Buy signals only, 2 allows Sell signals only.

RSI Entry Settings
RSI_Length (Default: 8) -> The calculation period for the core Relative Strength Index oscillator.
RSI_Price_Source (Default: PRICE_CLOSE) -> The specific applied price point (e.g., Close, Open, High, Low) utilized in the RSI formula.
Oversold (Default: 30.0) -> The lower boundary threshold that triggers a potential Buy setup upon an upward crossover.
Overbought (Default: 70.0) -> The upper boundary threshold that triggers a potential Sell setup upon a downward crossover.

ATR SL & TP Settings
InpATRPeriod (Default: 14) -> The calculation period for the Average True Range indicator used for volatility-based stop loss sizing.
InpATRMultSL (Default: 1.5) -> The coefficient multiplier applied to the ATR value to determine the final point distance for the Stop Loss.
InpTP1_RR (Default: 1.0) -> The Risk-to-Reward ratio multiplier utilized to calculate the Take Profit 1 level relative to the Stop Loss distance.
InpTP2_RR (Default: 2.0) -> The Risk-to-Reward ratio multiplier utilized to calculate the Take Profit 2 level relative to the Stop Loss distance.

Filter Mode: ADX Filter
Use_ADX_Filter (Default: false) -> Toggles the Average Directional Movement Index validation filter.
ADX_Period (Default: 10) -> The mathematical period used to calculate the ADX values.
ADX_Min_Level (Default: 20.0) -> The absolute minimum value the main ADX line must exceed for a signal to be validated as a trending market.

Filter Mode: Single MA Filter
Use_MA_Filter (Default: false) -> Toggles the singular Moving Average trend direction filter.
MA_Period (Default: 50) -> The number of bars utilized to calculate the moving average baseline.
MA_Method (Default: MODE_SMA) -> The specific smoothing method applied to the moving average (Simple, Exponential, Smoothed, or Linear Weighted).
MA_Applied (Default: PRICE_CLOSE) -> The price data applied to the moving average calculation.
MA_Shift (Default: 0) -> The horizontal bar offset shift applied to the moving average line.

Filter Mode: Ichimoku Senkou Span B Filter
Use_Ichimoku_Filter (Default: false) -> Toggles the Ichimoku Kinko Hyo cloud boundary filter.
Ichimoku_SenkouB (Default: 52) -> The period configuration for the Senkou Span B baseline calculation.
Ichimoku_Kijun (Default: 26) -> The period configuration for the Kijun-sen standard line.

Filter Mode: RSI 75 Filter
Use_RSI75_Filter (Default: false) -> Toggles a secondary, long-term Relative Strength Index filter for macro trend validation.
RSI_Filter_Period (Default: 75) -> The calculation period for this secondary RSI filter.
RSI_Filter_Price (Default: PRICE_CLOSE) -> The applied price utilized for the secondary RSI calculation.

Filter Mode: Double MA Filter
Use_DoubleMA_Filter (Default: false) -> Toggles the dual Moving Average crossover directional filter.
MA_A_Period (Default: 75) -> The calculation period for the first (typically faster) Moving Average.
MA_A_Method (Default: MODE_EMA) -> The smoothing method for the first Moving Average.
MA_A_Applied (Default: PRICE_CLOSE) -> The applied price for the first Moving Average.
MA_A_Shift (Default: 0) -> The horizontal bar offset shift for the first Moving Average.
MA_B_Period (Default: 140) -> The calculation period for the second (typically slower) Moving Average.
MA_B_Method (Default: MODE_EMA) -> The smoothing method for the second Moving Average.
MA_B_Applied (Default: PRICE_CLOSE) -> The applied price for the second Moving Average.
MA_B_Shift (Default: 0) -> The horizontal bar offset shift for the second Moving Average.

Filter Mode: Awesome Oscillator Filter
Use_AO_Filter (Default: false) -> Toggles the core Awesome Oscillator momentum filter.
Use_AO_Volume_Filter (Default: false) -> Enforces specific numerical boundary conditions on the AO histogram values.
AO_Buy_Min (Default: 4.0) -> The minimum positive histogram value required to validate a Buy signal.
AO_Sell_Max (Default: -4.0) -> The maximum negative histogram value required to validate a Sell signal.
Use_AO_Color_Filter (Default: false) -> Requires the AO histogram to be growing (Green for Buy) or shrinking (Red for Sell) relative to the previous bar.
Use_AO_Zero_Filter (Default: false) -> Requires the AO histogram to be strictly above the zero line for Buys and strictly below the zero line for Sells.

Filter Mode: Parabolic SAR Filter
Use_SAR_Filter (Default: false) -> Toggles the Parabolic Stop and Reverse trend validation filter.
SAR_Step (Default: 0.02) -> The acceleration step increment for the Parabolic SAR calculation.
SAR_Maximum (Default: 0.2) -> The absolute maximum limit for the Parabolic SAR acceleration factor.

Filter Mode: Heiken Ashi Filter
Use_HeikenAshi_Filter (Default: false) -> Requires the generated signal to align directionally with the current synthetically calculated Heiken Ashi candlestick color.

Filter Mode: CCI Trend Filter
Use_CCI_Filter (Default: false) -> Toggles the Commodity Channel Index directional trend filter.
CCI_Period (Default: 50) -> The calculation period for the macro CCI trend indicator.
CCI_Applied (Default: PRICE_CLOSE) -> The applied price for the macro CCI trend indicator.

Filter Mode: CCI OB & OS Filter
Use_CCI_OBOS_Filter (Default: false) -> Toggles a secondary Commodity Channel Index filter for overbought and oversold extreme validation.
CCI_OBOS_Period (Default: 14) -> The calculation period for the secondary extreme CCI indicator.
CCI_OBOS_Applied (Default: PRICE_CLOSE) -> The applied price for the secondary extreme CCI indicator.
CCI_Overbought (Default: 100.0) -> The upper extreme threshold required for the CCI filter validation.
CCI_Oversold (Default: -100.0) -> The lower extreme threshold required for the CCI filter validation.

Filter Mode: RVI Trend & Signal Filter
Use_RVI_Filter (Default: false) -> Toggles the Relative Vigor Index macro trend direction filter (Main line > 0 or < 0).
RVI_Period (Default: 75) -> The calculation period for the macro RVI indicator.
Use_RVI_Signal_Filter (Default: false) -> Toggles the Relative Vigor Index signal crossover validation filter (Main line vs Signal line).
RVI_Signal_Period (Default: 20) -> The calculation period for the signal-based RVI indicator.

Filter Mode: MACD Filter
Use_MACD_Filter (Default: false) -> Toggles the Moving Average Convergence Divergence histogram versus signal line validation filter.
MACD_FastEMA (Default: 12) -> The period for the fast Exponential Moving Average component.
MACD_SlowEMA (Default: 26) -> The period for the slow Exponential Moving Average component.
MACD_SignalSMA (Default: 9) -> The period for the Simple Moving Average signal line component.
MACD_Applied (Default: PRICE_CLOSE) -> The applied price for the MACD calculations.
Use_MACD_Zero_Filter (Default: false) -> Requires the MACD main line to be strictly above zero for Buys and strictly below zero for Sells.

Filter Mode: Support & Resistance Filter
Use_SR_Filter (Default: true) -> Toggles the structural Support and Resistance proximity validation filter based on historical high/low points.
SR_Period (Default: 50) -> The historical bar window length used to identify the absolute highest and lowest price points for resistance and support zones.
SR_Zone_Points (Default: 80) -> The designated buffer zone width in point values to define the acceptable proximity area near support or resistance.

Filter Mode: Fibonacci Filter
Use_Fib_Filter (Default: false) -> Toggles the structural Fibonacci retracement zone validation filter utilizing ZigZag swing points.
Fib_Level_1 (Default: 0.382) -> The first defined Fibonacci retracement boundary level limit.
Fib_Level_2 (Default: 0.618) -> The second defined Fibonacci retracement boundary level limit.
ZigZag_Depth (Default: 12) -> The minimum number of bars required to form a new ZigZag swing extremum.
ZigZag_Deviation (Default: 5) -> The minimum deviation in points required to calculate a structural trend reversal.
ZigZag_Backstep (Default: 3) -> The minimum number of bars between consecutive ZigZag local high or low points.

Alert Settings
InpAlertPopup (Default: false) -> Activates terminal dialog box pop-up messages upon signal generation.
InpAlertSound (Default: false) -> Activates audible computer sound notifications upon signal generation.
InpSoundFile (Default: "alert2.wav") -> Specifies the exact internal .wav audio file name to play for sound alerts.
InpAlertPush (Default: false) -> Dispatches push notifications to the configured MetaTrader mobile ID.
InpAlertEmail (Default: false) -> Dispatches text-based email notifications via the terminal's SMTP configuration.
InpEmailSubject (Default: "RSI Scanner Signal") -> Defines the text string used for the subject line of outgoing email alerts.
InpAlertOnlyNew (Default: false) -> Restricts the alert system to only trigger notifications for the absolute latest, newly formed signals.

Display, Size, and Sorting Settings
InpX (Default: 12) -> Horizontal X-axis coordinate pixel position for the dashboard panel.
InpY (Default: 28) -> Vertical Y-axis coordinate pixel position for the dashboard panel.
InpScale (Default: 100) -> Percentage scaling factor applied to the entire GUI panel to adjust for high-resolution displays.
InpRowH (Default: 18) -> The precise pixel height configuration for each individual row within the data table.
InpFont (Default: 8) -> The numerical size of the typography font utilized throughout the dashboard interface.
InpPadX (Default: 8) -> The pixel width dimension for the left-side internal padding margin of the dashboard.
InpWPair (Default: 68) -> Pixel width allocated for the financial Pair identification column.
InpWTF (Default: 34) -> Pixel width allocated for the Timeframe identification column.
InpWArah (Default: 44) -> Pixel width allocated for the Signal Direction indicator column.
InpWTime (Default: 96) -> Pixel width allocated for the Server Time column denoting signal creation.
InpWEntry (Default: 64) -> Pixel width allocated for the calculated Entry Price data column.
InpWSL (Default: 64) -> Pixel width allocated for the computed Stop Loss numerical column.
InpWTP1 (Default: 64) -> Pixel width allocated for the Take Profit 1 numerical column.
InpWTP2 (Default: 64) -> Pixel width allocated for the Take Profit 2 numerical column.
InpWRSI (Default: 44) -> Pixel width allocated for the exact RSI mathematical value column.
InpWUmur (Default: 42) -> Pixel width allocated for the Age column detailing elapsed time since signal generation.
InpWOpen (Default: 44) -> Pixel width allocated for the interactive one-click chart opening button.
InpShowEmpty (Default: false) -> Determines whether to render completely blank rows for symbols and timeframes that currently possess no valid signals.
InpMaxRows (Default: 18) -> Sets an absolute cap on the maximum number of data rows actively displayed on the GUI to manage vertical screen space.
InpSortBy (Default: SORT_TIME) -> Specifies the initial column data category used to systematically sort the active signals within the table structure.
InpSortNewest (Default: true) -> Specifies the directional flow of the sorting algorithm, placing the most recent temporal signals at the pinnacle of the list.

Draw Signal On Chart Settings
InpDrawOnChart (Default: true) -> Grants authorization to plot historical graphical objects directly onto the active price chart.
InpShowArrow (Default: true) -> Toggles the rendering of directional graphical arrows corresponding to the signal bar.
InpShowLevels (Default: true) -> Toggles the rendering of horizontal dashed line structural objects representing Entry, SL, TP1, and TP2 projections.
InpExtendBars (Default: 25) -> Determines the exact physical length (measured in standard chart bars) that the generated projection lines will span horizontally across the chart.
InpArrowCodeBuy (Default: 233) -> The specific internal Wingdings character code utilized to render the bullish graphical arrow.
InpArrowCodeSell (Default: 234) -> The specific internal Wingdings character code utilized to render the bearish graphical arrow.
InpArrowSize (Default: 2) -> The numerical thickness and scale multiplier utilized for rendering the signal arrows.
InpArrowDistance (Default: 15) -> The precise distance measured in point values to offset the arrow graphically from the high or low of the signal candlestick.

Color Settings
InpColBg (Default: C'18,22,28') -> Assigns the primary background hex color for the dashboard's main rectangular canvas.
InpColHead (Default: C'32,38,48') -> Assigns the primary background hex color specifically for the top header row of the table.
InpColRow (Default: C'24,28,36') -> Assigns the primary background hex color for the primary alternating data rows.
InpColRow2 (Default: C'28,33,42') -> Assigns the secondary background hex color for the secondary alternating data rows to improve contrast.
InpColText (Default: C'220,225,230') -> Assigns the primary color utilized for standard, non-directional typography elements.
InpColBull (Default: C'0,200,83') -> Assigns the specific color mapped to bullish signals, upward momentum elements, and related data strings.
InpColBear (Default: C'255,82,82') -> Assigns the specific color mapped to bearish signals, downward momentum elements, and related data strings.
InpColMute (Default: C'120,128,140') -> Assigns the muted color utilized for inactive states, empty values, or secondary text information.
InpColAccent (Default: C'41,98,255') -> Assigns the highlighted accent color for titles, active sort column headers, and primary interaction buttons.
InpColArrowBuy (Default: C'0,230,118') -> Assigns the color directly applied to the bullish chart execution arrows.
InpColArrowSell (Default: C'255,82,82') -> Assigns the color directly applied to the bearish chart execution arrows.
InpColEntry (Default: C'41,98,255') -> Assigns the line and typography color for the horizontal on-chart Entry Price projection.
InpColSL (Default: C'255,82,82') -> Assigns the line and typography color for the horizontal on-chart Stop Loss projection.
InpColTP1 (Default: C'0,200,83') -> Assigns the line and typography color for the horizontal on-chart Take Profit 1 projection.
InpColTP2 (Default: C'0,230,118') -> Assigns the line and typography color for the horizontal on-chart Take Profit 2 projection.

Risk Disclaimer
Trading foreign exchange, commodities, indices, and other financial instruments involves significant risk of capital loss and may not be suitable for all individuals or institutional investors. Past mathematical performance, historical signal accuracy, and technical backtest outcomes generated by this software do not guarantee equivalent future results. This software is rigorously designed as a purely analytical, technical, and operational assistance tool to systematically filter market conditions; it is not, under any circumstances, direct financial investment advice nor does it provide any guarantee of financial profit. Users are strongly advised and strictly instructed to thoroughly test this product extensively on a simulated virtual demo account to comprehensively understand its operational mechanics, parameter sensitivity, and filter behaviors before contemplating deployment in any live, risk-based trading environment.
Recommended products
Trend Speaker   indicator is a powerful tool designed for traders who want to easily track and analyze market trends in real-time. It provides clear, reliable buy and sell signals on the chart, making it incredibly convenient to assess the market's current trend. With its user-friendly interface, the Trend Speaker ensures you never miss a potential trading opportunity, helping you make informed decisions and enhance your trading strategy. It displays Stop Loss and Take Profit with for all BUY a
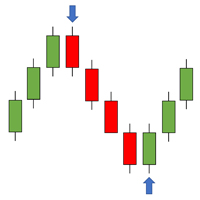
This indicator is based on the ICCI. If a long pattern is detected, the indicator displays a buy arrow. If a short pattern is detected, the indicator displays a sell arrow. Settings CCI Period - default set to (14) Features Works on all currency pairs and timeframes Draws Arrows on chart Colors Line Color Line Width Line Style Arrow Color This tool can help you analyse the market and indicates market entry.
Fixed Range Volume Profile is an MT5 volume analysis tool that calculates and displays volume distribution across any custom price and time range using standard chart trendlines for Forex, Gold (XAUUSD), Indices, and Crypto. Designed for day trading, scalping, and swing trading, this indicator automatically maps the Point of Control (POC), Value Area boundaries (VAH/VAL), and high-volume support and resistance levels without requiring manual object naming or complex setup. Core Volume Profile Ar
Dragon Bands Z
Andres Felipe Carvajal Rodriguez
Dragon Bands Z: Visual Trend Analysis Indicator Dragon Bands Z is an indicator designed to simplify chart reading through the visual consolidation of multiple technical sources. Its objective is to provide a clear indication of market direction and strength, without the need for charts cluttered with numerous individual indicators. The indicator uses a hybrid color fill to translate price action into four primary visual states: Green: Indicates a predominant upward directional force. Red: Confir
KT Auto Fibo MT5
KEENBASE SOFTWARE SOLUTIONS
5 (1)
Auto Fibonacci indicator that draws the Fibonacci retracement on the swing you are looking at, and redraws it the moment you zoom or scroll the chart. Zoom in on a pullback and the levels measure that pullback. Zoom out and they measure the whole trend. There are no anchor points to drag and no levels to redraw after every new high. Key features Measures the highest high and the lowest low on your screen, the current candle included. Follows zoom, scroll and window size at once, even when the ma
Ultimate Double Top & Bottom (Pro Volume Matrix) Stop trading retail breakouts. Start trading Institutional Traps. The   Ultimate Double Top & Bottom   is not a standard, lagging pattern scanner. It is a highly advanced, non-repainting structural engine equipped with a proprietary   3-Leg Volume Matrix . Designed exclusively for Smart Money Concepts (SMC) and order flow traders, this indicator mathematically dissects the tick volume inside M and W patterns to reveal true institutional intent:  
CISD Levels Pro automatically draws CISD Buy and Sell levels directly on your chart. It highlights pending levels while they are forming, then marks confirmed levels after the confirmation candle closes. Optional confirmation arrows help you spot the signal quickly. This tool is designed for traders who want clean, simple CISD level visualization without extra indicators or clutter. Key Features Draws Bullish (BUY) CISD levels and Bearish (SELL) CISD levels Shows Pending levels (dashed) and
ENGLISH VERSION (for MQL5 Market) Product Description: RSI Trend & Volatility Dashboard (Multi-Timeframe Filter) This professional dashboard provides traders with an ultimate market overview inside a single chart. It continuously monitors the trend direction across 5 timeframes simultaneously: M5, M15, M30, H1, and D1 [MQL5]. No more tedious chart switching or multi-window clutter – see everything from quick scalping moves to global institutional daily trends in real-time [MQL5]. Key Adva
CChart
Rong Bin Su
Overview In the fast-paced world of forex and financial markets, quick reactions and precise decision-making are crucial. However, the standard MetaTrader 5 terminal only supports a minimum of 1-minute charts, limiting traders' sensitivity to market fluctuations. To address this issue, we introduce the Second-Level Chart Candlestick Indicator , allowing you to effortlessly view and analyze market dynamics from 1 second to 30 seconds on a sub-chart. Key Features Support for Multiple Second-Level
Manzano SMC Institutional Pro Smart Money Concepts, ICT, historical statistics, market structure and liquidity analysis for MetaTrader 5. Any SMC indicator can draw zones. Manzano SMC Institutional Pro measures how those zones have performed in your market and compares their results against randomly selected price levels. See the structure. Examine the historical evidence. Understand the market context. Manzano SMC Institutional Pro combines Smart Money Concepts (SMC), ICT methodology, Market St
Introduction This indicator detects volume spread patterns for buy and sell opportunity. The patterns include demand and supply patterns. You might use each pattern for trading. However, these patterns are best used to detect the demand zone (=accumulation area) and supply zone (=distribution area). Demand pattern indicates generally potential buying opportunity. Supply pattern indicates generally potential selling opportunity. These are the underlying patterns rather than direct price action. T
Chart Alert MT5
Komang Putra Riswanjaya
Never Miss an Important Price Interaction Have you ever drawn your market analysis on a chart, only to miss an important moment when price approaches or touches your trendline, support/resistance level, zone, or other important chart object ? ChartAlert is designed to solve this problem. ChartAlert automatically detects the objects on your chart and allows you to choose which objects you want to monitor. Simply perform your analysis and draw on the chart as usual. Select the objects you want Ch
Chart Replay Indicator MT5 Overview Chart Replay Indicator is a chart replay and training tool for MetaTrader that allows users to replay historical market data bar by bar directly on the chart. It is designed for manual backtesting, strategy training, and market behavior analysis without relying on future price information. Candles are displayed progressively to reproduce the flow of historical data. This indicator does not provide trading signals and does not execute or manage trades. Key Feat
ICT Institutional Zones Pro
Celestine Anyango Wabomba
ICT Institutional Zones Pro — Trade with Institutional Precision Stop wasting time manually drawing key ICT levels every day. ICT Institutional Zones Pro is a professional-grade MT5 indicator built for traders who use ICT (Inner Circle Trader) and Smart Money Concepts (SMC) to read market structure with precision. This indicator automatically maps the most important institutional levels directly on your chart, helping you instantly identify where smart money is likely accumulating, distributing
Bid Price Timer Indicator — Precision Timing Meets Smart Price Tracking! Take your trading accuracy to the next level with the Bid Price Timer Indicator — a powerful tool designed for traders who value timing, precision, and clarity in every move. Key Features: Fixed Timer Display – Always visible on the right side of your chart (customizable X_Offset). Dynamic Price Tracking – The timer smoothly moves up and down following the Bid price in real time. Auto Repositioning – As
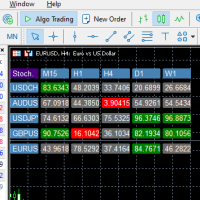
Showing like in the picture or in the logo  multiple pair, multiple timeframes, multiple indicators in the same time , allowing you to click and go straight on that pair. The indicator will change like a Carosello every 3 seconds and will show you the indicator values also by background color to check in a very fast way if its oversold or overbought . Feel free to ask for adding new pair or indicator , i will update it for free. Pair managed: EURUSD, GBPUSD, USDJPY, AUDUSD, USDCHF. Indicator man
Anchored VWAP Trading Indicator Struggling to identify true market value and key support/resistance levels? The Anchored VWAP Trading Indicator helps you track price based on real traded volume, giving you a clear edge in your trading decisions. This tool allows you to anchor VWAP from any point on the chart, making it ideal for analyzing trends, reversals, and institutional activity. Key Features Anchored VWAP from any candle Accurate volume-weighted price calculation Works on all symbol
Fibo Shadow
Robby Suhendrawan
Fibo Shadow (FISH) – The Precision Entry & Zero Floating Indicator for MT5 Master the Art of Precision Trading with Fibo Shadow. Are you tired of guessing where to enter the market? Do you struggle with wide Stop Losses and missing the "perfect" entry? Meet Fibo Shadow (FISH) , a professional-grade indicator designed to automate the process of finding high-probability Fibonacci retracement entries. Fibo Shadow isn’t just another Fibonacci tool; it is a dynamic price action engine that identifies
Session Kill zones with panel for quick changes. Asia Killzone London Killzone New York Killzone London Close Killzone In this indicator GMT+2 timings are used that are most common among many brokers. read the image attached in the screenshots to know more about sessions adjustments Session timings can be changed according to your broker timings and day light savings. Thank you :) Always open to feedback and criticism if it helps me provide you more value. - Rahul  My other indicators you may l
BeST Trend Exploiter MT5
Eleni Koulocheri
5 (1)
BeST_Trend Exploiter  is a Metatrader Indicator  based on a smart proprietary algorithm which can detect the market Median Trend while it filters out the noise providing Buy and Sell Signals and also wherever it is applicable it provides us with TP Levels of High Probability. Additionally as it has Built Inside all the necessary features it can be used as a Complete Strategy of very Impressive Results. Essential Advantages of the Indicator Clear and Easily Understandable trading rules. Real Ti
Xtrade Trend Detector
Dago Elkana Samuel Dadie
Xtrade Trend Detector is an indicator capable of finding the best opportunities to take a position in any stock market. Indeed, it is a great tool for scalpers but also for Daytraders. You could therefore use it to identify areas to trade, it fits easily on a chart. I use it to detect trends on Big timeframes and take positions on Small timeframes. Don't hesitate to give me a feedback if you test it.
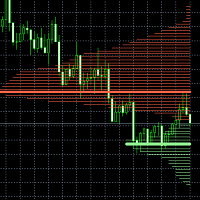
This easy to setup indicator shows you the market volumes in a different way, with support and resistance as showed. You can setup: - Backdays volume to show - Heiken Ashi candle view It works for every kind of graph and every kind of period. The program shows the volumes based on the number of candles displayed in the chart: the more candles the more volumes. Enjoy this very useful indicator. Please feel free to message me to report any kind of improvements! :D
ADAPTIVE REGIME DASHBOARD — professional multi-symbol market state scanner with real-time regime alerts. Most indicators answer "buy or sell?". This one answers the two questions professionals ask first: 1) WHAT is this market doing right now? 2) WHICH tactic fits it — and when should I stay out? WHAT YOU SEE (up to 10 symbols on any chart): • Market regime: Bullish / Bearish / Range / Breakout / Volatile / Quiet • Best-fit tactic hint: Trend, Range, Breakout — or an honest WAIT • Volatility
Utilities
Douglas Lucio De Araujo
Indicator with 3 features - Clock : Clock independent of the chart, counting continues even when the market is closed. - Template : After setting up a configuration in any graphic, be it color patterns, indicators, zoom ... The configuration will be copied to all active graphics. - TimeFrame : Set the TimeFrame on a chart, and with just one click all the active charts will be changed to the same TimeFrame.
Master Manual: Complete Edition Aura HHLL   Platinum  V2.00 Integrated Manual This program is a tool that helps traders determine "what state the market is in right now?" most quickly amidst the complex movements of charts. It is the culmination of technical analysis combining the precision of price action with the intuitiveness of range trading. SECTION 01 Indicator   Key Components   Elements It provides the ability to read the structure of the market. 1. The System's 3 Core Axes HHLL Label
Blogs : https://www.mql5.com/en/blogs/post/768816 MT4 Version https://www.mql5.com/en/market/product/139061 MT5 Version https://www.mql5.com/en/market/product/139062 Problem Monitoring multiple symbols and timeframes at the same time is slow, repetitive, and mentally exhausting. Most traders waste time switching charts one by one, only to realize the move has already happened. By the time a clear trend change is visible, the opportunity is often late or missed. Solution Scanner HalfTrend [ta
Adaptive Math Zones Indicator is a professional MT5 indicator designed to identify high-probability price reaction areas using mathematical price projections and Fibonacci-based channel structures. The indicator automatically builds a reference price channel, highlights neutral zones, and projects future price levels (50%, 100%, and 200%), helping traders visually understand market structure and potential reaction points. This tool is especially effective during ranging and corrective market con
RSIScalperPro
PATRICK WENNING
Introducing RSIScalperPro - the revolutionary RSI-based indicator for Metatrader 5, specifically designed for scalping in the one-minute chart. With RSIScalperPro, you'll have a powerful toolkit for precise entry and exit signals to take your trading to the next level. RSIScalperPro utilizes two different RSI indicators that provide clear signals for overbought and oversold areas. You can customize the time periods and limit values of the two RSIs according to your preferences to achieve the be
Gann Pulse MT5
Cengiz Erkoyuncu
Gann Pulse is a non-repainting trend signal indicator for MetaTrader 5. When a bar closes it shows a clear BUY or SELL arrow and immediately draws the entry price, the Stop Loss and three Take Profit levels. No theory is needed: attach it to a chart and follow the signals. The idea Two of W. D. Gann's classic rules are "never trade against the trend" and "always protect a trade with a Stop Loss". Gann Pulse follows both. Its proprietary momentum engine detects the moment when the pulse of the
Market Ticker Pro MT5
John Louis Fernando Diamante
The only Market Ticker on the market! Add a professional novelty to your workspace, with built in mini-charts A scrolling Market Ticker that displays price changes from all symbols in the Market Watch list. Provides an easy snapshot of symbol prices, and keeps scrolling automatically while you trade and analyse the chart. The ticker color (+/- price changes) are based on either the current or completed candle, and the previous candle. Options include: - MTF, eg choose to show price changes of t
Buyers of this product also purchase
Trend Sniper X
Sarvarbek Abduvoxobov
4.86 (44)
Trend Sniper X is a multi-timeframe trend-following indicator for MetaTrader 5 that helps traders identify trend direction and potential reversal points with clarity and precision. for MT4: https://www.mql5.com/en/market/product/193245 Price Information: The current price is promotional and is subject to change as upcoming updates and new features are released. Bonus Offer: To get the FREE Auto-Trade Assistant EA for this indicator, please message the author after purchasing. Code2Profit Channe
A new King in town - Indicator + Order management indications(tp1+tp2+tp3) + Optional Telegram Signal sender   INCLUDED (FREE) + Bonus EA Robot ( FULL TRADING  and SIGNAL SYSTEM ) Our best EA for Gold: Gold Slayer TRY > Reversion Queen  Expert advisor >JOIN Community Channel < NEW Free Automation EA link < click here ( disclaimer: this is new and still on testing and phase , use at your risk on demo) Free Telegram Bridge < click here  This indicator includes an advanced Strategy, a trading sys
Smart Trend Trading System — MetaTrader 5 Message me on MQL5 after purchase to receive Smart Universal Expert Advisor for FREE, plus the online course, PDF manual, and private group access. STTS brings trend direction, entry and exit signals, reversal zones, and important price levels together on your chart. Follow the system manually, or connect a separate compatible EA for automated execution using your chosen settings. ONE SYSTEM. FOUR TRADING APPROACHES. STTS organizes its trading approaches
Zoryk Gold
Reda El Koutbane
4.78 (18)
discount ends SOON next price 69 $ ZORYK — Advanced XAUUSD Signal System for MetaTrader 5 You know the feeling. You spend time analyzing gold. You wait for the entry. You finally open the trade, and price immediately moves against you. You close too early, move the Stop Loss or hesitate for a few seconds. Then the market reaches the exact destination you originally expected without you. The direction was not always the problem. The real problem was uncertainty. You did not know exactly where th
Entry Points Pro shows you where to enter, where to put the stop and what lot to trade — before you place the order. PRICE Now 149 USD, and this is the last copy at this price. After it the price goes up to 199 USD, and the final price is 349 USD. I make my money trading the markets, and I show it, so I don't need to sell this indicator to everyone. It is a tool for traders who think for themselves, not a magic button. The arrow appears when the candle closes and does not repaint. Two setting
M5 Sniper
MeanFX
5 (4)
Get your trading edge in the line of sight M5 Sniper   is a new indicator by MeanFX. It combines   precise trading signals   with   adaptive TP/SL levels   - creating best possible statistical trades as a result! The price increases every 5 purchases, the next price is 79$ Message me after purchase to receive tips/guide and bonus EA plus trading methodology Auto Optimisation only works on LIVE chart , needs data feed >JOIN Community Channel < What makes it stand out?   Proven statistical per
SuperScalp Pro
Van Minh Nguyen
4.54 (37)
SuperScalp Pro - Professional Multi-Layer Confluence Scalping System SuperScalp Pro is an advanced scalping indicator that upgrades the classic Supertrend with multiple intelligent confirmation filters. It helps you identify higher-probability Buy/Sell opportunities while significantly reducing false signals. Clear Buy and Sell arrows appear directly on the chart, along with automatic ATR-based Stop Loss and Take Profit levels calculated in real time. After purchase, please message me on MQL5 to
Gold Trend Coach MT5
Cristhian Alexander Gaibor Cuasquer
4.2 (10)
Gold Trend Coach is a gold (XAUUSD) trend indicator for MetaTrader 5 with buy and sell signals, stop loss and three take profit targets confirmed on candle close (no repaint), a coach that guides you from the entry to TP3, a multi-timeframe dashboard and alerts to your phone and Telegram. Built for M1 and M5 scalping and M15 intraday during the London and New York sessions. BONUS: FREE Auto-Trade EA for Gold Trend Coach. Message me after purchase and I send you the EA that trades the indicator s
GoldenX Entry MT5
VividMind Digital Solutions
5 (17)
Price will increase by $20 every 10 buyers to maintain premium value. After purchase, contact via   MQL5 inbox   to receive your buyer kit and bonus. You have probably tested dozens of indicators before. But we are not here to be “just another signals indicator.” Behind GoldenX Entry is intensive research & development focused on building sophisticated algorithms designed to adapt to the real behavior of every instrument — not generic signals recycled everywhere else. From advanced Auto Optim
SMC Intraday Formula
VividMind Digital Solutions
5 (26)
Secure the Lowest Price Today. After purchase, contact via   MQL5 inbox   to receive your buyer kit and bonus. Let's be honest first. No indicator will make you profitable on its own. If someone tells you otherwise, they're selling you a dream. Every indicator that shows perfect buy/sell arrows can be made to look flawless — just zoom into the right window of history and screenshot the winners. We won't do that. SMC Intraday Formula is a tool. It reads the market structure for you, maps the hig
Gann Made Easy   is a professional and easy to use Forex trading system which is based on the best principles of trading using the theory of W.D. Gann. The indicator provides accurate BUY and SELL signals including Stop Loss and Take Profit levels. You can trade even on the go using PUSH notifications. PLEASE CONTACT ME AFTER PURCHASE TO GET TRADING  INSTRUCTIONS   AND GREAT EXTRA INDICATORS  FOR FREE! Probably you already heard about the Gann trading methods before. Usually the Gann theory is a
Ultra Indicator
Ihor Otkydach
5 (1)
ULTRA is a technical indicator that operates on an “all-in-one” basis—it independently analyzes the market, generates trading signals, displays levels for setting stop-loss orders, and suggests when to close trades to lock in profits or minimize losses. In other words, it doesn't matter if you don't know how to analyze the market, determine levels—where to set your stop-loss—or struggle with money management. ULTRA will do all of that for you! BUYER BONUS: After purchasing the ULTRA indicator, s
Boba Analysis Suite
Trade Ready Solutions LLC
5 (2)
Boba Analysis Suite Boba Analysis Suite is an analytical indicator for MetaTrader 5. It brings market structure, relevant price zones and broader market context together in a single chart view. Developed through practical experience as a trader and trading coach, it supports a structured analysis process: assessing market direction, identifying important levels and considering multiple timeframes together. Analysis in Context Individual signals gain meaning through context. Boba Analysis Suite h
Welcome to Entry In The Zone & SMC Multi Timeframe —  COMPLETE SMC ANALYSIS SYSTEM — ALL IN ONE INDICATOR Entry In The Zone & SMC Multi Timeframe  An indicator designed for market analysis based on Smart Money Concepts (SMC), displaying Market Structure, Key Zones (Order Blocks, Supply & Demand Zones, and Fair Value Gaps), Liquidity, and real-time BUY / SELL signals. It supports both Single-Timeframe and Multi-Timeframe analysis, along with the Confluence at Zone feature, which helps you evaluat
M1 Sniper MT5
Oleg Rodin
5 (7)
M1 SNIPER  is an easy to use trading indicator system. It is an arrow indicator which is designed for M1 time frame. The indicator can be used as a standalone system for scalping on M1 time frame and it can be used as a part of your existing trading system. Though this trading system was designed specifically for short-term trading, it still can be helpful for all traders. This trading system can be used with any forex pair and time frame, though lower time frames are recommended from M1 up to M
FiboSniper Pro
Van Minh Nguyen
5 (4)
FiboSniper Pro - Multi-Filter Fibonacci System with Auto SL/TP and Control Panel FiboSniper Pro is a technical indicator that combines dynamic Fibonacci Envelopes with multiple confirmation filters to generate selective Buy and Sell signals. Fibonacci levels are calculated from Moving Average and ATR, then filtered by ADX, EMA, RSI, ATR, Volume, Time and Candle structure. The indicator displays automatic ATR-based Stop Loss and Take Profit levels directly on the chart, along with an interactive
Auto Optimized SpeedAngle is an institutional-grade momentum vectoring system that eliminates curve-fitting through continuous Walk-Forward Optimization (WFO). Rather than relying on static inputs that degrade when market regimes shift, the indicator dynamically recalibrates its parameters using Out-of-Sample (OOS) validation, ensuring the displayed signals represent genuine statistical edges rather than historical anomalies. By shifting the focus from subjective visual angles to normalized, qua
Adaptive Price Action Engine Buy Indicator- Get EA Based on it for FREE. Self-Optimizing Multi-Timeframe Trend & Candlestick Intelligence Markets do not behave the same way all the time—and not every price-action pattern has the same value in every market regime. Adaptive Price Action Engine is designed to adapt to changing market conditions by combining trend structure, multi-timeframe analysis, candlestick patterns, and statistical optimization into one analytical framework. Two Adaptive Mode
Crystal Heikin Ashi Signals
Muhammad Jawad Shabir
5 (5)
Crystal Heikin Ashi Signals—Professional Trend & Signal Detection Indicator Advanced Heikin Ashi Visualization with Intelligent Signal System for Manual & Automated Trading Final Price: $149 ---------> Price goes up $10 after every 10 sales . Limited slots available — act fast . Overview User Guide PDF Crystal Heikin Ashi Signals is a professional-grade MetaTrader 5 indicator that combines pure Heikin Ashi candle visualization with an advanced momentum-shift detection system. Designed for both m
Scalper Vault is a powerful, fully-equipped trading system designed for traders who want to achieve consistency in intraday trading . This high-precision indicator serves as a complete, standalone trading system that delivers institutional-grade analysis for both Forex and Binary Options traders. PLEASE CONTACT ME AFTER PURCHASE TO GET MY TRADING TIPS PLUS A GREAT BONUS! By eliminating the guesswork and complex manual analysis, Scalper Vault allows you to focus purely on execution using easy to
Trend Catcher ind mt5
Ramil Minniakhmetov
5 (18)
TREND CATCHER INDICATOR Trend Catcher Indicator analyzes market price movements, using a combination of the author’s proprietary and customized adaptive trend-analysis indicators.  It identifies the true market direction by filtering out short-term noise and focusing on underlying momentum strength, volatility expansion, and price structure behavior.  It also uses a combination of smoothing and trend-filtering customized indicators such as moving averages, RSI, and volatility filters.   Real ope
Atomic Analyst MT5
Issam Kassas
4.5 (64)
Atomic Analyst — MetaTrader 5 Message me on MQL5 after purchase to receive Smart Universal Expert Advisor for FREE, plus the online course, PDF manual, and private group access. Atomic Analyst brings price action, trend direction, entry and exit signals, Stop Loss and multiple Take Profit levels together on your chart. SEE THE SIGNAL. UNDERSTAND THE SETUP. Atomic Analyst organizes its analysis into clear visual information: • Buy and sell arrows to identify potential entries. • Stop Loss and mul
Unix Scalper
Issam Kassas
4 (4)
Unix Scalper — MetaTrader 5 Message me on MQL5 after purchase to receive Smart Universal Expert Advisor for FREE, plus the online course, PDF manual, and private group access. Find the setup. See the plan. Choose how to trade it. UNIX Scalper brings market analysis, BUY/SELL/WAIT decisions and Entry, Stop Loss, TP1 and TP2 levels into one organized panel. SEE THE SIGNAL AND THE PLAN • Clear decisions: BUY, SELL or WAIT. • Defined levels: Entry, Stop Loss, TP1 and TP2. • Multi-timeframe overvie
SIO Oscillator: Self-Optimizing Semivariance Imbalance Oscillator Buy the indicator and get the Expert Advisor based on it for FREE. Most oscillators treat all price movement the same. SIO separates upside and downside market pressure and measures the imbalance between them, showing which side is really in control: buyers or sellers. When the imbalance reaches an extreme, SIO prints a clear signal with entry, Stop Loss and Take Profit levels. What makes SIO different is that it doesn’t rely on f
Volatility Master for MetaTrader is a real-time dashboard tool that scans up to  50 symbols  to identify high-volatility , trending markets instantly. With bullish/bearish signals, customizable alerts, and a user-friendly interface, it helps you avoid range-bound conditions and focus on high-probability trades. Clarity leads to confidence. Trade confidently and protect your capital effectively with this powerful dashboard. We don't offer free or bonus indicators in exchange of reviews from you.
Smc Pro ToolKit
Talal N Z Aljarusha
5 (14)
SMC PRO TOOLKIT — SMART MONEY ANALYSIS & STRUCTURED TRADE PLANNING SMC Pro ToolKit is a professional Smart Money Concepts analysis workspace for MetaTrader 5. It combines market structure, multi-timeframe analysis, institutional price zones, setup evaluation, confirmation tools, volume context, alerts, and risk planning inside one organized chart environment. One workspace. Multiple layers of confirmation. One structured trading plan. OPEN COMPLETE USER GUIDE MULTI-CONDITION SETUP ENGINE At

Multi Currency Strength and Momentum Indicator MT5 Dynamic Forex28 Navigator is the evolution of our long-time, popular indicators, combining the power of three into one: Advanced Currency Strength28 Indicator (700 reviews) Advanced Currency IMPULSE with ALERT (530 reviews) CS28 Combo Signals (recent Bonus) The two predecessor indicators together have received more than 1,200 reviews on the MQL5 Market and have been a staple in the MT4 community since 2016. Dynamic Forex28 Navigator MT5 carries
AriFocus
Temirlan Kdyrkhan
AriFocus - Non-Repainting Buy/Sell Signals AriFocus - one clear signal. AriFocus marks buy and sell signals directly on the chart and suggests a stop-loss level for each one. Every signal is confirmed on bar close and never repaints. - Buy/sell arrows, confirmed on bar close - Suggested stop-loss level for every signal - Trend band and candle coloring to show direction at a glance - 10 ready-made presets, or your own settings (14 calculation methods) - Pop-up, push and email alerts with entr
Neuro Poseidon MT5
Daria Rezueva
4.68 (53)
Neuro Poseidon is a new indicator by Daria Rezueva. It combines precise trading signals with adaptive TP/SL levels - creating best possible trades as a result! Message me and get  Neuro Poseidon Assistant  as a gift to automize your trading process! What makes it stand out? 1. Proven profitability on all assets and timeframes 2. Only confirmed BUY and SELL signals present on the chart 3. Adaptive TP & SL levels generated by the software for each trade 4. Easy to understand - suitable for al
PZ Swing Trading MT5
PZ TRADING SLU
5 (5)
Protect against whipsaws: revolutionize your swing trading approach Swing Trading is the first indicator designed to detect swings in the direction of the trend and possible reversal swings. It uses the baseline swing trading approach, widely described in trading literature. The indicator studies several price and time vectors to track the aggregate trend direction and detects situations in which the market is oversold or overbought and ready to correct. [ Installation Guide | Update Guide | Tro
More from author
Parabolic SAR Multi-Filter System MT5: Algorithmic Trend Reversal Engine 1. PRODUCT OVERVIEW & OPERATIONAL ARCHITECTURE Parabolic SAR Multi-Filter System MT5 is a professional multi-component technical analysis indicator engineered for the MetaTrader 5 terminal. The indicator combines J. Welles Wilder's classic Parabolic Time/Price System with an advanced modular filtering architecture comprising 17 distinct secondary validation engines. The primary objective of this software is to eliminate f
1. OVERVIEW Harmonic Dashboard is a specialized multi-symbol and multi-timeframe analytical indicator designed for MetaTrader 5 (MT5). The software systematically scans financial instruments across multiple timeframes to identify six classical harmonic chart patterns: Gartley, Bat, Butterfly, Crab, Cypher, and Shark. The application consolidates multi-asset scanner results, trend filter validation metrics, price level projections, and interactive chart navigation controls into a single graphic
Overview MACD Signal with Multi Filters is an advanced technical analysis indicator engineered for MetaTrader 5 (MT5). The software combines the classic Moving Average Convergence Divergence (MACD) oscillator architecture with a modular 14-filter confirmation engine (MultiFilterSuite). It is developed to assist manual traders, quantitative analysts, and algorithmic system developers in identifying momentum shifts, trend continuations, and structural turning points while filtering out sideways ma
Overview The MA Cross Scanner Pro is an advanced, highly optimized multi-symbol and multi-timeframe analytical dashboard engineered specifically for the MetaTrader 5 terminal. Designed for technical analysts, systemic traders, and quantitative researchers, this utility serves as a comprehensive market surveillance engine. Its primary objective is to continuously monitor a customized array of financial instruments across numerous timeframes simultaneously, detecting precise moving average crosso
Hull Trend Arrows MT5 with Multi-Filter Suite - Technical Documentation 1. Overview and Analytical Purpose Hull Trend Arrows MT5 with Multi-Filter Suite is an algorithmic technical indicator for MetaTrader 5. It integrates the low-lag calculation engine of the Hull Moving Average (HMA) with fourteen modular confirmation filters to identify directional momentum transitions, calculate inflection points, and display non-repainting entry signals on the chart. Standard moving averages introduce sign
FREE
HA Signal MultiFilter MT5 - Technical Operational Manual & Architecture Guide 1. SYSTEM OVERVIEW & ARCHITECTURAL FOUNDATION HA Signal MultiFilter MT5 is a specialized analytical indicator developed for MetaTrader 5 terminal to identify directional momentum expansions and structural trend continuations[cite: 2]. By synthesizing smoothed Heiken Ashi candlestick price discovery with a modular 15-layer secondary confirmation filter suite, the system extracts high-probability market shifts while fil
FREE
Product Overview: Relative Vigor Index Multi-Filter Technical System The Relative Vigor Index (RVI) Multi-Filter Indicator is a comprehensive technical analysis engine developed for the MetaTrader 5 terminal. Designed to identify cyclical momentum shifts, trend continuations, and structural market turning points, this analytical system couples the classic Relative Vigor Index formula with an advanced multi-layered confirmation matrix consisting of 17 distinct technical filters. Rather than rely
FREE
CCI MultiFilter Overbought Oversold Signal Pro MT5 Technical Specification & Operational Manual  1. Overview and System Identity CCI MultiFilter Overbought Oversold Signal Pro MT5 is an institutional-grade technical analysis indicator engineered natively for MetaTrader 5. Developed for quantitative analysts, systematic manual traders, and multi-asset operators, the system provides an objective algorithmic framework to identify cyclical market extremes, momentum shifts, and structural trend cont
Multi-Pattern Signal Suite with Universal 14-Filter Framework for MetaTrader 5 1. Product Overview Multi-Pattern Signal Suite is an advanced technical analysis indicator engineered for the MetaTrader 5 terminal. The indicator detects high-probability candlestick formations comprising PinBar, Candle Rejection, and Marubozu (Full Body Candle) patterns. To eliminate market noise and false breakout formations, the core price action engine is integrated with the Universal MultiFilterSuite framework:
Overview: ADX Signal MultiFilter is an advanced technical analysis indicator for MetaTrader 5 designed to identify directional breakout momentum and trend acceleration phases. Built around the mathematical framework of J. Welles Wilder's Directional Movement system (ADX, +DI, and -DI), the tool monitors dynamic momentum shifts where directional movement lines break through user-defined threshold levels. To resolve the common challenge of false breakout signals during ranging or choppy market con
Bollinger Band Breakout MultiFilter PRO Signal MT5 1. Overview and Operational Purpose Bollinger Band Signal MultiFilter MT5 is an analytical technical indicator developed for the MetaTrader 5 terminal, designed to detect volatility expansion breakouts while filtering market noise through an extensive modular array of quantitative secondary filters. In dynamic market environments, classic envelope breakouts frequently encounter false continuations during low-momentum ranges or trend exhaustion
Breakout Divergence RSI MultiFilter is a modular technical analysis indicator for MetaTrader 5 designed to identify Regular and Hidden RSI Divergences alongside confirmed trendline breakout continuation opportunities. Equipped with an algorithmic multi-layer filtering engine comprising 16 technical filter systems, this indicator provides an analytical bridge between momentum divergence recognition and structural price action confirmation. 1. TECHNICAL OVERVIEW AND ARCHITECTURE Breakout Diverge
Pro CHO Chaikin Oscillator X Zero Signals Filter Chaikin Oscillator Signal MultiFilter for MetaTrader 5 Product Overview Chaikin Oscillator Signal MultiFilter is a professional-grade technical analysis indicator engineered specifically for the MetaTrader 5 trading platform. The system is designed to identify directional momentum transitions and institutional volume flow dynamics by tracking the Chaikin Oscillator algorithmic model in synchronization with a comprehensive 14-filter confirmation
### Product Overview The Engulfing Dual-Engine and Multi-Filter Confirmation Indicator for MetaTrader 5 is a specialized technical analysis analytical tool engineered to identify directional engulfing candlestick patterns across global financial markets. Developed for quantitative analysts, discretionary traders, and algorithmic strategy designers, the software categorizes engulfing structures into two distinct computational classifications: Standard Retail Engulfing and Advanced Institutional E
1. Overview and Indicator Identity Fractal Breakout MultiFilter MT5 is an institutional-grade technical indicator engineered natively for MetaTrader 5 that identifies high-probability structural breakout opportunities based on multi-bar fractal geometries and confirms them through an institutional suite of fourteen independent analytical filters. The primary purpose of this analytical tool is to eliminate subjective chart interpretation by mathematically locating confirmed price swing highs and
Product Overview: Heiken Ashi Multi-Filter Suite MT5 The Heiken Ashi Multi-Filter Suite is an analytical trading indicator developed natively for MetaTrader 5, designed to provide directional price smoothing, structural reversal detection, and rule-based signal confirmation. By merging modified Heiken Ashi bar calculations with a modular 14-indicator filtering engine, the tool eliminates transient market noise and provides traders with disciplined visual signals. The indicator is built around t
MultiFilter MA High Low Cross Buy Sell Arrows MT5 - Professional Technical Manual 1. Product Overview & System Architecture MultiFilter MA High Low Cross Buy Sell Arrows MT5 is an advanced technical indicator engineered for the MetaTrader 5 trading terminal. Designed for professional technical analysts, manual chartists, and systematic discretionary traders, this software identifies high-probability directional momentum expansions and trend resumption points by tracking price interactions acro
MultiFilter MA Crossover Signals Trend Alerts MT5 TECHNICAL SPECIFICATION & MANUAL Overview: MultiFilter MA Crossover Signals Trend Alerts MT5 is an analytical technical indicator engineered for MetaTrader 5, developed to identify systematic trend transitions through dual moving average crossovers combined with a 17-module quantitative filtering matrix. A primary weakness of conventional moving average systems is vulnerability to whipsaws, false breakouts, and erratic market noise during low-vo
Momentum KU v1.41 Technical Documentation and Operational Manual 1. Overview and Purpose Momentum KU v1.41 is an analytical technical indicator engineered natively for the MetaTrader 5 (MT5) platform. The primary objective of the software is to detect directional momentum transitions across financial assets and provide multi-layered signal validation through an integrated architecture of seventeen independent technical filter subsystems. Momentum KU executes as an on-chart visual utility, plott
NLMS Volatility Trail MultiFilter MT5 - Operational Manual & Technical Specification 1. Overview and Core Purpose NLMS Volatility Trail MultiFilter MT5 is an algorithmic market analysis indicator designed for MetaTrader 5, providing adaptive trend identification, dynamic trailing envelopes, and multi-layered signal filtering. The system is built upon digital signal processing theory, dynamic volatility channels, and a modular matrix of secondary filters. At its computational core operates the
================================================================================ PRO PARABOLIC RSI MULTIFILTER SIGNAL PREMIUM MT5 (OFFICIAL PRODUCT SPECIFICATION) ================================================================================ Pro Parabolic RSI MultiFilter Signal Premium MT5 is a professional-grade technical trading suite engineered for MetaTrader 5, combining high-precision Relative Strength Index (RSI) dynamics with the trailing acceleration mechanism of the Parabolic SAR (St
PARABOLIC RSI SCANNER DASHBOARD ALL PAIR TIMEFRAME - TECHNICAL MANUAL 1. OVERVIEW & SYSTEM ARCHITECTURE The Parabolic RSI Scanner Dashboard All Pair Timeframe is a multi-asset, multi-timeframe analytical utility developed for the MetaTrader 5 terminal. The software calculates a synthetic technical indicator by mapping J. Welles Wilder's Parabolic Stop and Reverse (SAR) tracking logic directly onto the Relative Strength Index (RSI) momentum data series. Rather than tracking price fluctuations,
MultiCandle Pattern Pro with Universal Filter Suite v2.0 is a professional technical analysis indicator engineered for MetaTrader 5 (MT5). The software automates the identification of sequential multi-candle price action formations across liquid financial markets, focusing specifically on 4-Candle (4C), 5-Candle (5C), and 6-Candle (6C) structures. Rather than depending on isolated single-candle setups that are vulnerable to erratic market noise, the system analyzes structured multi-bar sequence
Product: Pro RSI Signal Overbought Oversold Multi Filters MT5 Category: Technical Indicator / Oscillators & Momentum Platform: MetaTrader 5 Overview Pro RSI Signal Overbought Oversold Multi Filters is a technical momentum analysis indicator developed natively for the MetaTrader 5 platform. The tool reproduces and expands upon the standard TradingView Relative Strength Index architecture, providing an authentic analytical bridge between modern charting environments and the MetaTrader trading te
RVI Dual Mode with Universal Multi-Filter Framework for MetaTrader 5 Product Overview and Technical Scope RVI Dual Mode with Universal Multi-Filter Framework is a modular technical analysis indicator engineered specifically for MetaTrader 5. Built upon the volatility-adjusted momentum mathematics of Donald Dorsey's Relative Volatility Index (RVI), this analytical tool provides systematic directional signal generation while addressing whipsaws during consolidating markets. Rather than relying on
Overview RVI Scanner Dashboard Pro is a multi-symbol and multi-timeframe analytical utility engineered for MetaTrader. In financial markets, tracking multiple instruments across various timeframes simultaneously creates significant cognitive load. This dashboard solves this by aggregating decentralized market data into a cohesive Graphical User Interface (GUI). Its primary objective is to monitor continuous data feeds to detect momentum shifts and potential trend reversals based on the Relative
Senkou Span B Dynamic Rejection and Multi-Filter Confluence Framework for MetaTrader 5 Overview The Senkou Span B Dynamic Rejection Indicator is a modular technical analysis system designed for the MetaTrader 5 platform. It identifies institutional price interactions around the Senkou Span B equilibrium line of the Ichimoku Kinko Hyo model. Senkou Span B represents the 52-period midpoint value projected into the market structure, serving as a primary indicator of medium-to-long term support, r
1. Overview Stochastic Multi-Filter Suite is a specialized technical indicator engineered natively for the MetaTrader 5 (MT5) trading platform. The software integrates George Lane's classical Stochastic Oscillator engine with a modular 14-filter algorithmic confirmation framework designated as the MultiFilter Suite. Developed specifically for systematic technical analysts, multi-asset discretionary traders, and quantitative chartists, the indicator transforms standard momentum oscillators into
OVERVIEW Stochastic Scanner Dashboard is a professional analytical utility and multi-symbol, multi-timeframe signal indicator designed for MetaTrader. The primary objective of this tool is to simultaneously monitor multiple financial instruments and timeframes to identify potential market entries based on the Stochastic Oscillator. It eliminates the need to open multiple charts by consolidating all active signals, price levels, and dynamic Risk/Reward calculations into a single interactive grap
Pro Traders Dynamic Index TDI rsi BB Signal Filter - Technical Specification and User Manual 1. Product Overview and Structural Architecture Pro Traders Dynamic Index TDI rsi BB Signal Filter is a multi-layered technical analysis indicator developed natively for the MetaTrader 5 trading platform. The architecture integrates the mathematical models of the classic Traders Dynamic Index (TDI), an adaptive dual-speed Relative Strength Index (RSI) dynamic line engine, baseline volatility envelope ch
Filter:
No reviews
Reply to review