Higher High Lower Low ZigZag Strategy MT5
- Indicators
- Version: 1.0
- Activations: 10
Master Manual: Complete Edition
Aura HHLL Platinum V2.00 Integrated Manual
This program is a tool that helps traders determine "what state the market is in right now?" most quickly amidst the complex movements of charts.
It is the culmination of technical analysis combining the precision of price action with the intuitiveness of range trading.
SECTION 01
Indicator Key Components Elements
It provides the ability to read the structure of the market.
1. The System's 3 Core Axes
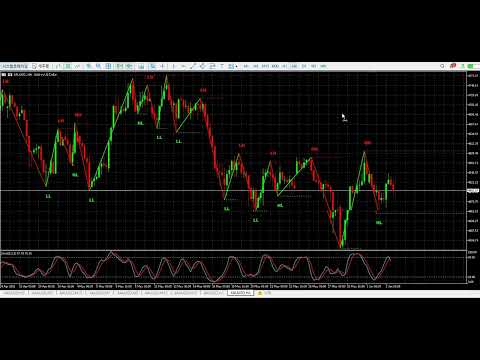
HHLL Labels
Compare the current price position with previous highs/lows and automatically name them HH, HL, LH, LL according to price action rules. By looking at this alone, you can tell whether the current price is in an uptrend, a downtrend, or losing momentum.
Zigzag Wave Line
Vertically connects highs and lows to visualize the direction and magnitude of the waves. Lime color is applied when rising, and Red color is applied when falling.
Smart S/R Line
Significant price levels are displayed as horizontal dotted lines. If the price breaks through this line, the line stops, indicating that "the corresponding resistance/support has been broken."
Real-time Status Assessment
Helps you make an immediate judgment on which phase (upward/downward/sideways) the market is currently in amidst complex candle movements.
2. Definition of Price Action Labels
| Label | Definition | Market Sentiment |
|---|---|---|
| HH(Higher High) | A high higher than the previous high | Continuation of strong buying pressure. Signal of a new trend forming. |
| LH(Lower High) | High point lower than the previous high | Loss of upward momentum. A harbinger of a bearish reversal or strong resistance. |
| HL(Higher Low) | Higher low than the previous low | Confirmation of a healthy correction and renewed buying pressure during an uptrend. |
| LL(Lower Low) | A low lower than the previous low | Reinforcement and acceleration of the downtrend. High probability of further decline. |
SECTION 02
Platinum Unrivaled Technology
Noise Filtering and Infinitely Expandable Box Range Logic
3. Intelligent Algorithm: HL vs OC
Filtering Pivot Data Sources
Beyond simple pivot extraction, you can selectively capture actual supply and demand zones in the market.
- High / Low (Shadow): Based on extreme values including tails that reflect all market sentiment. Optimized for responding to short-term volatility and setting precise stop-loss lines.
- Open / Close (Body): Based on confirmed candle body values. Optimized for swing trading to eliminate market Fakeoutsnoise and find 'real' support and resistance.
4. Eternal BoxLogic
Permanently Project Trend Boundaries
While standard S/R lines stop upon breakout, Platinum V2.00's Eternal Box unconditionally extends the last two lines to the far right of the chart.
- Current Price is Trapped Visualization of the existing 'psychological box range'. The absolute baseline for the upper sell and lower buy strategy in a sideways market. A visual anchor that maintains equilibrium until the price breaks out of the box.
5. Visual Readability and Symmetry
ATR Variable Scaling
Even when changing the timeframe (M1~D1), the labels maintain the 'golden ratio' distance aligned with the candle size. Significantly reduced fatigue during chart analysis.
Mathematical Symmetric Alignment
Resistance labels are formed at positions exactly symmetrical to the support/resistance lines using bottom anchors and support labels (PL) using ceiling anchors. It provides a clean look with 0% visual error.
SECTION 03
Platinum Practical Strategy
3-Step Master Guide to Turning Indicators into Profit
6-7. Trading Model Utilizing Market Structure
Confirmation of Box Range
First, check if the price is consolidating energy between the Eternal Box lines.
Trend Following Entry
In the section where HH and HL repeatConsider a buy entry when the HL label appears and the zigzag turns lime green.The stop-loss line is below the HL line.
Box Breakout/Reversal
If the price strongly breaks through the upper resistance line (Eternal High) of the Eternal Box with the candle body, consider it a breakout from the box range and consider chasing the price.
Alternatively, if an LH occurs after a sustained HH structure and the resistance line is maintained until the end of the chart, judge that the upward momentum has been lost and switch to a sell perspective.
Maximizing Risk-Reward Ratio
The box range line extending to the end of the chart serves as the best baseline for 'conservative take-profit' and 'aggressive stop-loss'.
8. Optimization Parameter Recommendation Guide
| Parameter | Instruction | Recommended Setting |
|---|---|---|
| InpPivotSource | Body-focused analysis when noise is severe | Open / CloseSelect |
| InpVisualGapFactor | Adjusting visual margins of labels | 0.4 ~ 0.8(Fine-tunable) |
| InpEternalLastTwo | Infinite extension of final box range | Recommended to confirm box rangeTrue |
| InpMaxSRLines | Amount of historical indicator data to display | For readability, set to 10 ~ 15 |
| InpLeft/RightBars | Large values capture long-term large waves, small values capture short-term fine waves | Default 5 Recommended |
MASTER THE STRUCTURE
BUILD YOUR EDGE
Charts are not maps made of lines and text.
They are insights that read the fundamental structure of prices.
COMPLETE MASTER
The market moves by structure, not price.
Aura Platinum V2.00 will become your most powerful map.
AURA TRADING SYSTEM | PLATINUM SERIES V2.00