SMC Larry Williams Structure MT4

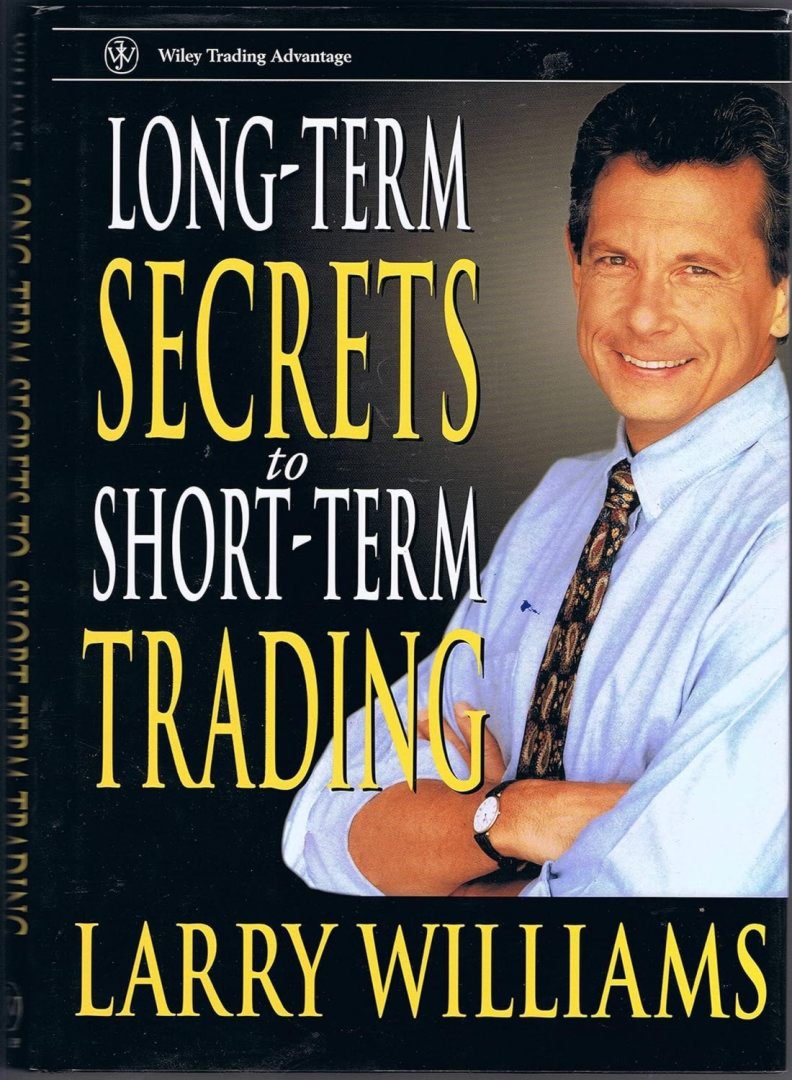
SMC Larry Williams Structure is an indicator for analyzing price chart structures that builds and connects the most important swing points using the method of the famous trader Larry Williams from his bestseller “Long-Term Secrets of Short-Term Trading”, creating a solid foundation for adapting the market structure and analyzing the areas of interest of large participants using the Smart Money concept.

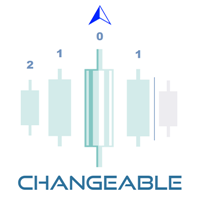
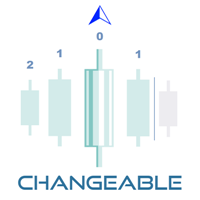
The swing construction is based on simple and clear logic — identifying key local extremes where the middle of three consecutive bars becomes a clear maximum or minimum compared to its neighbors.

The distinctive feature of Larry Williams' method, unlike the classic fractals by Bill Williams, is an additional rule: if the central candle forms a local maximum (its High is higher than the High of neighboring candles), then its Low must also be higher than the Low of neighboring candles — forming a "bottom" on the opposite side. Similarly, for a local minimum — the Low of the central candle is lower than the Low of neighbors, while the High is higher than the High of neighbors.

This condition provides clearer and more definitive identification of significant swings, reducing false signals and improving the reliability of the constructed structure.

Special attention is given to working with inside and outside bars: the indicator ignores inside bars, excluding them from key swing formation to avoid "noise" extremes, and focuses on significant bars related to market participant activity that actually moves the market. This approach is essential for market structure analysis and accounting for accumulation/distribution zones.

Using this technique provides traders with:

  1. Clear Structural Foundation - A transparent and rigorous structural basis for further markup of order blocks, liquidity zones, key supply and demand levels, and any other elements of the currently most popular Smart Money Concepts methodology
  2. Confidence in Objectivity - Assurance in the objectivity of identified extremes, as they are formed according to a proven and strict rule
  3. Automated Markup - Automatic identification that eliminates routine manual work and prevents human markup errors
  4. Universal Application - Method versatility applicable across different timeframes and trading instruments
  5. Flexible Configuration - Adjustable parameters for history depth and filters allow traders to customize the indicator for different market conditions and trading styles

SMC Larry Williams Structure serves as a bridge between classic swing analysis and modern SMC trading models. At a fundamental level, the indicator helps traders recognize market structure through the "eyes" of institutional players, using a mathematically sound and clean method for identifying local extremes to improve trading decision quality while eliminating routine markup work.

The indicator includes the ability to visually highlight key pivot swing points using trend lines that are displayed directly on the price chart, providing clear visual reference points for structural analysis.

Available Mode Options:

  • Standard — Color reflects the direction of individual lines up or down on each segment
  • Structural — Lines are constructed according to the classical definition of trend, where highs and lows sequentially rise or fall. This emphasizes the wave structure of price and its cycles of impulses and corrections according to classical technical analysis
  • Disable — Turns off graphical markup

Additionally, the indicator features visual display of price wave sizes between key swing points using text labels. These labels are automatically placed on the chart near extremes (highs and lows), showing the magnitude of price movement between adjacent swings in points. This helps traders quickly assess wave amplitude and incorporate this evaluation when identifying significant levels and zones of interest, such as order blocks or accumulation/distribution areas, which is particularly important for Smart Money Concept analysis.

For trader convenience, two alert modes have been added:

  1. BoS (breakdown of structure)
  2. ChoCH (change of character)
  3. Breakthrough of any last one-sided extreme
  4. Change of direction of line

    If you need additional alerts with different execution logic, please contact me and I will add them in future updates as needed.

    Indicator settings:

    Maximum number of bars to analyze
     Inside bar search radius
     Radius size (in bars)
     Number of graphic lines
     Mode of graphical line rendering
     Color for lines up
     Color for lines down
     Width of lines up
     Show size labels
     Font size
     Font color
     Maximum number of labels to display
     Show AVG
     Show MED
     Number of lines for calculation
     Font size (AVG)
     Text color (AVG)
     Font size (MED)
     Text color (MED)
     Alert when line reverses
     Alert of breaking through the last extremum
     Push
     Sound
     Sound file
     Mail
     Mail subject
     Delete objects when indicator is removed 


    Version for MT5

    Use the SMC Venom Model BPR indicator as a complement to your trading system

    With each purchase, the indicator price will increase by $10. Don’t delay your purchase! ;)

    Try my other products in the marketplace: https://www.mql5.com/en/users/capitalplus/seller


    ✅ If you liked the indicator, please rate it and leave a review, it is very important to me!

    Wishing you big profits in trading!

    Recommended products
    MA Ribbon MT4
    Diego Arribas Lopez
    MT5 Version MA Ribbon MT4 MA Ribbon is an enhanced indicator with 8 moving averages of increasing periods. MA Ribbon is useful to recognize trend direction,  reversals   and continuation points in the market as well as potential entry, partial take profit and exit points. Entry points for long and shorts position can be found when the price entries or leaves the Ribbon, at retest or a defined number of MA crossovers. It offers a good combination with mostly any volume or momentun indicators to f
    Advanced Trend Breaker Free Dashboard!!!   Advanced Trend Breaker DashBoard: https://www.mql5.com/en/market/product/66336   Breaker's smart algorithm detects the trend,Support and resistance, filters out market noise and find entry signals!!! Test the demo version and explore its features, it would be useful tool added to your trading arsenal. Do not foget down load Free DashBoard!!!   Advanced Trend Breaker DashBoard !!! Advantages You Get Easy, visual and effective trend detection. Support an
    Provide ideas for trend trading. Automatic calculation and generation of trend channels. The channel line, also known as the pipeline line, is to draw a straight line parallel to the trend line in the opposite direction of the trend line, and the straight line crosses the highest or lowest price of the recent period. These two lines run the price in the middle and have obvious pipe or channel shapes. Necessary for traders: tools and indicators Waves automatically calculate indicators, channel
    Interactive BB Matrix
    Tsvetan Tsvetanov
    2 (1)
    This indicator displays Bollinger Bands signals for multiple symbols and multiple time frames. The signals are created as a simple ratios which represent the distance between the current price and the moving average measured in standard deviations. This way we create a very versatile and easy to use indicator which helps us to identify not only the strongest trends but also the most overbought and oversold conditions. Features Accurate signals in real time for multiple time frames and multiple
    Powerful Binary Options
    Ellan Dirgantara Tholkhah
    This is the binary options signal you all have been looking for. This in a modified version of the Garuda Scalper, that has been modified for Binary Options traders. Signals are very unique! Why this is so effective for binary options is because  it is a trend following system, it understands that the trend is your friend. It takes advantage of the buying/selling after the pullback in continuation of the current trend wave.  Because  signals are generated after the pullback,   you can place shor
    The Icarus Auto Dynamic Support and Resistance  Indicator provides a highly advanced, simple to use tool for identifying high-probability areas of price-action automatically - without any manual input whatsoever. .  All traders and investors understand the importance of marking horizontal levels on their charts, identifying areas of supply and demand, or support and resistance. It is time-consuming and cumbersome to manually update all instruments, across all timeframes, and it requires regular
    Trend TRN
    Andriy Sydoruk
    The Trend TRN trend indicator works using a special algorithm and a set of indicators. It finds the current trend based on many factors. Trend TRN entry points should be used as potential market reversal points. The indicator works using the cyclic-wave dependence function. Thus, all entry points will be optimal points where the movement changes. A simple and convenient indicator. The user can easily see the trends. You can use this indicator alone or in combination with other indicators acco
    Product Overview Auto Trading Plan Generator Ultra is a main‑chart moving‑average bounce trading‑plan generator designed for both the   MT4 and MT5   platforms. Built on a multi‑period moving‑average system, it constructs a multi‑dimensional bounce detection model that automatically generates Buy or Sell signals when price touches a moving average and produces a directional bounce. At the moment of signal trigger, it instantly draws a complete trading‑plan panel at the signal candle, including
    How to find out where to expect a price reversal with a probability of 80% - 90%? The "Statistics of Price Movements" indicator collects statistics of significant price movements, skipping all small pullbacks, for a certain period of time and displays them in Excel file. Sort the data in ascending order and get statistics of price reversals in 80%, 85%, 90%, 95% of all cases! (for example, in 2 years!) After the reversal, the price will move from 1000 pips or more! So... Open the daily cha
    Crypto_Forex Indicator "ATR Trailing Stop" for MT4, No Repaint. - Upgrade your trading methods with great auxiliary ATR Trailing Stop indicator for MT4. - This indicator is perfect for Trailing Stop purpose. - ATR Trailing Stop is automatically adaptive to market volatility. - No delays and easy set up. - This indicator is excellent to combine with price action entries into the direction of main trend. Click here to see high quality Trading Robots and Indicators! This is original product which
    StatZigZag
    Aleksey Ivanov
    The StatZigZag  indicator looks like a regular ZigZag , but is built on the basis of completely different algorithms. The StatZigZag  indicator is a broken line built from segments of regression lines of different lengths, the beginning of each of which comes from the end of the previous segment. Each regression segment is built until the variance or spread of price around it begins to exceed a certain critical value, after which the construction of this segment ends and the constr
    Trend Code
    Ning Liu
    4 (1)
    Trend Code (v2.0) Trend Code is a very simple and yet effective trend indicator to capture trend movement, detect the trend reversal, calculate entry price as well as proper stop loss. Trend Code indicator is made up of a series of block, while bull trend block in bull colour and bear block in bear trend colour. For bull trend block, the TrendOpen is the lower edge, TrendClose is the upper edge, for bear trend block, the other way round. Parameters: TrendOpenAdjustment   = 0.8, (range 0~1.0) Tr
    The arrow indicator without redrawing shows potential entry points into the market in the form of arrows of the appropriate color: the up arrows (usually green) suggest opening a purchase, the red down arrows suggest selling. The appearance of arrows may be accompanied by beeps. It is usually assumed to enter at the next bar after the pointer, but there may be non-standard recommendations. Arrow indicators visually "unload" the price chart and save time for analysis: no signal – no deal, if ther
    Equilibrium MA
    Jean Francois Le Bas
    This indicator cuts right through the price, in a straight line 100% non repaint, you get a new value at the opening of each new bar It is perfect for mean reversal strategies : open far from the line and close when the price touches the line It works really well for mean reverting pairs specially (CHF, NZD). It has absolutely no lag when there is a sudden move up or down and follows trend exactly ! This indicator should be a must have tool in the toolbox of every trader
    The technical indicator "Reversal patterns" is a mathematical interpretation of the classic reversal patterns: Pin Bar, Harami and Engulfing. That is, the "reversal bar", "Harami" and "Absorption". This indicator allows you to determine the moment of reversal of quotes based on market dynamics and the winner between the "bulls" and "bears". The indicator displays the moment of reversal at the local highs and lows of the chart of any timeframe, which allows you to increase the accuracy of the s
    CRT Candle Range Theory HTF MT4 - Ultimate CRT Indicator: Advanced ICT Concepts and Malaysian SnR Trading System Master the Market Maker's Footprints with the Most Advanced Candle Range Theory Indicator. Unlock the true power of Smart Money Concepts (SMC) and trade precisely like the institutions with the Ultimate CRT Indicator. Built exclusively for serious traders, this indicator automates the highly effective Candle Range Theory (CRT), a core pillar of ICT Concepts (Inner Circle Trader), and
    [ MT5 Version ]  [ Kill Zones ]  [ SMT Divergences ] Order Blocks ICT Multi TF - FVG-Confirmed Order Blocks for MT5 Most ICT order block indicators for MT5 turn every opposite candle into an order block. The chart fills up and the label stops meaning anything. Order Blocks ICT Multi TF uses Fair Value Gap confirmation and monitors up to four timeframes from one chart. It is built for traders who want a defined reason for the block, not another coloured rectangle. GIVE THE BLOCK A REASON TO MATTE
    Ultra Advanced Scalper
    Marcel De Oliveira Farias
    Ultra Advanced Scalper is a technical indicator for MetaTrader 4 intended for short-term analysis. According to the author, it is suited to scalping on the lower timeframes. Main features - Designed for short-term and scalping analysis - Works from M15 up to H4 - Easy to use - Can be combined with a higher timeframe trend filter - A demo version is available for testing Recommended settings Time-frames: M15, M30, H1, H4 Pairs: EUR/USD, USD/JPY, GBP/USD, USD/CHF, USD/CAD, AUD/USD, EUR/JPY How to
    NoFear
    Hoang Ngoc Thach
    NoFear indicator is based on Advanced Moving Average. It is used in technical chart analysis providing signals whenever a rate change appears that exceeds the upper or lower border. The indicator works very well on trend market. It is easy to find good entry points by blue/violet arrows. The upper and lower bands should be used like support/resistance levels and stop/exit points. All signals do not repaint, and can be used immediately when they are coming. This means we do not need to wait for a
    Introduction "Smart money" is money invested by knowledgeable individuals at the right time, and this investment can yield the highest returns. The concept we focus on in this indicator is whether the market is in an uptrend or downtrend. The market briefly takes a weak and reversal trend with "Minor BoS" without being able to break the major pivot. In the next step, it returns to its main trend with a strong bullish move and continues its trend with a "Major BoS". The "order block" beh
    Hidden Cross Binary Options
    Ellan Dirgantara Tholkhah
    The latest Binary Options arrow indicator in the Garuda Signals product line. Binary options signal based on multiple time frame cross over analysis. Gets confirmation from the most consistent signals known to man; Ichimoku, SMA, Bollinger Bands; and also uses the 1 Hour time frame as trend confirmation , so you don't have to open up multiple chart and waste time. - Can be used for all time frames up to 1 hour, but is most POWERFUL for 1 and 5 min options. - Place your Call/PUT based on the Arro
    Unique Trend
    Andriy Sydoruk
    The Unique Trend indicator tracks market trends, ignoring sharp fluctuations and market noise. The indicator is suitable for trading on small timeframes because it ignores sudden price jumps or price corrections due to the reduction of market noise around the average price. The scan at minima and maxima forms the internal boundaries (channel) when calculating the indicator signals. The channel allows you to remove market noise. iMA and iATR are used to generate signals using the author's algor
    Breakout Pro Scalper Solution This indicator is part of the   RPTrade Pro Solutions  systems. Breakout Pro Scalper Solution   is a daily trend indicator using Price Action, Dynamic Support and Resistances. It's designed to be used by anyone, even the absolute beginner in trading can use it. NEVER repaints . Indications are given  from close to close . Designed to  be used alone , no other indicators are required. Gives you the trend and potential Take Profit at the beginning of the day. A spec
    Three Channel
    Kourosh Hossein Davallou
    5 (1)
    The Price Channel pattern trading strategy is one of the smartest ways to make money trading. The Price Channel pattern represents two trend lines positioned above (channel resistance) and below (channel support) the price. The price action is contained between these two parallel trendlines. The separation between the two trendlines needs to be wide enough if you want to trade inside the Price Channel Pattern. If this is the case, you can buy at the channel support level and sell at the channel
    Dynamic Levels
    Svyatoslav Kucher
    Dynamic Levels is a channel indicator of dynamic levels, designed for identification of the price extremums. It allows increasing the efficiency of any strategy due to advanced parameters, which in turn allow customizing it for personal trading style. Dynamic Levels does not change its values, it is suitable for any timeframe and currency pair. Indicator Parameters ChannelPeriod - period for the indicator calculation. ChannelSmoot - smoothing of values. ATRPeriod - volatility calculation period
    Draw by Hand Tool
    John Louis Fernando Diamante
    This tool provides a freehand drawing method, to treat the chart space as a blackboard and draw by-hand. Drawings can be made to stick to the CHART (moves with chart scroll), or to stick to the WINDOW (does not move with chart scroll). Features: all drawings are individually styled, color, width show/hide each drawing type delete last drawing drawings, on chart and on window, remain through TF changes and terminal re-starts, until the indicator is removed Panel: stylable colors scalable in size
    Reversal Area Indicator
    Shiffolika Kapila
    5 (2)
    Reversal Area Indicator (MT4) A precision‑engineered MT4 indicator designed to capture market tops, bottoms, and re‑entry points using intelligent Support/Resistance zone detection and high‑probability reversal logic. The Reversal Area Indicator identifies dynamic reversal zones where price is most likely to react, giving you early, accurate Buy/Sell entries with extremely small Stop Losses and exceptional Risk‑to‑Reward potential. Optimized for fast‑moving charts (M1/M5) yet powerful enough f
    NQX Flag Continuation Daily Bias MT4 is a signal indicator for MetaTrader 4: flag continuation signals (it only signals in the direction of the daily bias). Proprietary NQX logic that detects a short flag that resumes the push. It only signals in the direction of the daily bias. It draws the suggested entry, a short stop and long targets (3:1, 5:1, 10:1, up to 20:1 on swing); you decide. What it draws on the chart - An arrow on the closed signal candle (it never repaints a closed signal). - The
    Ozi Arrow
    Svyatoslav Kucher
    Ozi Arrow is a unique indicator that can display signals in the direction of the main trend and counter trend signals. For calculations, the indicator determines a price channel. If recently the price was at its borders, and all conditions of additional filters are observed, a signal is displayed in the form of arrows. Ozi Arrow is suitable for any timeframe and any pair. The indicator signals do not disappear under any conditions. A distinctive feature is the presence of a trend filter. If the
    ForexFire Renkotrader Recognize profitable entries & trade with confidence! Highlights: Precise signals – Identifies reversal candles in the trend EMA filter - Uses Ema`s for reliable signals Intelligent signal limiting - Only qualified signals are displayed Easy to use – Perfect for beginners & professionals Visual support - arrows in the chart + SL display in the chart Notifications – Receive alerts & push notifications This is how the indicator works: Long Signal:
    Buyers of this product also purchase
    Trend SniperX MT4
    Sarvarbek Abduvoxobov
    5 (5)
    Trend Sniper X is a multi-timeframe trend-following indicator for MetaTrader 5 that helps traders identify trend direction and potential reversal points with clarity and precision. For MT5: https://www.mql5.com/en/market/product/181101 Price Information: The current price is promotional and is subject to change as upcoming updates and new features are released. Code2Profit Channel Master the Market with Multi-Timeframe Analysis! How to Maximize Your Win Rate with Trend Sniper X: Key Rules & Sess
    Currency Strength Wizard is a very powerful indicator that provides you with all-in-one solution for successful trading. The indicator calculates the power of this or that forex pair using the data of all currencies on multiple time frames. This data is represented in a form of easy to use currency index and currency power lines which you can use to see the power of this or that currency. All you need is attach the indicator to the chart you want to trade and the indicator will show you real str
    BLACK FRIDAY – 40% OFF Best Solution for any Newbie or Expert Trader! This dashboard software is working on 28 currency pairs plus one. It is based on 2 of our main indicators (Advanced Currency Strength 28 and Advanced Currency Impulse). It gives a great overview of the entire Forex market plus Gold or 1 indices. It shows Advanced Currency Strength values, currency speed of movement and signals for 28 Forex pairs in all (9) timeframes. Imagine how your trading will improve when you can watch th
    Scalper Vault
    Oleg Rodin
    5 (41)
    Scalper Vault is a powerful, fully-equipped trading system designed for traders who want to achieve consistency in intraday trading . This high-precision indicator serves as a complete, standalone trading system that delivers institutional-grade analysis for both Forex and Binary Options traders. PLEASE CONTACT ME AFTER PURCHASE TO GET MY TRADING TIPS PLUS A GREAT BONUS! By eliminating the guesswork and complex manual analysis, Scalper Vault allows you to focus purely on execution using easy t
    Smart Trend Trading System is a chart indicator for MetaTrader 4 that brings trend information, entry and exit signals, and price levels into one workspace. It combines 10+ trading tools into one system, including trend detection, reversal zones, smart cloud, trailing stop logic, support and resistance, candle coloring, alerts, and multi-timeframe analysis. The system is designed to help you trade different market conditions: Trending markets: Identify the main trend, detect pullbacks, follow mo
    Gann Made Easy
    Oleg Rodin
    4.84 (174)
    Gann Made Easy is a professional and easy to use Forex trading system which is based on the best principles of trading using the theory of W.D. Gann. The indicator provides accurate BUY and SELL signals including Stop Loss and Take Profit levels. You can trade even on the go using PUSH notifications. PLEASE CONTACT ME AFTER PURCHASE TO GET TRADING  INSTRUCTIONS   AND GREAT EXTRA INDICATORS  FOR FREE! Probably you already heard about the Gann trading methods before. Usually the Gann theory is a
    SIO Oscillator: Self-Optimizing Semivariance Imbalance Oscillator Buy the indicator and get the Expert Advisor based on it for FREE. Most oscillators treat all price movement the same. SIO separates upside and downside market pressure and measures the imbalance between them, showing which side is really in control: buyers or sellers. When the imbalance reaches an extreme, SIO prints a clear signal with entry, Stop Loss and Take Profit levels. What makes SIO different is that it doesn’t rely on f
    Atomic Analyst
    Issam Kassas
    5 (14)
    Atomic Analyst — MetaTrader 4 For product questions, setup guidance, or technical support, message me directly here on MQL5. The indicator turns complex market calculations into simple visual signals, color-coded candles, trend readings, stop-loss levels, and multiple take-profit zones that traders can understand quickly and use in real market conditions. Main Trading Uses: Scalping and intraday trading: Designed for fast decision-making, clear arrows, alerts, candle colors, and structured entry
    SR Liquidity
    Oleg Rodin
    5 (2)
    SR Liquidity is a trading indicator designed to reveal the hidden zones where market liquidity concentrates and price reacts most strongly. These special liquidity areas act as powerful support and resistance levels, giving you a clear map of where the market is most likely to reverse. Instead of drawing ordinary Support/Resistance lines, SR Liquidity analyzes real price behavior to detect the zones where buying and selling pressure accumulate. These are actually the pools of liquidity that driv
    PRO Renko System
    Oleg Rodin
    5 (31)
    PRO Renko System is a highly accurate trading system specially designed for trading RENKO charts. The ARROWS and Trend Indicators DO NOT REPAINT! The system effectively neutralizes so called market noise giving you access to accurate reversal signals. The indicator is very easy to use and has only one parameter responsible for signal generation. You can easily adapt the tool to any trading instrument of your choice and the size of the renko bar. I am always ready to provide extra support to help
    AW Prime Oscillator
    AW Trading Software Limited
    5 (1)
    A combination of two oscillators. The first one displays the entry points, the second shows the current trend . The indicator can display oscillator signals by arrows in two modes, all fast oscillator signals or signals only in the direction of the current trend. It has a multi-timeframe panel and three types of signal notifications. Benefits: Suitable for day and scalping trading Trend filtering Simple and sensitive setup Multi-timeframe panel Suitable for integration into an advisor. Works on
    PZ Turning Points MT4
    PZ TRADING SLU
    1 (1)
    Identify key turning points with reliable fractal analysis This indicator examines the price structure of fractals of different periods to determine possible reversal points in the market, providing timing to positional traders that already have a fundamental or technical valuation model. Unlike its younger brother, Reversal Fractals , this indicator won't miss reversals because of the period selected, and will find reversal fractals on a zig-zag fashion, ignoring those reversals which do not
    M1 Sniper
    Oleg Rodin
    4.97 (30)
    M1 SNIPER  is an easy to use trading indicator system. It is an arrow indicator which is designed for M1 time frame. The indicator can be used as a standalone system for scalping on M1 time frame and it can be used as a part of your existing trading system. Though this trading system was designed specifically for short-term trading, it still can be helpful for all traders. This trading system can be used with any forex pair and time frame, though lower time frames are recommended from M1 up to M
    RFI levels PRO
    Roman Podpora
    5 (2)
    RFI LEVELS PRO identifies reversal structures and key price-return zones where major market participants may become active. The indicator helps you detect the formation of a new trend, identify potential entry points, and control risk and profit levels in advance. VERSION MT5   —   The indicator reaches its full potential when used together with TREND LINES PRO . What the indicator shows: Reversal structures and levels activated at the beginning of a new trend. Potential entry points in the dire
    Non repaint MT4
    Yan Zhen Du
    5 (1)
    This is a professional chart indicator designed for traders focused on stability and clear price action. It helps filter market noise and provides clear visual entry and exit zones for your trading decisions. Core Features: Strictly Non-Repainting: The system is built with strict non-repaint logic. What you see on the chart is the true historical performance. Confirmed Signals: Signals are triggered and confirmed only after the candle closes . Once a trading arrow appears on a closed candle, it
    Gann Time Clusters
    Martin Eshleman
    2.5 (2)
    Gann Time Clusters Indicator This indicator is based on W. D. Gann's Square of 9 method for the time axis. It uses past market reversal points and applies the mathematical formula for Gann's Square of 9 and then makes projections into the future. A date/time where future projections line up is called a 'time cluster'. These time clusters are drawn as vertical lines on the right side of the chart where the market has not advanced to yet. A time cluster will result in a market reversal point (ex.
    Route Lines Prices
    Vitalyi Belyh
    3 (1)
    Route Lines Prices is an indicator designed for finding price directions. Its simple interface contains multiple algorithms for price behavior and future direction calculations. These algorithms include volatility calculations and price smoothing based on the timeframes used. The indicator has a single parameter for changing the " Calculating Price Values " value. The default value of 1 provides a balanced automatic calculation, which can be used without manually configuring the indicator. By m
    Advanced Supply Demand
    Bernhard Schweigert
    4.91 (302)
    BLACK FRIDAY – 40% OFF Best Solution for any Newbie or Expert Trader! This indicator is a unique, high quality and affordable trading tool because we have incorporated a number of proprietary features and a new formula. With this update, you will be able to show double timeframe zones. You will not only be able to show a higher TF but to show both, the chart TF, PLUS the higher TF: SHOWING NESTED ZONES. All Supply Demand traders will love it. :) Important Information Revealed Maximize the potent
    Imbalance Pro
    Ivan Stefanov
    5 (4)
    Imbalance Pro is a volume imbalance indicator for MetaTrader 4 that measures the buying and selling volume of bulls and bears over the period you choose and draws a coloured line between the two points on your chart: green when the bulls have more volume, red when the bears do, with the percentage difference. Its window shows how the volume developed in time, and an adjustable alert is included. Use it to confirm trends, breakouts and support and resistance, and to spot reversals, on Forex, gol
    Trend Lines PRO
    Roman Podpora
    5 (2)
    TREND LINES PRO    helps understand where the market is truly changing direction. The indicator shows real trend reversals and points where major players re-enter. You see   BOS lines   Trend changes and key levels on higher timeframes — without complex settings or unnecessary noise. Signals don't repaint and remain on the chart after the bar closes. VERSION MT 5     -     Reveals its maximum potential when paired with the   RFI LEVELS PRO  indicator What the indicator shows: Real shifts   tren
    BLACK FRIDAY  – 40% OFF Best Solution for any Newbie or Expert Trader! This indicator is a unique, high quality and affordable trading tool because we have incorporated a number of proprietary features and a secret formula. With only ONE chart it gives Alerts for all 28 currency pairs. Imagine how your trading will improve because you are able to pinpoint the exact trigger point of a new trend or scalping opportunity! Built on new underlying algorithms it makes it even easier to identify and con
    Super Signal – Skyblade Edition Professional No-Repaint / No-Lag Trend Signal System with Exceptional Win Rate | For MT4 / MT5 It works best on lower timeframes, such as 1-minute, 5-minute, and 15-minute charts. Core Features: Super Signal – Skyblade Edition is a smart signal system designed specifically for trend trading. It applies a multi-layered confirmation mechanism to detect only strong, directional moves supported by real momentum. This system does not attempt to predict tops or bottoms
    Liquidity Scalper System: a liquidity-based trading system in indicator form. Most indicators only show an arrow, and the trader then has to decide where the stop goes, where the target is and whether the signal can be trusted at all. Liquidity Scalper System covers the full trade cycle: it finds liquidity pools, gives a signal when they are broken, immediately calculates Entry, Stop Loss and three targets, and shows statistics and out-of-sample test results on the panel. The system picks its o
    Tokyo mt4 Indicator
    Vasiliy Strukov
    5 (9)
    Tokyo Indicator provides a clear visual overview of trend direction, potential trading signals, and market conditions. Its colour-coded, stepped trend line distinguishes bullish phases in blue from bearish phases in magenta. Matching directional arrows highlight potential buying and selling opportunities when the displayed trend changes. An integrated dashboard brings together the current signal, market bias, momentum, volatility, and signal quality in one convenient view. This allows traders t
    Elliott Live is a MetaTrader 5 indicator that automatically labels Elliott waves on historical bars and on the live bar. Completed waves are drawn with solid lines; the wave that is still forming is drawn dotted with a question mark (for example, "3?"), together with Fibonacci targets and an invalidation level. MT5-version:  https://www.mql5.com/en/market/product/200604 How it works The indicator first builds swings (ZigZag). A reversal is registered when price pulls back from an extreme by at l
    Gold Channel is a volatility-based indicator, developed with a specific timing algorithm for the XAUUSD pair, which consists of finding possible corrections in the market. This indicator shows two outer lines, an inner line (retracement line) and an arrow sign, where the theory of the channel is to help identify overbought and oversold conditions in the market. The market price will generally fall between the boundaries of the channel. If prices touch or move outside the channel it is a tradi
    This indicator shows the relative strength of 8 major currencies: USD, EUR, GBP, AUD, NZD, CAD, CHF and JPY. The strength value is normalized to the range 0-100: The value above 60 means strong. The value below 40 means weak.  The basic principle Given eight currencies, USD,EUR,GBP,AUD,NZD,CAD,CHF,JPY, where each pair of two can be combined, resulting in a total of 28 pairs, a reverse algorithm is used to extract the strength of the eight currencies from these 28 pairs EURUSD,GBPUSD,AUDUSD,NZDU
    Liked the logic of this tool? Explore the full ecosystem of professional indicators and utilities created by a trader for traders: All products by the author on MQL5 Market: https://www.mql5.com/en/users/musa1994/seller Details and trading philosophy: https://developer-mql4-mql5.netlify.app/ Professional Delta Volume MTF v2.0 is a professional indicator for MetaTrader 4 that shows the difference between buy and sell volume (Delta Volume) and Cumulative Delta. Version 2.0 introduces f
    Sniper Flip Zones
    Leandro Bernardez Camero
    5 (2)
    Sniper Flip Zones – Smart Buy/Sell Signal System Join the channel to stay updated: https://www.mql5.com/en/channels/forexnewadvisor I designed Sniper Flip Zones to generate ultra-precise BUY and SELL signals by identifying moments where momentum shifts sharply in trending or ranging markets. It works exceptionally well on XAUUSD M1/M5 , but can be applied to any pair or timeframe using the configurable parameters. The core logic combines: Stochastic reversals at extreme levels (10/90) Optional
    Italo Volume Indicator
    Italo Santana Gomes
    4.92 (79)
    BUY INDICATOR AND GET EA FOR FREE AS A BONUS + SOME OTHER GIFTS! ITALO VOLUME INDICATOR  is the best volume indicator ever created, and why is that? The Indicator works on all time-frames and assets, indicator built after 7 years of experience on forex and many other markets. You know many volume indicators around the internet are not complete, does not help, and it's difficult to trade, but the Italo Volume Indicator is different , the Italo Volume Indicator shows the wave volume, when market
    More from author
    Fractals Dynamic Fractals Dynamic   – is a modified free fractal indicator by Bill Williams, in which you can manually set the number of bars on the left and right, thereby building unique patterns on the chart. Now all trading strategies based on or based on the Fractals Dynamic indicator will have an additional signal. In addition, fractals can act as support and resistance levels. And in some trading strategies, show liquidity levels. For this purpose, levels were introduced in this version
    FREE
    Development of the previous version of the indicator ZigZag WaveSize MT4 ZigZag WaveSize - modified standard ZigZag indicator with added information about wave length in points, levels, and different alert logic General Improvements: Code adaptation for MetaTrader 5 Optimized work with graphical objects New Features: Horizontal levels at extremes Selection of level types: horizontal/rays/segments Filter for liquidity levels (not broken by price) Buffer for breakouts: adjusting sensitivity to f
    FREE
    Fractals Dynamic Fractals Dynamic   – is a modified free fractal indicator by Bill Williams, in which you can manually set the number of bars on the left and right, thereby building unique patterns on the chart. Now all trading strategies based on or based on the Fractals Dynamic indicator will have an additional signal. In addition, fractals can act as support and resistance levels. And in some trading strategies, show liquidity levels. For this purpose, levels were introduced in this version
    FREE
    Clone
    Ivan Butko
    Clone MT5 is an interactive tool for finding similar situations in chart history. You select any price section with a frame, and Clone finds the most similar historical sections of the same instrument, marks them on the chart and lets you compare them with the current sample. This is not a signal indicator and not an Expert Advisor. It is a market research tool designed to help answer a simple question: “Where has something similar happened before, and what happened next?” Sample — the chart se
    SMC Larry Williams Structure PRO I am pleased to present an advanced market-structure indicator for MetaTrader 4, built on Larry Williams' hierarchical swing method. Unlike the standard version, PRO is not limited to a single sequence of local highs and lows. The indicator builds three interconnected levels of market structure , processes inside and outside bars, identifies Breakout, Break of Structure, Change of Character and Reversal events, and provides confirmed data to Expert Advisors throu
    The SMC Venom Model BPR MT5 indicator is a tool for visual analysis of BPR/FVG zones within the Smart Money Concept (SMC). It automatically identifies key price imbalance zones on the chart and allows you to analyze them on both the current timeframe and multiple timeframes. FVG (Fair Value Gap) — a price imbalance zone identified from a three-candle formation, where an unfilled price range forms between the first and third candles. BPR (Balanced Price Range) — a structure involving two opposing
    ZigZag WaveSize MT4
    Ivan Butko
    4.75 (4)
    ZigZag WaveSize - a modified standard ZigZag indicator with added information about the wavelength in points. Features: Optimized online construction logic: labels are not redrawn from scratch on each tick, but work in parallel with the main calculation, drawing only the latest labels when ZigZag draws new lines or updates them. Added another calculation mode in points: the line is drawn if it exceeds the specified number of points in the settings: manual and automatic (according to ATR with a
    FREE
    TimeBar
    Ivan Butko
    5 (1)
    TimeBar TimeBar is a simple information indicator that shows the remaining time until the bar closes, as well as the time elapsed since the bar opened and the current time. For ease of perception, two types of display modes have been added: in the form of a comment in the upper left corner of the graph, or in the form of a graphic object. Advantages Font selection Font size. You can set any one. When commenting it is too small You can move objects. Any time can be selected by double clicking t
    FREE
    Chart Navigator MT5 Base is a mini-map for fast navigation across the price chart and quick jumps to your own marks on it. This indicator adds a compact mini-map of the entire price chart to the chart. The map helps you move quickly through history and return to important places marked with vertical lines. The main benefit of this simple navigator is not just chart scrolling, but a fast jump to the required area without painful manual scrolling. If you place a vertical line on the chart as a mar
    FREE
    Chart Navigator MT4 Base is a mini-map for fast navigation across the price chart and quick jumps to your own marks on it. This indicator adds a compact mini-map of the entire price chart to the chart. The map helps you move quickly through history and return to important places marked with vertical lines. The main benefit of this simple navigator is not just chart scrolling, but a fast jump to the required area without painful manual scrolling. If you place a vertical line on the chart as a mar
    FREE
    TimeBar TimeBar is a simple information indicator that shows the remaining time until the bar closes, as well as the time elapsed since the bar opened and the current time. For ease of perception, two types of display modes have been added: in the form of a comment in the upper left corner of the graph, or in the form of a graphic object. Advantages Font selection Font size. You can set any one. When commenting it is too small You can move objects. Any time can be selected by double clicking t
    FREE
    Market Noise Market Noise is an indicator that determines market phases on a price chart, and also distinguishes clear smooth trend movements from noisy flat movements when an accumulation or distribution phase occurs. Each phase is good for its own type of trading: trend for trend-following systems, and flat for aggressive ones. When market noise begins, you can decide to exit trades. In the same way, and vice versa, as soon as the noise ends, you need to turn off aggressive trading systems. S
    MinMax Levels – is an indicator of the maximum, minimum and opening price levels for important trading periods: day, week and month. Each Forex market participant uses levels in their trading system. They can be either the main signal for making transactions or an additional one, acting as an analytical tool.  In this indicator, days, weeks and months were selected as important periods, since they are the key trading periods of large market participants. As you know, prices move from level to
    The  SMC Venom Model BPR indicator is a tool for visual analysis of BPR/FVG zones within the Smart Money Concept (SMC). It automatically detects key price imbalance zones on the chart and allows you to analyze them not only on the current timeframe, but also in multi-timeframe mode. FVG   (Fair Value Gap) — a price imbalance zone detected from a three-candle structure, where an unfilled price area forms between the first and third candle. BPR   (Balanced Price Range) — a structure related to tw
    Chart Navigator MT4   is an interactive minimap for MetaTrader 4 charts. It helps you see the whole chart, understand where the current visible area is located, and move through long historical periods without endless scrolling. The indicator is designed for traders, analysts and developers who work with long chart history, graphical objects, arrow-based indicators, historical trade markers or manually marked setups. Chart Navigator adds a visual navigation layer to the chart without occupying t
    AutoColor PRO MT4 is a utility indicator for automatically managing the colors of graphical objects in MetaTrader 4. It recognizes the object type and geometry, determines its direction or its position relative to the current price, and applies the appropriate color. For composite analytical tools, AutoColor PRO MT4 colors the visually meaningful parts: lines, channels, levels, rays, and arcs. For example, an ascending trend line can automatically receive a bullish color, a descending line a bea
    Clone MT4 is an interactive tool for finding similar situations in chart history. You select any price section with a frame, and Clone finds the most similar historical sections of the same instrument, marks them on the chart and lets you compare them with the current sample. This is not a signal indicator and not an Expert Advisor. It is a market research tool designed to help answer a simple question: “Where has something similar happened before, and what happened next?” Version for MetaTrade
    The Palantir indicator predicts a price reversal by the number of points specified by the user in the settings. You select the size of the trend you are interested in and the indicator will predict with what probability the price will move in the opposite direction the specified number of points from the nearest extreme. The indicator's operation is based on statistical calculation of historical trends. Palantir analyzes trends in history with the size specified in the settings, collects stati
    MultiFractal is a modified Bill Williams fractal indicator, supplemented by higher order fractals, the difference between which is four in size, similar to changing the time frame. Advantages over the original terminal indicator: Convenience Visibility Information content The indicator is convenient because you do not need to switch to different timeframes when working. Visibility - in one chart you can see the structure of the chart from smaller to medium and large market movements. Information
    Market Noise Market Noise is an indicator that determines market phases on a price chart, and also distinguishes clear smooth trend movements from noisy flat movements when an accumulation or distribution phase occurs. Each phase is good for its own type of trading: trend for trend-following systems, and flat for aggressive ones. When market noise begins, you can decide to exit trades. In the same way, and vice versa, as soon as the noise ends, you need to turn off aggressive trading systems. S
    Currency Strength Dynamic Currency Strength Dynamic is an indicator of currency strength. Currency strength refers to the trend direction of most or all currency pairs that a currency is a part of. The indicator is based on readings of the difference between moving averages, similar to the MACD indicator, on the 28 most popular currency pairs: majors and minors. Advantages Unique oscillatory calculation method Availability of buttons to disable or enable lines of specific currencies Informat
    MultiFractal Levels MultiFractal Levels is a modified Bill Williams fractal indicator with the addition of levels. Fractals are built from all TFs allowed in the settings. Levels are built only based on the latest fractals that have not yet been tested by price. Advantages over the original terminal indicator: Convenience Visibility Informativeness Latest levels Customizable fractal Customizable levels The indicator is convenient because you do not need to switch to different timeframes when w
    MinMax Levels – is an indicator of the maximum, minimum and opening price levels for important trading periods: day, week and month. Each Forex market participant uses levels in their trading system. They can be either the main signal for making transactions or an additional one, acting as an analytical tool.  In this indicator, days, weeks and months were selected as important periods, since they are the key trading periods of large market participants. As you know, prices move from level to l
    SMC Larry Williams Structure is an indicator for analyzing price chart structures that builds and connects the most important swing points using the method of the famous trader Larry Williams from his bestseller “Long-Term Secrets of Short-Term Trading”, creating a solid foundation for adapting the market structure and analyzing the areas of interest of large participants using the Smart Money concept. The swing construction is based on simple and clear logic — identifying key local extremes whe
    Chart Navigator MT5 is an interactive minimap for MetaTrader 5 charts. It helps you see the whole chart, understand where the current visible area is located, and move through long historical periods without endless scrolling. The indicator is designed for traders, analysts and developers who work with long chart history, graphical objects, arrow-based indicators, historical trade markers or manually marked setups. Chart Navigator adds a visual navigation layer to the chart without occupying the
    SMC Larry Williams Structure PRO I am pleased to present an advanced market-structure indicator for MetaTrader 5, built on Larry Williams' hierarchical swing method. Unlike the standard version, PRO is not limited to a single sequence of local highs and lows. The indicator builds three interconnected levels of market structure , processes inside and outside bars, identifies Breakout, Break of Structure, Change of Character and Reversal events, and provides confirmed data for Expert Advisors and
    AutoColor PRO is a utility indicator for automatically managing the colors of graphical objects in MetaTrader 5. It recognizes the object type and geometry, determines its direction or its position relative to the current price, and applies the appropriate color. For composite analytical tools, AutoColor PRO colors the visually meaningful parts: lines, channels, levels, rays, and arcs. For example, an ascending trend line can automatically receive a bullish color, a descending line a bearish col
    Filter:
    No reviews
    Reply to review