SMC Larry Williams Structure
- Indicators
-
Ivan Butko
 Greetings, friends!
I write in mql4 and mql5. In my market you will find a variety of products, every day I develop something new, I research something. New indicators and advisors will appear in the near future. - Version: 1.1
- Updated: 30 July 2025
- Activations: 20
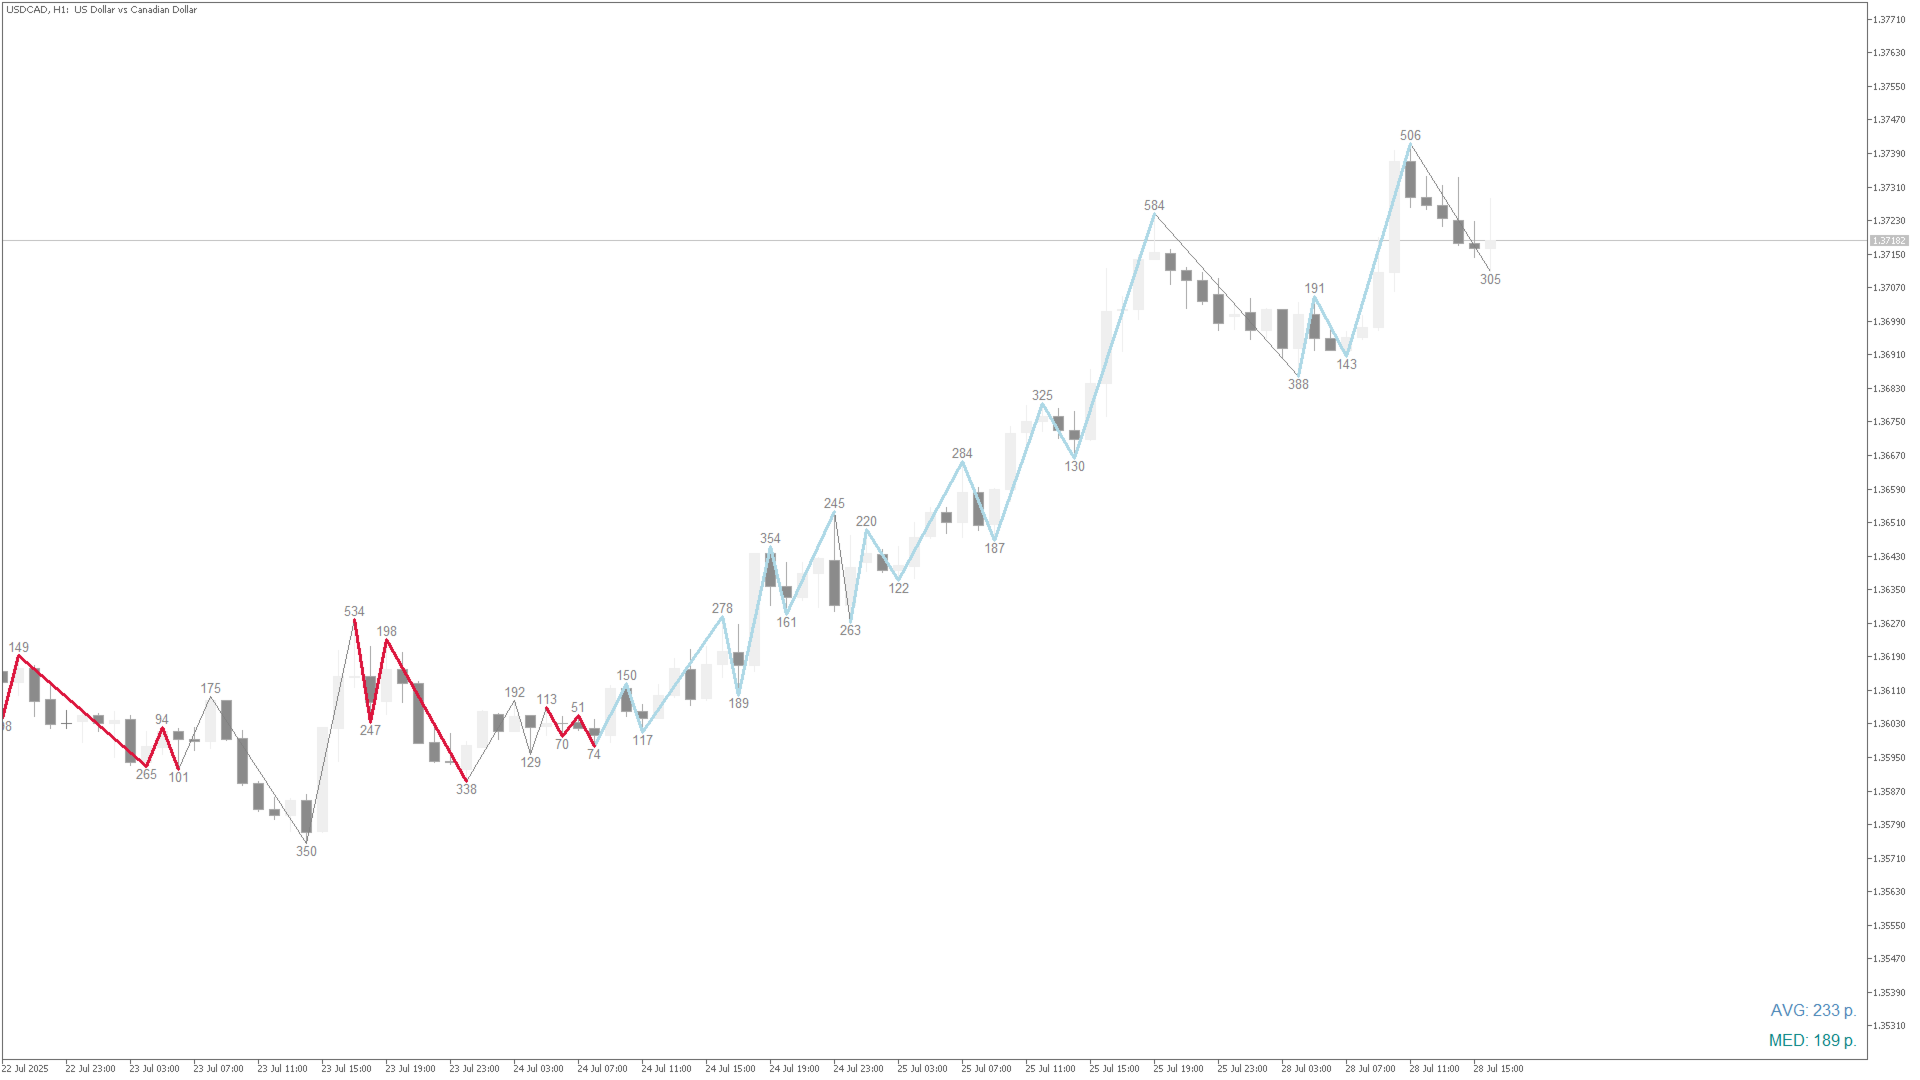
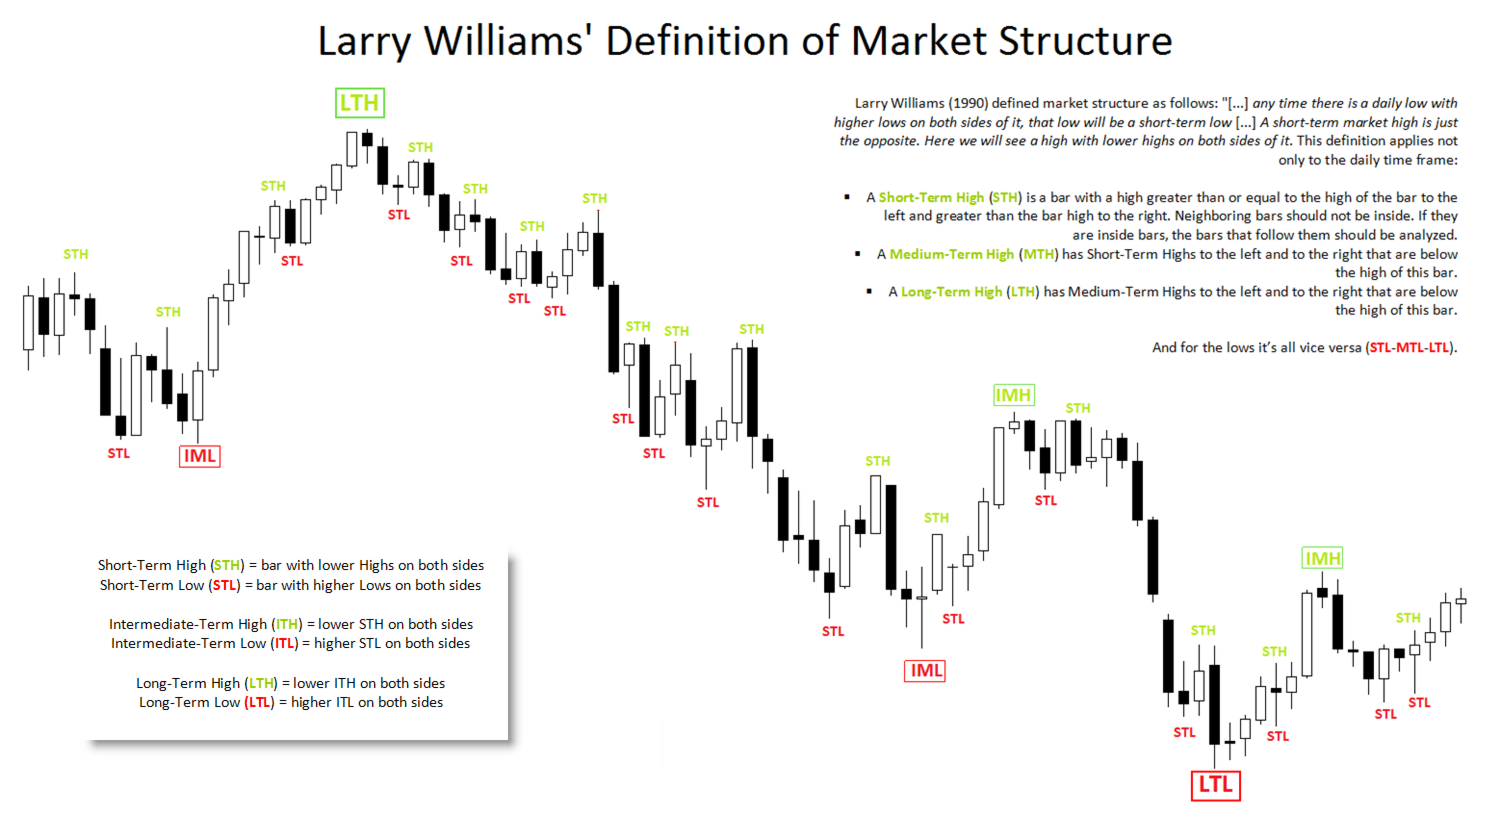
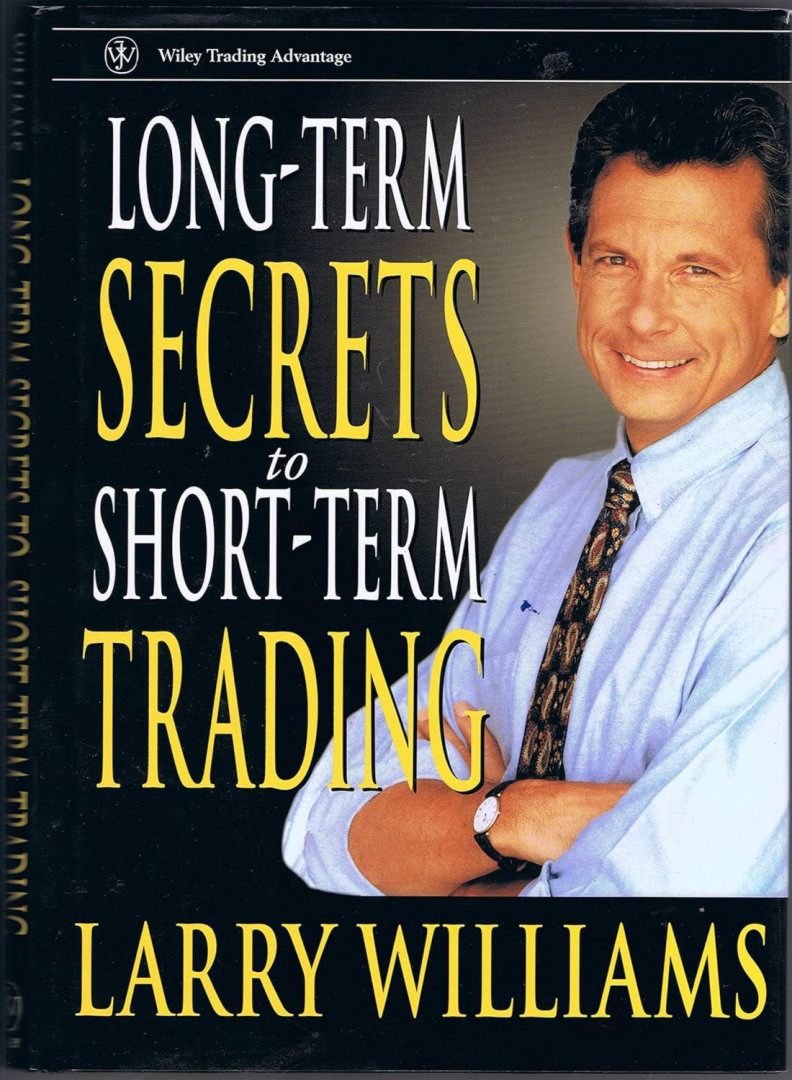
SMC Larry Williams Structure is an indicator for analyzing price chart structures that builds and connects the most important swing points using the method of the famous trader Larry Williams from his bestseller “Long-Term Secrets of Short-Term Trading”, creating a solid foundation for adapting the market structure and analyzing the areas of interest of large participants using the Smart Money concept.
The swing construction is based on simple and clear logic — identifying key local extremes where the middle of three consecutive bars becomes a clear maximum or minimum compared to its neighbors.
The distinctive feature of Larry Williams' method, unlike the classic fractals by Bill Williams, is an additional rule: if the central candle forms a local maximum (its High is higher than the High of neighboring candles), then its Low must also be higher than the Low of neighboring candles — forming a "bottom" on the opposite side. Similarly, for a local minimum — the Low of the central candle is lower than the Low of neighbors, while the High is higher than the High of neighbors.
This condition provides clearer and more definitive identification of significant swings, reducing false signals and improving the reliability of the constructed structure.
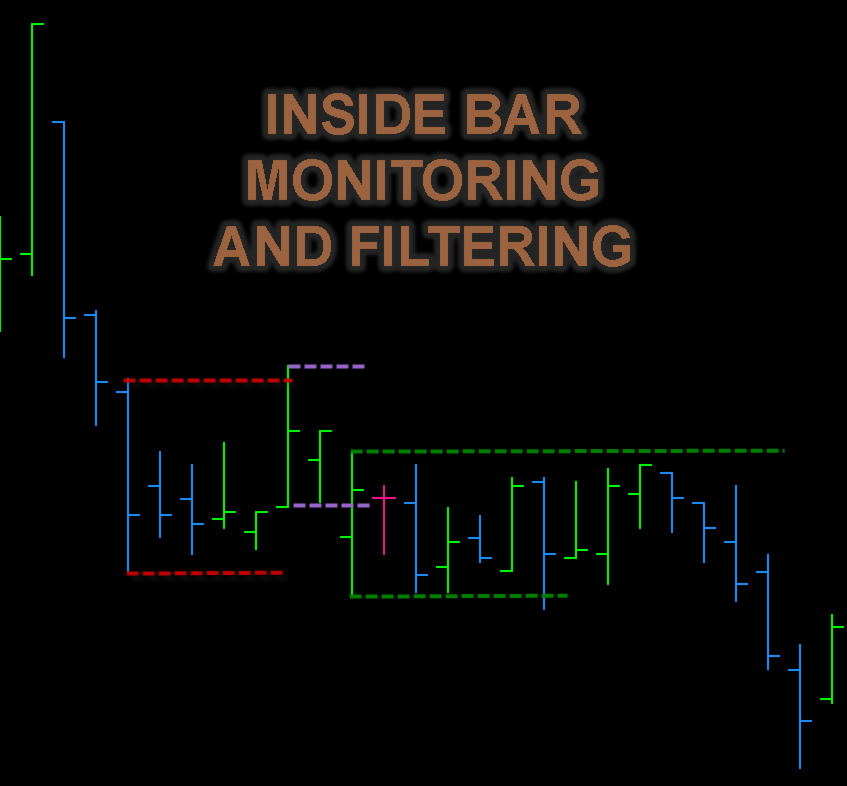
Special attention is given to working with inside and outside bars: the indicator ignores inside bars, excluding them from key swing formation to avoid "noise" extremes, and focuses on significant bars related to market participant activity that actually moves the market. This approach is essential for market structure analysis and accounting for accumulation/distribution zones.
Using this technique provides traders with:
- Clear Structural Foundation - A transparent and rigorous structural basis for further markup of order blocks, liquidity zones, key supply and demand levels, and any other elements of the currently most popular Smart Money Concepts methodology
- Confidence in Objectivity - Assurance in the objectivity of identified extremes, as they are formed according to a proven and strict rule
- Automated Markup - Automatic identification that eliminates routine manual work and prevents human markup errors
- Universal Application - Method versatility applicable across different timeframes and trading instruments
- Flexible Configuration - Adjustable parameters for history depth and filters allow traders to customize the indicator for different market conditions and trading styles
SMC Larry Williams Structure serves as a bridge between classic swing analysis and modern SMC trading models. At a fundamental level, the indicator helps traders recognize market structure through the "eyes" of institutional players, using a mathematically sound and clean method for identifying local extremes to improve trading decision quality while eliminating routine markup work.
The indicator includes the ability to visually highlight key pivot swing points using trend lines that are displayed directly on the price chart, providing clear visual reference points for structural analysis.
Available Mode Options:
- Standard — Color reflects the direction of individual lines up or down on each segment
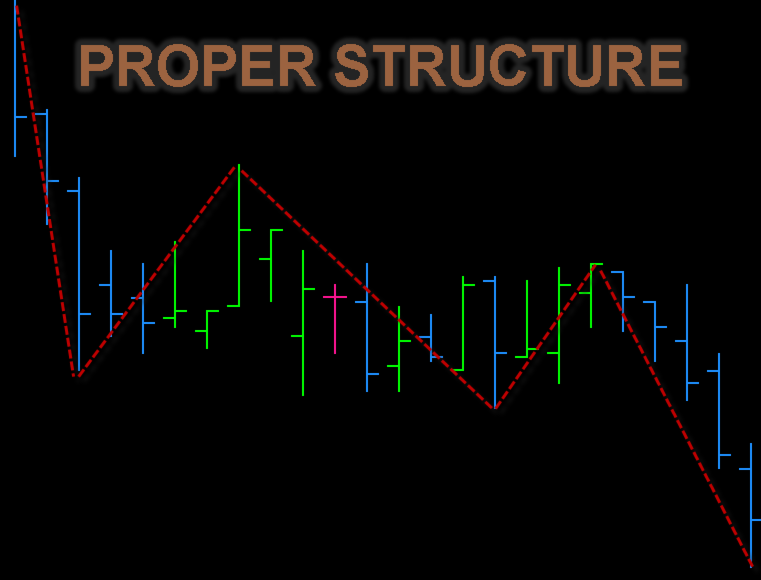
- Structural — Lines are constructed according to the classical definition of trend, where highs and lows sequentially rise or fall. This emphasizes the wave structure of price and its cycles of impulses and corrections according to classical technical analysis
- Disable — Turns off graphical markup
Additionally, the indicator features visual display of price wave sizes between key swing points using text labels. These labels are automatically placed on the chart near extremes (highs and lows), showing the magnitude of price movement between adjacent swings in points. This helps traders quickly assess wave amplitude and incorporate this evaluation when identifying significant levels and zones of interest, such as order blocks or accumulation/distribution areas, which is particularly important for Smart Money Concept analysis.
For trader convenience, two alert modes have been added:
- BoS (breakdown of structure)
- ChoCH (change of character)
- Breakthrough of any last one-sided extreme
- Change of direction of line
If you need additional alerts with different execution logic, please contact me and I will add them in future updates as needed.
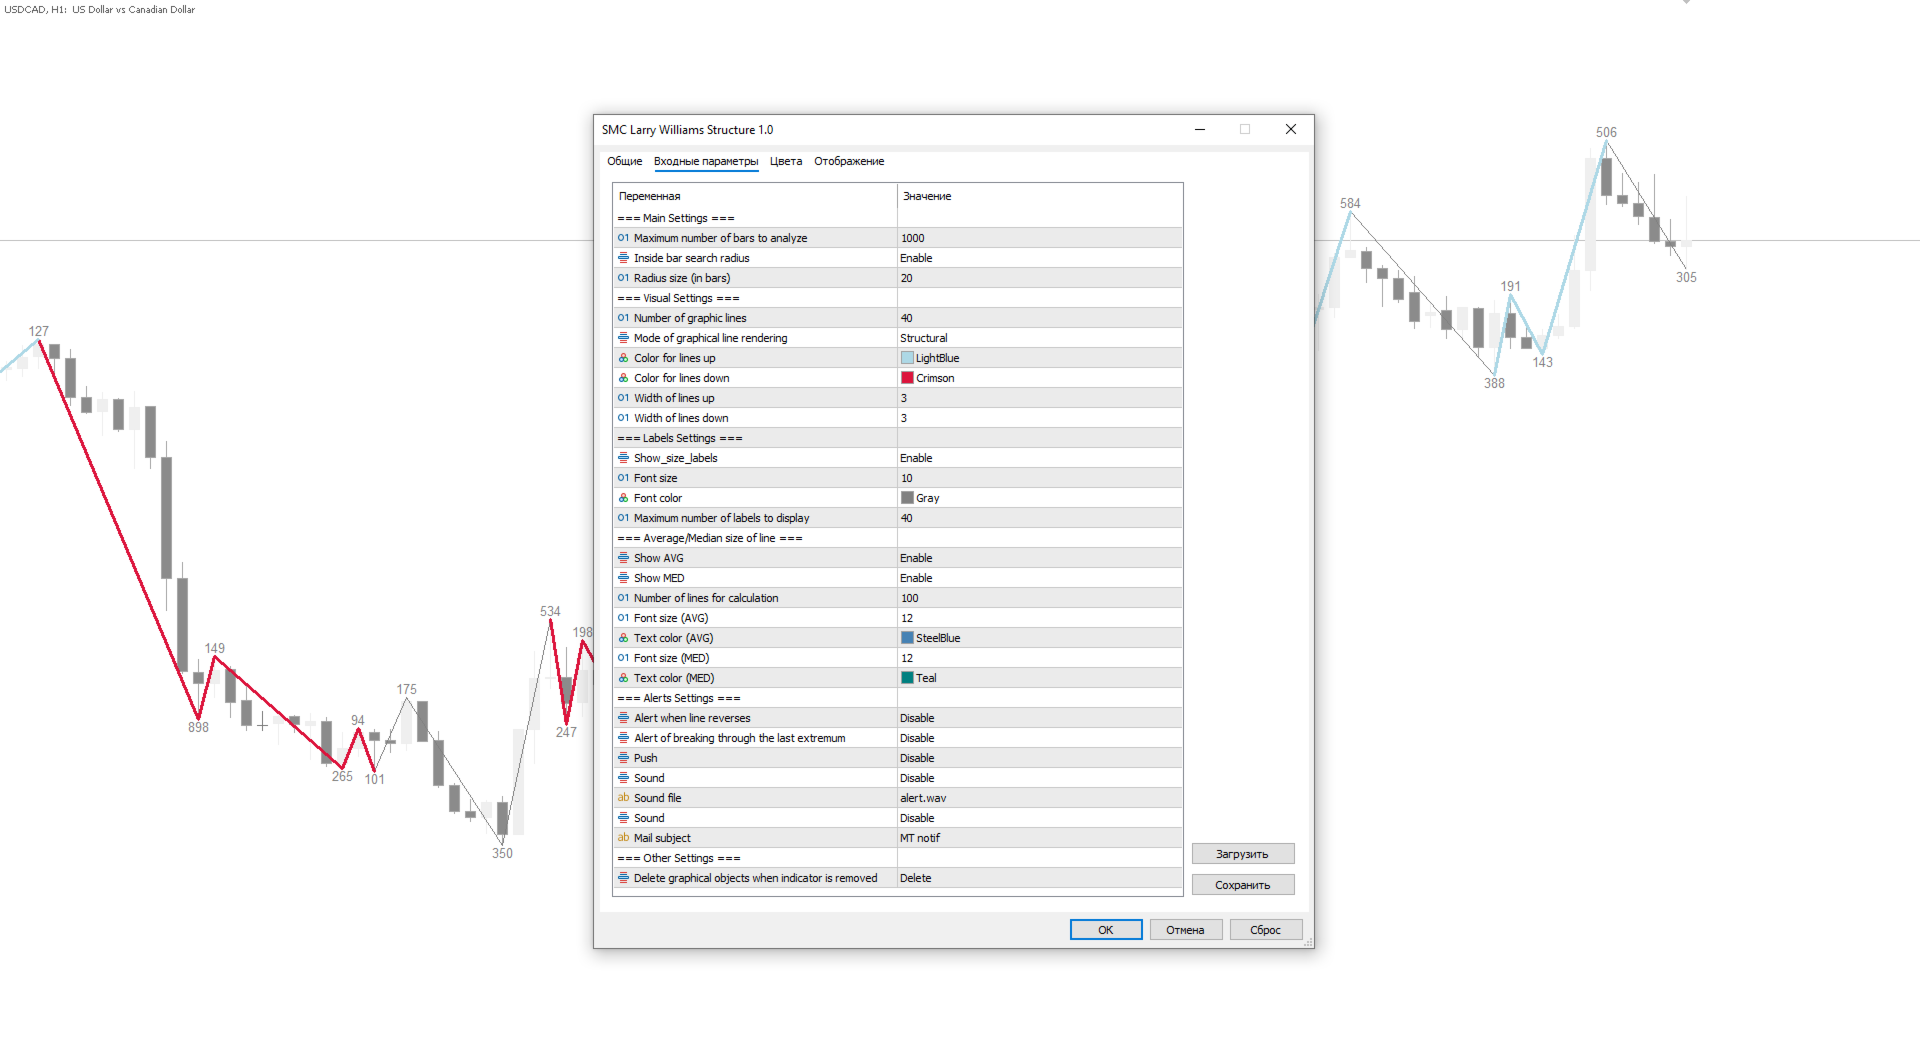
Indicator settings:
| Maximum number of bars to analyze |
| Inside bar search radius |
| Radius size (in bars) |
| Number of graphic lines |
| Mode of graphical line rendering |
| Color for lines up |
| Color for lines down |
| Width of lines up |
| Show size labels |
| Font size |
| Font color |
| Maximum number of labels to display |
| Show AVG |
| Show MED |
| Number of lines for calculation |
| Font size (AVG) |
| Text color (AVG) |
| Font size (MED) |
| Text color (MED) |
| Alert when line reverses |
| Alert of breaking through the last extremum |
| Push |
| Sound |
| Sound file |
| Mail subject |
| Delete objects when indicator is removed |
Version for MT4
Use the SMC Venom Model BPR indicator as a complement to your trading system
With each purchase, the indicator price will increase by $10. Don’t delay your purchase! ;)
Try my other products in the marketplace: https://www.mql5.com/en/users/capitalplus/seller
Wishing you great profits in trading!