Palantir

The Palantir indicator predicts a price reversal by the number of points specified by the user in the settings. You select the size of the trend you are interested in and the indicator will predict with what probability the price will move in the opposite direction the specified number of points from the nearest extreme.

The indicator's operation is based on statistical calculation of historical trends. Palantir analyzes trends in history with the size specified in the settings, collects statistics and produces results based on them. For example, you set the trend size to 500 pips. The indicator analyzes trends whose corrections did not exceed 500 pips. Then it compares the latest (current) trend with historical ones and shows what place the current trend occupies in history. Indicator readings above 50% indicate that the current trend is larger than half of historical trends, and vice versa. In addition, the 50% level is the median, around which a trend reversal most often occurred. Readings of 70/80/90% and above also indicate high trend strength. The latest 300 historical trends are taken into account. The size of the predicted trend depends on the loaded history. For a trend that is too large (thousands of points), there may simply not be enough historical quotes. Therefore, if the indicator does not have enough history for calculation, it will notify you about this in the log. The optimal trend size is equal to the average daily price volatility. For example, for the EURUSD pair up to 120.0 points.

Carefully!

Values above the average may also indicate strong trends; in this case, the indicator readings may be high, but this will not reflect the real picture of the market. For example, if the indicator values are 95-99%, this does not mean that the price will immediately reverse. This means that the trend is rare, too strong and impulsive. The indicator only talks about actual statistics on history, but the market is not obliged to comply with these statistics.

Also pay attention to the rule for constructing a trend: until the trend has gone in the opposite direction for the number of points you specified, it continues accordingly. And, therefore, the reversal is counted from the new extremum and the target will also shift.
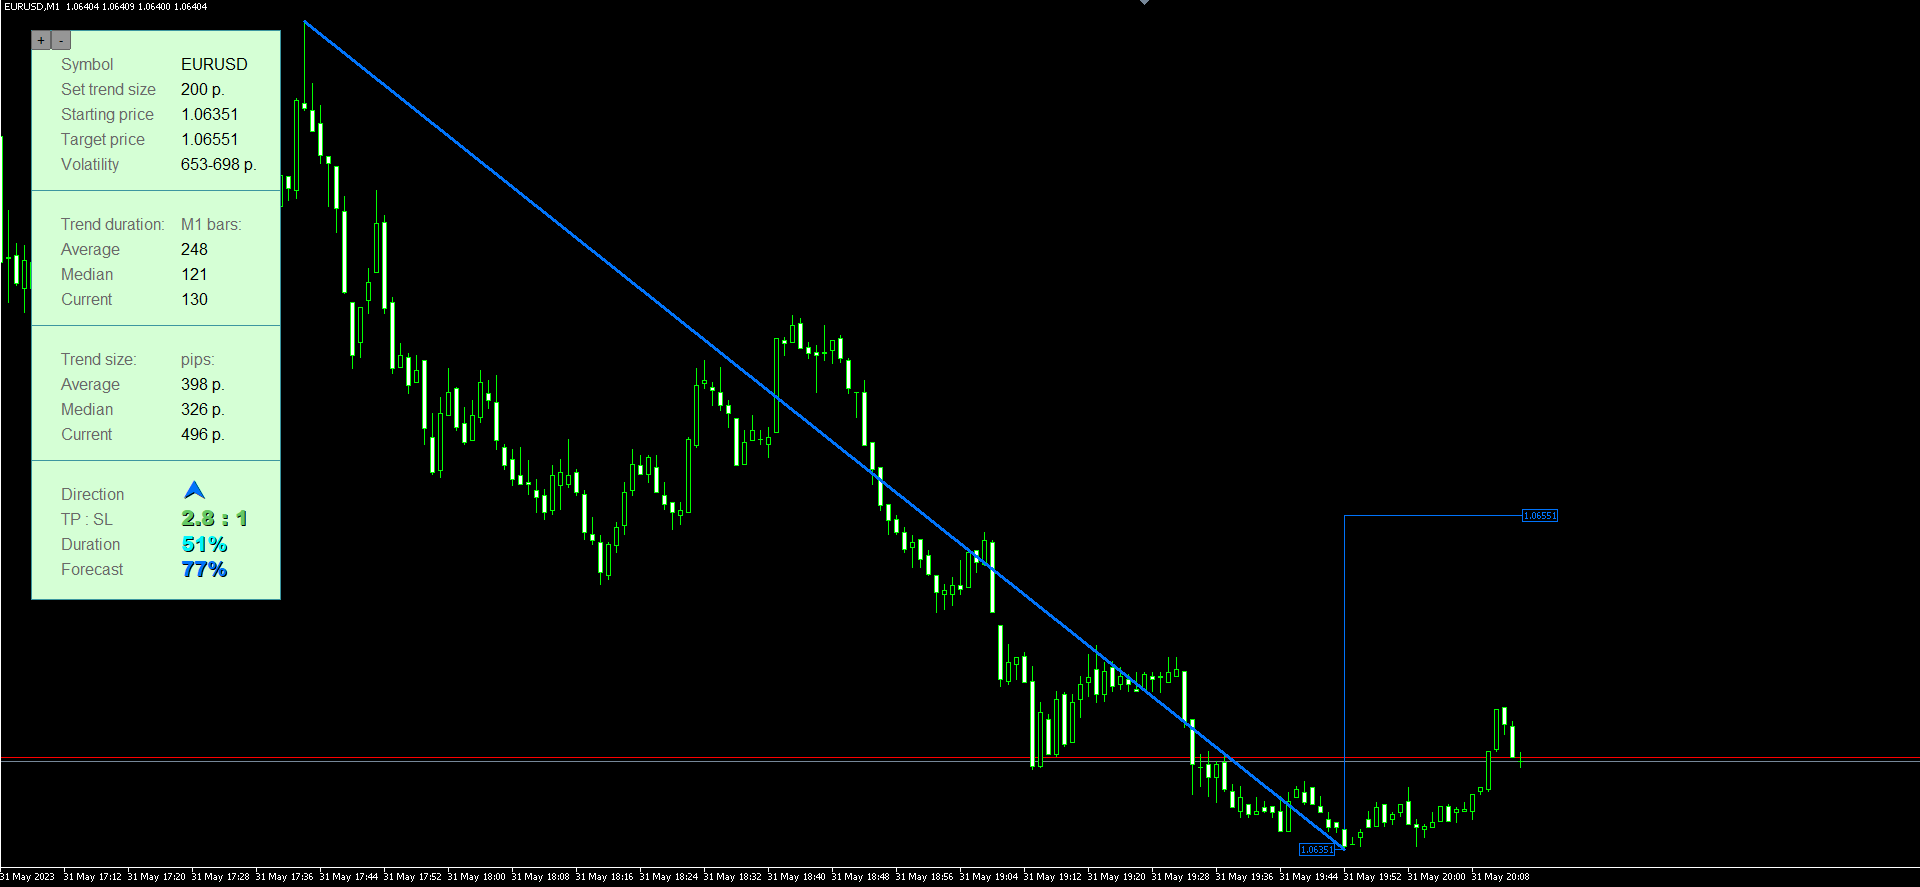
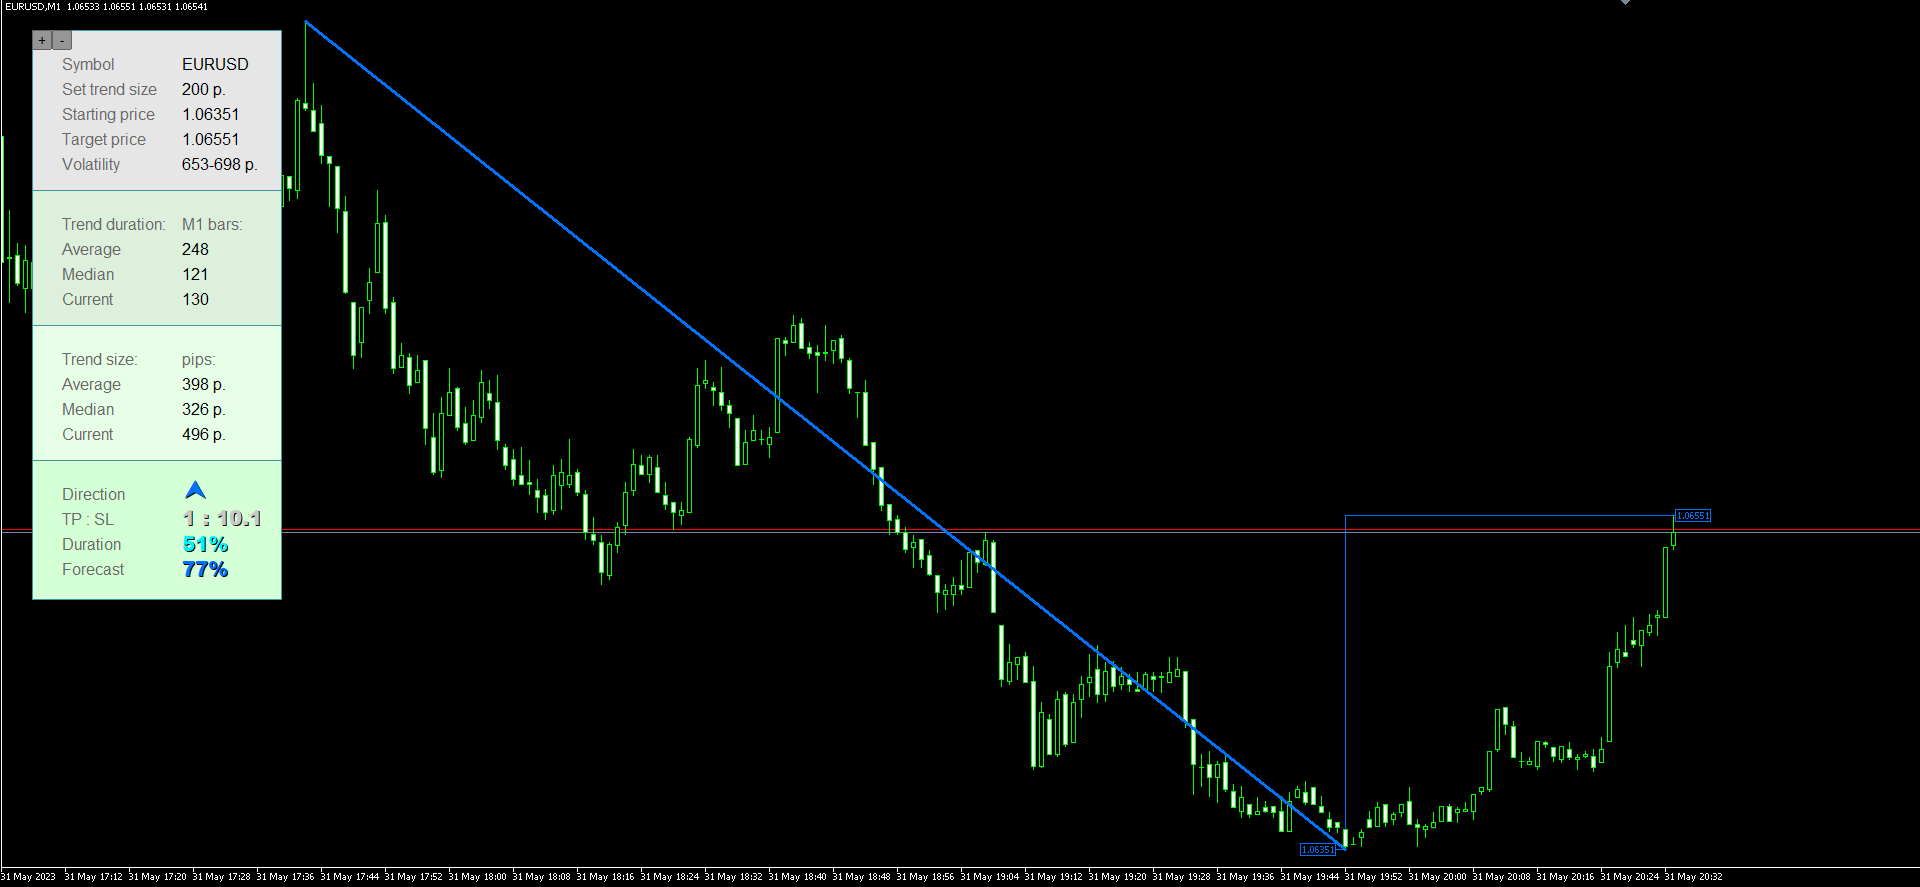
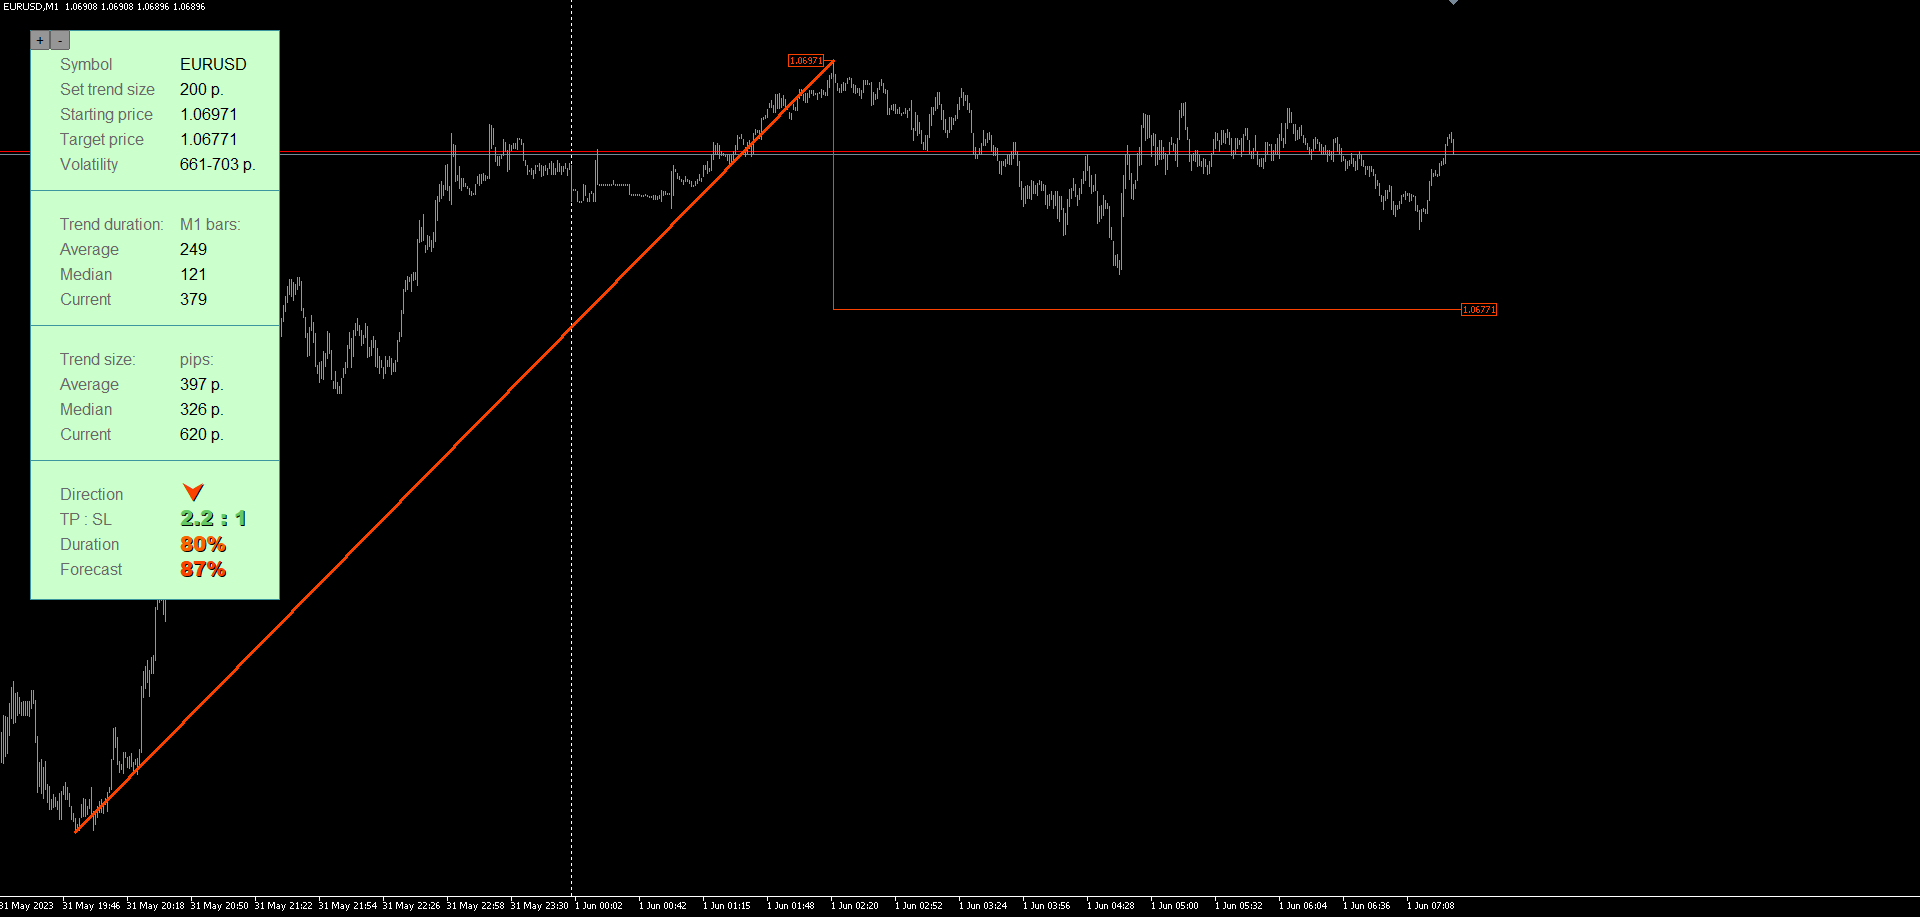
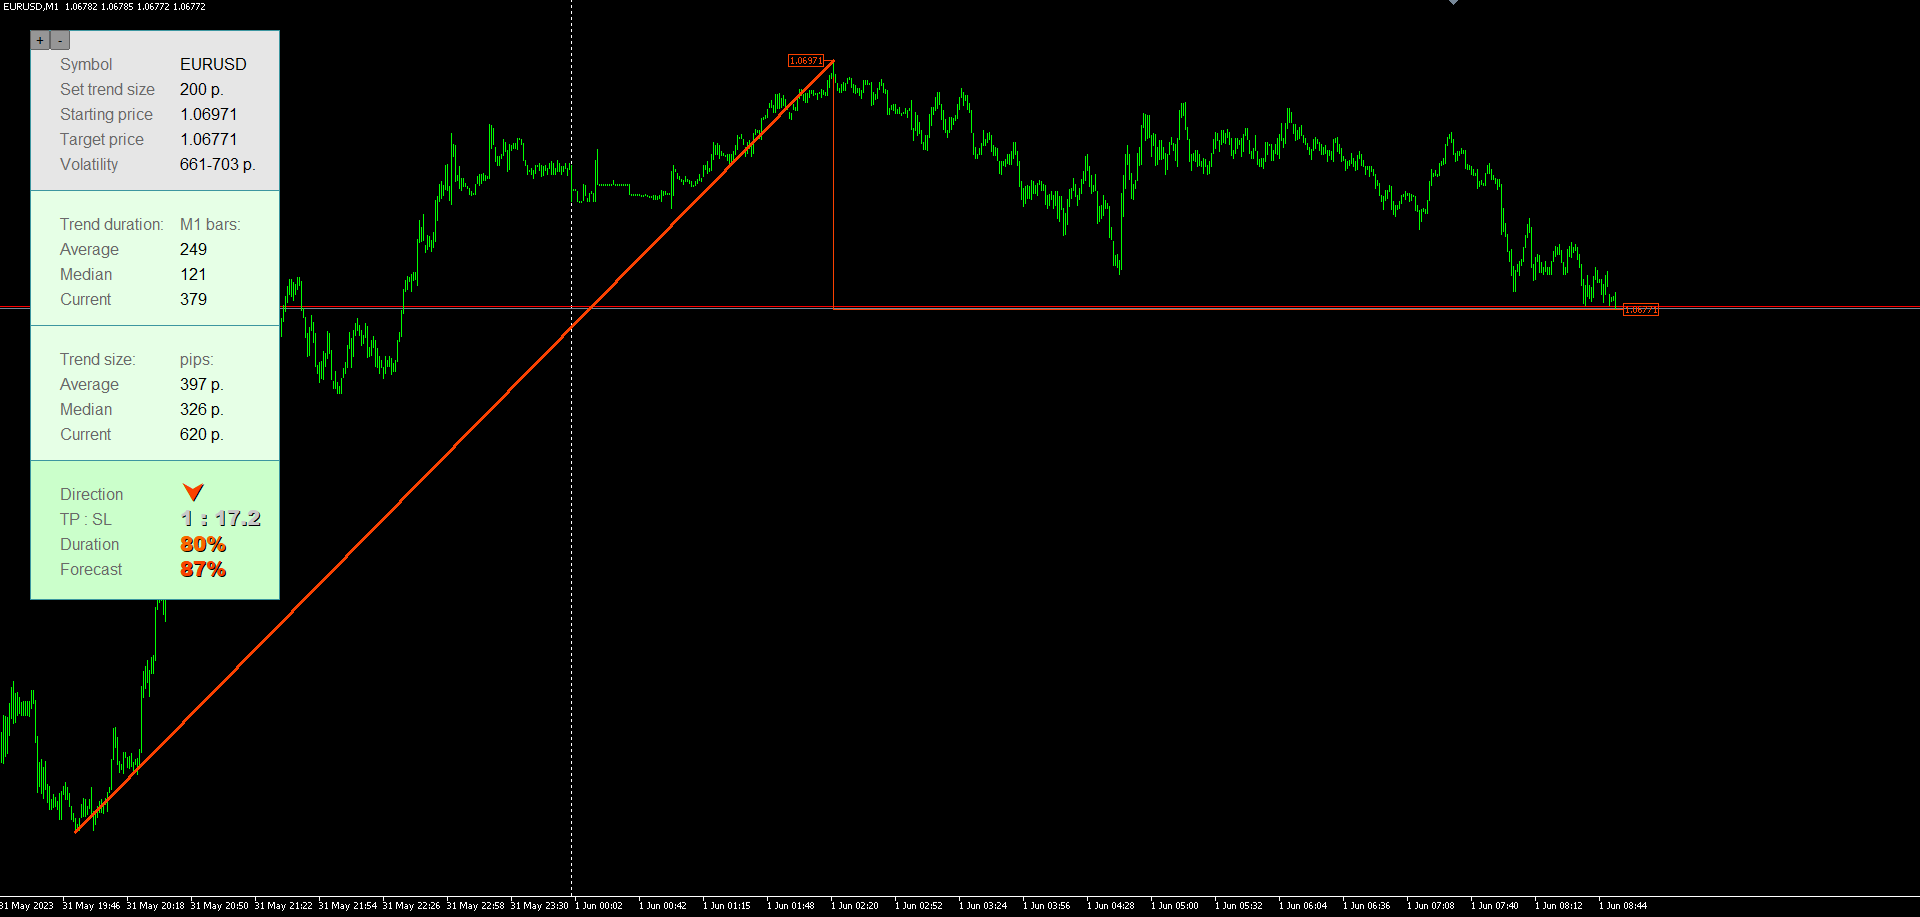
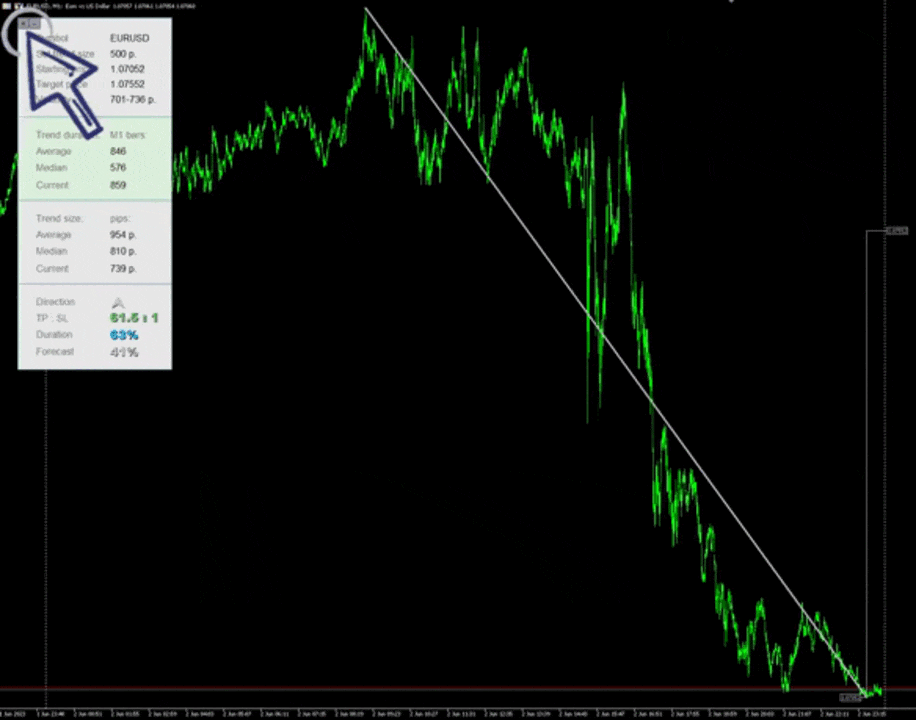
Panel

  • Symbol – current financial instrument
  • Set trend size – trend size set in settings
  • Starting price – start price of the last calculated (current) trend
  • Target price – the price level to which the price can reach with a calculated probability.
  • Volatility – This is the average daily volatility of a financial instrument. Consists of two numbers: 1 – median volatility, 2 – average volatility.
  • Average – this is an arithmetic indicator of the average duration of a trend, after which a reversal occurs by the number of points specified in the settings: the durations of all specified trends in history are calculated and divided by their number. Information for your information.
  • Median – This is the duration of the trend at which a reversal most often occurs. For example, you set a trend of 500 pips. The indicator calculates and displays the median of 700 minutes (M1 bars). This means that for a given trend of 500 pips on history, it most often grew for 700 minutes, after which it reversed by a given 500 pips. An additional internal signal for a trend reversal.
  • Current – current duration of the specified trend. Until the trend goes in the opposite direction for the number of points specified in the settings, the current trend will continue to grow.
  • Average – this is an arithmetic indicator of the average size of a trend, after which a reversal occurs by the number of points specified in the settings: the sizes of all specified trends in history are calculated and divided by their number. Information for your information.
  • Median – This is the size of the trend at which a reversal is most likely to occur. For example, you set a trend of 500 pips. The indicator calculates and displays the median of 800 pips. This means that for a given trend of 500 pips on history, it most often grew to 800 pips, after which it reversed by the given 500 pips. This is the main signal of the indicator. The general trading logic is based on this: wait for a favorable price and enter at the level of the expected reversal.
  • Current – the current size of the specified trend. Until the trend goes in the opposite direction for the number of points specified in the settings, the current trend will continue to grow.
  • TP : SL – the ratio of potential take profit to potential stop loss depending on the location of the current price relative to the nearest extremum in the direction of the current trend and the calculated price. The closer the price is to the extreme, the more profitable the price and vice versa.
  • Direction – direction of a potential transaction. If the current trend is growing upward, then the direction of the transaction will be downward (we enter, expecting a reversal at the points we have specified), and vice versa.
  • Duration – reversal forecast according to trend duration in minutes. Additional local signal indicator.
  • Forecast – reversal forecast according to the trend size in points. The main signal of the indicator.

Additionally

The best signals are obtained on flat financial instruments, where the price most often moves within ranges. Palantir is an auxiliary indicator; it only serves as an additional signal in your trading strategy. You shouldn’t rely solely on it; use confirming signals. For those trading grid/averaging/martingale, Palantir can serve as a filter for entry. For example, you can open positions when the indicator reading is above 50%. Further, if a reversal did not occur and the previous trend continued to grow, then average at higher readings. You can zoom in or out of the window by clicking “+/-” in the upper left corner. Convenient for high resolutions. Each block is highlighted in color depending on the signal strength.

Recommendations

  • Currency pair: any, but a less volatile one is better
  • Timeframe: any on which it will be convenient for you to view the chart
  • Strategy: any, where you find application. You can either average at values of 50% or more, or you can use it as an additional signal to your trading system

Try also my other products in the market https://www.mql5.com/ru/users/capitalplus/seller


Recommended products
RBreaker
Zhong Long Wu
RBreaker Gold Indicators is a short-term intraday trading strategy for gold futures that combines trend following and intraday reversal approaches. It not only captures profits during trending markets but also enables timely profit-taking and counter-trend trading during market reversals. This strategy has been ranked among the top ten most profitable trading strategies by the American magazine   Futures Truth   for 15 consecutive years. It boasts a long lifecycle and remains widely used and st
Noize Absorption Index - is the manual trading system that measures the difference of pressure between bears forces and bulls forces. Green line - is a noize free index that showing curent situation. Zero value of index shows totally choppy/flat market.Values above zero level shows how powerfull bullish wave is and values below zero measures bearish forces.Up arrow appears on bearish market when it's ready to reverse, dn arrow appears on weak bullish market, as a result of reverse expectation.
CosmiCLab SMC FIBO CosmiCLab SMC FIBO is a professional trading indicator designed for traders who use Smart Money Concepts (SMC), market structure analysis and Fibonacci retracement levels. The indicator automatically detects market swings and builds Fibonacci levels based on the latest impulse movement. It also identifies market structure changes such as BOS (Break of Structure) and CHOCH (Change of Character), helping traders understand the current market direction. CosmiCLab SMC FIBO also pr
Trend Monitor MT5
Pavel Zamoshnikov
4.5 (2)
The indicator generates early signals basing on ADX reading data combined with elements of price patterns. Works on all symbols and timeframes. The indicator does not redraw its signals. You see the same things on history and in real time. For better visual perception signals are displayed as arrows (in order not to overload the chart). Features The best results are obtained when the indicator works on two timeframes. For example: M30 – the indicator shows the main trend; M5 – the indicator gen
HMA Trend Professional MT5
Pavel Zamoshnikov
4.25 (4)
Improved version of the free HMA Trend indicator (for MetaTrader 4) with statistical analysis. HMA Trend is a trend indicator based on the Hull Moving Average (HMA) with two periods. HMA with a slow period identifies the trend, while HMA with a fast period determines the short-term movements and signals in the trend direction. The main differences from the free version: Ability to predict the probability of a trend reversal using analysis of history data. Plotting statistical charts for analyzi
Universal Soul Reaper
Pieter Gerhardus Van Zyl
Universal Soul Reaper is an atmospheric market-flow oscillator designed to interpret price behavior as a cycle of spiritual energy. Instead of reacting to raw price alone, it visualizes the state of the market’s soul —revealing when momentum is awakening, stabilizing, or fading. The indicator operates in a separate window and presents three interwoven entities: the Ectoplasmic Veil , the Spirit Boundary , and the Soul Core . Together, they form a living framework that helps traders sense pressu
STRICTLY FOR BOOM INDEX ONLY!!!!! Here I bring the Maximum Trend Arrows OT1.0 MT5 indicator. This indicator is made up of a combination of different trend indicators for entries and exits, for entries an orange arrow will paint on the chart below the current market and a red flag for closing of trades and it produces buy arrows only. When the orange arrow appears, it will appear along with it's sound to notify you. The 1H timeframe is recommended, don't use it anywhere else than on the 1H timefr
Trend Master V2
Oratile Pitsoane
What Is Trend Master Pro? Trend Master Pro   is a professional-grade trend trading indicator built for MetaTrader 5. It was designed with one goal in mind — to keep you on the right side of the market at all times by combining three powerful technical tools into a single, clean, easy-to-read display directly on your price chart. Instead of cluttering your screen with multiple separate indicators, Trend Master Pro fuses an   EMA Ribbon trend filter , a   ZigZag swing point engine , and a   breako
TRI Visualizer
Yoshimi Mon 三 Ura
TRI Visualizer MT5 – Thermodynamic Market Analysis Overview The TRI (Thermal Range Indicator) Visualizer Enhanced is a rare market analysis indicator that goes beyond conventional technical analysis, applying principles of thermodynamics from physics. It interprets market price fluctuations as “thermodynamic energy,” enabling the highly accurate detection of subtle market changes that are often overlooked. Innovative Mechanisms 1. Dual Calculation Engines Classic TRI Mode Formula: |Close
Swing Tracer
Ely Alsedy
5 (1)
it depends on ATR period to get swing points to help make better trading decisions  blue dot and red dot is the default color scheme of course you can change it later if you'd like  you can change the following : ATR PERIOD  sending notifications number of times to send notifications  sending notifications to your smart phone that's it very simple to use just drag and drop and follow the trend 
The RSI Divergence + FVG Signal indicator combines Relative Strength Index (RSI) Divergence with Fair Value Gap (FVG) detection to generate high-probability buy and sell signals based on both momentum shifts and institutional imbalance zones. Core Features: RSI Divergence Detection : Identifies both regular and hidden bullish/bearish divergences between price and RSI. Divergences indicate potential trend reversals or continuation. FVG Zone Recognition : Detects Fair Value Gaps (imbalances caused
TrendDetect
Pavel Gotkevitch
The Trend Detect indicator combines the features of both trend indicators and oscillators. This indicator is a convenient tool for detecting short-term market cycles and identifying overbought and oversold levels. A long position can be opened when the indicator starts leaving the oversold area and breaks the zero level from below. A short position can be opened when the indicator starts leaving the overbought area and breaks the zero level from above. An opposite signal of the indicator can b
Auto Optimized RSI   is a smart and easy-to-use arrow indicator designed for precision trading. It automatically finds the most effective RSI Buy and Sell levels for your selected symbol and timeframe using real historical data simulations. The indicator can be used as a standalone system or as part of your existing trading strategy. It is especially useful for intraday trading. Unlike traditional RSI indicators that rely on fixed 70/30 levels,   Auto Optimized RSI   dynamically adjusts its lev
Double HMA MTF for MT5
Pavel Zamoshnikov
4 (4)
This is an advanced multi-timeframe version of the popular Hull Moving Average (HMA) Features Two lines of the Hull indicator of different timeframes on the same chart. The HMA line of the higher timeframe defines the trend, and the HMA line of the current timeframe defines the short-term price movements. A graphical panel with HMA indicator data from all timeframes at the same time . If the HMA switched its direction on any timeframe, the panel displays a question or exclamation mark with a tex
Price Magnet — Price Density and Attraction Levels Indicator Price Magnet is a professional analytical tool designed to identify key support and resistance levels based on statistical Price Density. The indicator analyzes a specified historical period and detects price levels where the market spent the most time. These zones act as “magnets,” attracting price action or forming a structural base for potential reversals. Unlike traditional Volume Profile tools, Price Magnet focuses on price-time d
The Trend Duration Forecast MT5 indicator is designed to estimate the probable lifespan of a bullish or bearish trend. Using a Hull Moving Average (HMA) to detect directional shifts, it tracks the duration of each historical trend and calculates an average to forecast how long the current trend is statistically likely to continue. This allows traders to visualize both real-time trend strength and potential exhaustion zones with exceptional clarity. KEY FEATURES Dynamic Trend Detection:   Utiliz
HAS RSI Signal — Professional Trend Indicator with SL/TP Calculation HAS RSI Signal is a powerful trading tool that combines time-tested classics with modern noise-filtering algorithms. The indicator analyzes the market through the prism of Heiken Ashi Smoothed candles and the RSI oscillator, providing clear entry signals at trend reversals or when exiting overbought/oversold zones. Key Advantages: Double Filtration: Using Heiken Ashi Smoothed eliminates market "noise," while RSI confirms the mo
Rigonstructor
Mark Lapukha
5 (1)
This is a unique tool, a constructor that combines signals from standard indicators built into MT5 into one common arrow. The arrows do not repaint and have buffers 0 and 1 for passing signals to the software. This arrow indicator will allow you to easily combine signals from different indicators, creating dozens and hundreds of different variations for your ideas from which you can get powerful trading strategies. Using the built-in profit analysis function, you can instantly evaluate the poten
This is an MTF indicator of support and resistance levels based on Advanced ZigZag Dynamic and/or Extended Fractals indicator extremums with price labels (can be disabled). More higher TFs can be selected for MTF mode. By default, the levels are generated based on ZigZag indicator dots. Fractals indicator dots can also be used together with ZigZag or instead of it. In order to simplify the use and save CPU time, calculation is performed once per each bar at its opening. Parameters: ForcedTF - ch
Caicai L&S Yield Histogram Important Notice: This indicator is an integral tool of the automated EA Caicai Long and Short Pair Trading . This indicator visually displays the percentage deviation (Yield %) of a pair's current spread relative to its own historical mean. It is an excellent tool for quickly visualizing the gross financial potential of a market distortion in Long & Short operations. Main Features: Percentage Visualization: Understand the size of the distortion in palpable percentage
The   Trendlines Oscillator   helps traders identify trends and momentum based on the normalized distances between the current price and the most recently detected bullish and bearish trend lines. The indicator features bullish and bearish momentum, a signal line with crossings, and multiple smoothing options. USAGE The   Trendlines Oscillator   works by systematically: Identifying pivot highs and lows. Connecting pivots to form bullish (support) and bearish (resistance) trendlines. Measuring
Terra Infinity is a flat indicator. This improved version of the CalcFlat indicator has three additional lines that significantly increase its effectiveness. Unlike its predecessor with two static levels, Terra Infinity adds three dynamic lines above the main histogram, which are interpreted as follows: base signal line, minimum signal line, maximum signal line. These lines are formed using the additional parameter Avg, which is the average value of the histogram. Averaging produces a line cl
Fit line supports to extrapolation next movement of market, support for buy/sell decision. Indicator using spline algorithm to extrapolation.  You can change number of spline with parameter "PointsNumber" and number of extrapolation point with "ExtrapolateBars". Eextrapolation points will be save into csv format, with prefix in parameter "PointsPrefix", and store in folder File of Data Folder.
CosmiCLab METEORIT — SMC Fibo ZigZag CosmiCLab METEORIT is a professional Smart Money Concepts indicator designed for traders who want to identify institutional market movements. The indicator combines market structure analysis, liquidity sweeps, automatic Fibonacci levels and a smart ZigZag engine to help traders detect high-probability trading zones. It is designed for intraday trading on M15 and H1 , but also works well on other timeframes. Key Features Smart ZigZag market structure engine
First of all Its worth emphasizing here that this Trading Tool is Non Repainting , Non Redrawing and Non Lagging Indicator , Which makes it ideal for professional trading . [Online course] ,   and   [manual] The Smart Price Action Concepts Indicator is a very powerful tool for both new and experienced traders . It packs more than 20 useful indicators into one , combining advanced trading ideas like Inner Circle Trader Analysis and Smart Money Concepts Trading Strategies . This indicator focuses
Ichimoku Aiko MTF
Michael Jonah Randriamampionontsoa
Ichimoku Aiko MTF is a collection of technical indicators that show support and resistance levels, as well as momentum and trend direction. It is a multi-timeframe indicator so you don't need to change the chart timeframe when you want to see the ichimoku clouds on a higher timeframe.  eg. The chart timeframe is M15 and you want to see on the M15 timeframe chart the H1 ichimoku indicators (the ichimoku in Metatrader can't do that) that's why you need to use Ichimoku Aiko MTF.
# DRAWDOWN INDICATOR V4.0 - The Essential Tool to Master Your Trading ## Transform Your Trading with a Complete Real-Time Performance Overview In the demanding world of Forex and CFD trading, **knowing your real-time performance** isn't a luxury—it's an **absolute necessity**. The **Drawdown Indicator V4.0** is much more than a simple indicator: it's your **professional dashboard** that gives you a clear, precise, and instant view of your trading account status. --- ## Why This Indicator
KasTon Trend System: The Complete 2-in-1 Trading Strategy Identify the Trend, Confirm the Signal, and Trade with Confidence! Do you suffer from confusion while trading? Do you find it difficult to determine the market's direction? Are you tired of losing money on false signals? The KasTon Trend System is here as an integrated solution to all these problems. This is not just an indicator; it is a complete trading strategy built on the synergy of two powerful, custom-built indicators. Our main g
Premium level is a unique indicator with more than 80% accuracy of correct predictions! This indicator has been tested for more than two months by the best Trading Specialists! The author's indicator you will not find anywhere else! From the screenshots you can see for yourself the accuracy of this tool! 1 is great for trading binary options with an expiration time of 1 candle. 2 works on all currency pairs, stocks, commodities, cryptocurrencies Instructions: As soon as the red arrow app
MACDivergence MTF MT5
Pavel Zamoshnikov
4 (5)
Advanced ideas of the popular MACD indicator: It detects and displays classic and reverse divergences (two methods of detecting divergences). It uses different color to highlight an uptrend and a downtrend. Two methods of determining a trend: а) MACD crosses the 0 level (classic signal); б) MACD crosses its own average (early signal). This is a multi-timeframe indicator: it can display MACD data from other timeframes. Two methods of drawing: classic histogram and line. It generates sound and vis
Buyers of this product also purchase
SuperScalp Pro
Van Minh Nguyen
4.63 (24)
SuperScalp Pro – Advanced Multi-Filter Scalping Indicator System SuperScalp Pro is an advanced scalping indicator that combines the classic Supertrend with multiple intelligent confirmation filters to help identify trading opportunities. It works efficiently across multiple timeframes from M1 to H4, with optimized performance on XAUUSD, BTCUSD, and major Forex pairs. The indicator provides clear Buy and Sell signals, along with automatically calculated entry price, stop loss, and take profit lev
Divergence Bomber
Ihor Otkydach
4.9 (89)
Each buyer of this indicator also receives the following for free: The custom utility "Bomber Utility", which automatically manages every trade, sets Stop Loss and Take Profit levels, and closes trades according to the rules of this strategy Set files for configuring the indicator for various assets Set files for configuring Bomber Utility in the following modes: "Minimum Risk", "Balanced Risk", and "Wait-and-See Strategy" A step-by-step video manual to help you quickly install, configure, and s
ARIPoint
Temirlan Kdyrkhan
ARIPoint is a powerful trading companion designed to generate high-probability entry signals with dynamic TP/SL/DP levels based on volatility. Built-in performance tracking shows win/loss stats, PP1/PP2 hits, and success rates all updated live. Key Features: Buy/Sell signals with adaptive volatility bands Real-time TP/SL/DP levels based on ATR Built-in MA Filter with optional ATR/StdDev volatility Performance stats panel (Success, Profit/Loss, PP1/PP2) Alerts via popup, sound, push, or email Cu
Entry In The Zone and SMC Multi Timeframe is a real-time 2-in-1 market analysis tool that combines market structure analysis and a No Repaint BUY / SELL signal system into a single indicator, built on Smart Money Concepts (SMC) — a widely adopted framework used by professional traders to understand market structure. This indicator helps you see the market more clearly, make decisions based on structure rather than guesswork, and focus on high-probability zones where price is more likely to react
SignalTech MT5 is an unique fully rule based trading system for EURUSD, USDCHF, USDJPY, AUDUSD, NZDUSD, EURJPY, AUDJPY, NZDJPY, CADJPY.  All the winning trades with chart setups are published on the comments page. 2026-05 2802 Pips (Until 05-15 NY Closed) 2026-04 2243 Pips 2026-03 2165 Pips 2026-02 2937 Pips 2026-01 2624 Pips 2025-12 1174 Pips It can generate signals with Buy/Sell Arrows and Pop-Up/Sound Alerts. Each signal has clear Entry and Stop Loss levels, which should be automatically flag
Power Candles MT5
Daniel Stein
5 (8)
Power Candles V3 - Self-Optimizing Strength Indicator Power Candles V3 turns currency and instrument strength into an actionable trade plan on every chart it is attached to. Instead of just coloring candles, it runs a live auto-optimization in the background and hands you the best Stop Loss, Take Profit and signal threshold for the symbol in front of you. One click adopts it for live trading - entry, Stop Loss and Take Profit rays appear on the chart at the exact prices, and alerts fire with dir
New Update of   Smart Trend Trading System MT5 For  2026 Market: If You Buy this Indicator you will Get my Professional Trade Manager + EA  for FREE . First of all Its worth emphasizing here that this Trading System is Non-Repainting   , Non Redrawing and Non Lagging Indicator Which makes it ideal from both manual and robot trading .  [Online course] , [manual] and [download presets] . The Smart Trend Trading System MT5 is a comprehensive trading solution tailored for new and experienced traders
Let's be honest first. No indicator will make you profitable on its own. If someone tells you otherwise, they're selling you a dream. Every indicator that shows perfect buy/sell arrows can be made to look flawless — just zoom into the right window of history and screenshot the winners. We won't do that. SMC Intraday Formula is a tool. It reads the market structure for you, maps the highest-probability price zones, and tells you exactly what the smart money footprint looks like right now — in pl
Gann Made Easy   is a professional and easy to use Forex trading system which is based on the best principles of trading using the theory of W.D. Gann. The indicator provides accurate BUY and SELL signals including Stop Loss and Take Profit levels. You can trade even on the go using PUSH notifications. PLEASE CONTACT ME AFTER PURCHASE TO GET TRADING  INSTRUCTIONS   AND GREAT EXTRA INDICATORS   FOR FREE! Probably you already   heard   about the Gann trading methods before. Usually the Gann theory
Introducing   Quantum Breakout PRO , the groundbreaking MQL5 Indicator that's transforming the way you trade Breakout Zones! Developed by a team of experienced traders with trading experience of over 13 years,   Quantum Breakout PRO   is designed to propel your trading journey to new heights with its innovative and dynamic breakout zone strategy. Quantum Breakout Indicator will give you signal arrows on breakout zones with 5 profit target zones and stop loss suggestion based on the breakout b
Trend Screener Pro MT5
STE S.S.COMPANY
4.85 (104)
Trend Screener Indicator --Professional Trend Trading & Market Scanning System for MetaTrader Unlock the true power of trend trading with Trend Screener Indicator — a complete multi-currency, multi-timeframe trend analysis solution powered by Fuzzy Logic,Trend Pulse Technology  and advanced market structure algorithms.   Trend Screener transforms your MetaTrader platform into a professional-grade Trend Analyzer and Market Scanner, helping you identify high-probability trend opportunities, early
Azimuth Pro
Ottaviano De Cicco
5 (7)
Azimuth Pro V2: Synthetic Fractal Structure and Confirmed Entries for MT5 Overview Azimuth Pro is a multi-level swing structure indicator by Merkava Labs . Four nested swing layers, swing-anchored VWAP, ABC pattern detection, three-timeframe structural filtering, and closed-bar confirmed entries — one chart, one workflow from micro-swings to macro-cycles. This is not a blind signal product. It is a structure-first workflow for traders who care about location, context, and timing. V2 Launch Offe
Meridian Pro
Ottaviano De Cicco
5 (2)
Meridian Pro 2.00: Professional Multi-Timeframe Trend Matrix for MT5 Meridian Pro 2.00 is a professional adaptive trend matrix for MetaTrader 5. It combines the original Meridian trend engine, a clean chart ribbon, closed-bar signal arrows, an 8-timeframe dashboard, Fuel momentum, weighted consensus, synthetic HTF processing and chart-native higher-timeframe context lines. The goal is simple: read current trend, multi-timeframe structure, strength, momentum and EA-ready state from one discipline
FX Trend MT5 NG
Daniel Stein
5 (4)
FX Trend NG: The Next Generation Multi-Market Trend Intelligence Overview FX Trend NG is a professional multi-timeframe trend and market monitoring tool designed to give you a complete structural overview of the market in seconds. Instead of switching between dozens of charts, you instantly see which symbols are trending, where momentum is fading, and where strong alignment exists across timeframes. This tool is part of the Stein Investments ecosystem - 18+ tools plus Max, your 1-on-1 AI tradi
Market Structure Order Block Dashboard MT5 is an MT5 indicator designed for traders who want to read market structure and the main price reaction zones directly on the chart. It combines BOS, ChoCH, Order Blocks, Fair Value Gaps (FVG), Liquidity, Kill Zones, Volume Profile, and a compact dashboard for quick analysis. This indicator targets traders who use market structure, ICT and Smart Money concepts as a decision framework. It can help spot trend continuations, possible reversals, price imbala
KT Alpha Hunter Arrows MT5
KEENBASE SOFTWARE SOLUTIONS
Most arrow indicators give you a signal and leave you to figure out the rest. KT Alpha Hunter Arrows gives you the full trading plan. Every signal arrow prints with a full plan already drawn: entry line, stop-loss, four take-profit levels, and a live edge verdict telling you whether this symbol and time-frame is worth trading right now. An included Trade Manager EA handles the execution after you enter, so discipline stays intact when the market gets loud. Non-repaint. Closed-bar signals only. B
Gem SIGNAL
Shengzu Zhong
5 (1)
GEM Signal Pro GEM Signal Pro is a trend-following indicator for MetaTrader 5, designed for traders who want clearer signals, more structured trade setups, and practical risk management directly on the chart. Instead of showing only a simple arrow, GEM Signal Pro helps present the full trade idea in a cleaner and more readable way. When conditions are confirmed, the indicator can display the entry price, stop loss, and take profit targets on the chart, helping traders review the setup more effic
Top indicator for MT5   providing accurate signals to enter a trade without repainting! It can be applied to any financial assets:   forex, cryptocurrencies, metals, stocks, indices .  Watch  the video  (6:22) with an example of processing only one signal that paid off the indicator! MT4 version is here It will provide pretty accurate trading signals and tell you when it's best to open a trade and close it. Most traders improve their trading results during the first trading week with the help of
This dashboard shows the latest available   harmonic patterns   for the selected symbols, so you will save time and be more efficient /   MT4 version . Free Indicator:   Basic Harmonic Pattern Comparison of "Basic Harmonic Pattern" vs. "Basic Harmonic Patterns Dashboard" Indicators Feature Basic Harmonic Pattern Basic Harmonic Patterns Dashboard Functionality Detects and displays harmonic patterns on a single chart Searches multiple symbols and timeframes for harmonic patterns, displays res
Btmm state engine pro
Garry James Goodchild
5 (4)
BTMM State Engine Pro is a MetaTrader 5 indicator for traders who use the Beat The Market Maker approach: Asian session context, kill zone timing, level progression, peak formation detection, and a multi-pair scanner from a single chart. It combines cycle state logic with a built-in scanner dashboard so you do not need the same tool on many charts at once. What it does Draws the Asian session range; session times can follow broker server offset or be set in inputs. Tracks level progression (L
Quantum TrendPulse
Bogdan Ion Puscasu
5 (25)
Introducing Quantum TrendPulse , the ultimate trading tool that combines the power of SuperTrend , RSI , and Stochastic into one comprehensive indicator to maximize your trading potential. Designed for traders who seek precision and efficiency, this indicator helps you identify market trends, momentum shifts, and optimal entry and exit points with confidence. Key Features: SuperTrend Integration: Easily follow the prevailing market trend and ride the wave of profitability. RSI Precision: Detect
Trend Forecaster
Alexey Minkov
5 (7)
Trend Forecaster – Since 2023. The Trend Forecaster indicator utilizes a unique proprietary algorithm to determine entry points for a breakout trading strategy. The indicator identifies price clusters, analyzes price movement near levels, and provides a signal when the price breaks through a level. The Trend Forecaster indicator is suitable for all financial assets, including currencies (Forex), metals, stocks, indices, and cryptocurrencies. You can also adjust the indicator to work on any time
Atomic Analyst MT5
Issam Kassas
3.94 (31)
New Update of   Atomic Analyst MT5 For  2026 Market: If You Buy this Indicator you will Get my Professional   Trade Manager + EA  for   FREE . First of all Its worth emphasizing here that this Trading Indicator is   Non-Repainting   , Non Redrawing and Non Lagging Indicator   Indicator, Which makes it ideal from both manual and robot trading.  User manual: settings, inputs and strategy . The Atomic Analyst  is a PA Price Action Indicator that uses Strength and Momentum of the price to find a bet
OrderFlux | Footprint Orderflow for MetaTrader 5 Version 2.0 – Real-time Bid/Ask Visualization for Active Traders OrderFlux is a footprint and orderflow indicator for MT5. It shows not only where the price has moved, but what happens inside the movement: Bid/Ask volume per price level, delta, imbalance, and volume distribution. Many charts only show you the final result of a candle. OrderFlux shows you the path to get there. This is exactly what helps when you want to read market participation i
FX Power MT5 NG
Daniel Stein
5 (31)
FX Power: Analyze Currency Strength for Smarter Trading Decisions Overview FX Power is your go-to tool for understanding the real strength of currencies and Gold in any market condition. By identifying strong currencies to buy and weak ones to sell, FX Power simplifies trading decisions and uncovers high-probability opportunities. Whether you’re looking to follow trends or anticipate reversals using extreme delta values, this tool adapts seamlessly to your trading style. Don’t just trade—trade
Grabber System MT5
Ihor Otkydach
4.83 (23)
Let me introduce you to an excellent technical indicator – Grabber, which works as a ready-to-use "All-Inclusive" trading strategy. Within a single code, it integrates powerful tools for technical market analysis, trading signals (arrows), alert functions, and push notifications. Every buyer of this indicator also receives the following for free: Grabber Utility for automatic management of open orders Step-by-step video guide: how to install, configure, and trade with the indicator Custom set fi
RelicusRoad Pro MT5
Relicus LLC
4.96 (24)
RelicusRoad Pro: Quantitative Market Operating System 70% OFF LIFETIME ACCESS (LIMITED TIME) - JOIN 2,000+ TRADERS Why do most traders fail even with "perfect" indicators? Because they trade Single Concepts in a vacuum. A signal without context is a gamble. To win consistently, you need CONFLUENCE . RelicusRoad Pro is not a simple arrow indicator. It is a complete Quantitative Market Ecosystem . It maps the "Fair Value Road" price travels on, distinguishing between random noise and true structur
Contact me after purchase to get EA based on this indicator as Bonus ChandraSAR Optimizer: The Self-Adapting Quantitative Trend Engine Most trend indicators fail for one simple reason: markets change, but static parameters don't. ChandraSAR Optimizer bridges the gap between simple signal generation and advanced algorithmic testing. It is a dynamic trend-following system for MetaTrader 5 that solves the problem of shifting volatility by embedding a highly efficient, array-based Walk-Forward opti
Hydra Trend Rider is a non-repainting, multi-timeframe trend indicator that delivers precise buy/sell signals and real-time alerts for high-probability trade setups. With its color-coded trend line, customizable dashboard, and mobile notifications, it's perfect for traders seeking clarity, confidence, and consistency in trend trading. Setup & Guide:  Download  MT4 Version here. To learn how to use the Indicator: Indicator Manual & Guide -   Read Here Follow our MQL5 channel for daily market ins
Trend Lines PRO MT5
Roman Podpora
5 (1)
TREND LINES PRO  -   helps understand where the market is truly changing direction. The indicator shows real trend reversals and points where major players re-enter. You see   BOS lines   Trend changes and key levels on higher timeframes — without complex settings or unnecessary noise. Signals don't repaint and remain on the chart after the bar closes. MT4 VERSION   - Reveals its maximum potential when combined with the   RFI LEVELS PRO   indicator What the indicator shows: Real shifts   trend
More from author
The SMC Venom Model BPR indicator is a professional tool for traders working within the Smart Money (SMC) concept. It automatically identifies two key patterns on the price chart: FVG (Fair Value Gap) is a combination of three candles, in which there is a gap between the first and third candles. It forms a zone between levels where there is no volume support, which often leads to a price correction. BPR (Balanced Price Range) is a combination of two FVG patterns that form a “bridge” - a zone of
Fractals Dynamic Fractals Dynamic   – is a modified free fractal indicator by Bill Williams, in which you can manually set the number of bars on the left and right, thereby building unique patterns on the chart. Now all trading strategies based on or based on the Fractals Dynamic indicator will have an additional signal. In addition, fractals can act as support and resistance levels. And in some trading strategies, show liquidity levels. For this purpose, levels were introduced in this version
FREE
Development of the previous version of the indicator ZigZag WaveSize MT4 ZigZag WaveSize - modified standard ZigZag indicator with added information about wave length in points, levels, and different alert logic General Improvements: Code adaptation for MetaTrader 5 Optimized work with graphical objects New Features: Horizontal levels at extremes Selection of level types: horizontal/rays/segments Filter for liquidity levels (not broken by price) Buffer for breakouts: adjusting sensitivity to f
FREE
The SMC Venom Model BPR indicator is a professional tool for traders working within the Smart Money (SMC) concept. It automatically identifies two key patterns on the price chart: FVG   (Fair Value Gap) is a combination of three candles, in which there is a gap between the first and third candles. It forms a zone between levels where there is no volume support, which often leads to a price correction. BPR   (Balanced Price Range) is a combination of two FVG patterns that form a “bridge” - a zon
Fractals Dynamic Fractals Dynamic   – is a modified free fractal indicator by Bill Williams, in which you can manually set the number of bars on the left and right, thereby building unique patterns on the chart. Now all trading strategies based on or based on the Fractals Dynamic indicator will have an additional signal. In addition, fractals can act as support and resistance levels. And in some trading strategies, show liquidity levels. For this purpose, levels were introduced in this version
FREE
ZigZag WaveSize MT4
Ivan Butko
4.75 (4)
ZigZag WaveSize - a modified standard ZigZag indicator with added information about the wavelength in points. Features: Optimized online construction logic: labels are not redrawn from scratch on each tick, but work in parallel with the main calculation, drawing only the latest labels when ZigZag draws new lines or updates them. Added another calculation mode in points: the line is drawn if it exceeds the specified number of points in the settings: manual and automatic (according to ATR with a
FREE
SMC Larry Williams Structure is an indicator for analyzing price chart structures that builds and connects the most important swing points using the method of the famous trader Larry Williams from his bestseller “Long-Term Secrets of Short-Term Trading”, creating a solid foundation for adapting the market structure and analyzing the areas of interest of large participants using the Smart Money concept. The swing construction is based on simple and clear logic — identifying key local extremes whe
TimeBar
Ivan Butko
5 (1)
TimeBar TimeBar is a simple information indicator that shows the remaining time until the bar closes, as well as the time elapsed since the bar opened and the current time. For ease of perception, two types of display modes have been added: in the form of a comment in the upper left corner of the graph, or in the form of a graphic object. Advantages Font selection Font size. You can set any one. When commenting it is too small You can move objects. Any time can be selected by double clicking t
FREE
MinMax Levels – is an indicator of the maximum, minimum and opening price levels for important trading periods: day, week and month. Each Forex market participant uses levels in their trading system. They can be either the main signal for making transactions or an additional one, acting as an analytical tool.  In this indicator, days, weeks and months were selected as important periods, since they are the key trading periods of large market participants. As you know, prices move from level to l
TimeBar TimeBar is a simple information indicator that shows the remaining time until the bar closes, as well as the time elapsed since the bar opened and the current time. For ease of perception, two types of display modes have been added: in the form of a comment in the upper left corner of the graph, or in the form of a graphic object. Advantages Font selection Font size. You can set any one. When commenting it is too small You can move objects. Any time can be selected by double clicking t
FREE
Market Noise Market Noise is an indicator that determines market phases on a price chart, and also distinguishes clear smooth trend movements from noisy flat movements when an accumulation or distribution phase occurs. Each phase is good for its own type of trading: trend for trend-following systems, and flat for aggressive ones. When market noise begins, you can decide to exit trades. In the same way, and vice versa, as soon as the noise ends, you need to turn off aggressive trading systems. S
MinMax Levels – is an indicator of the maximum, minimum and opening price levels for important trading periods: day, week and month. Each Forex market participant uses levels in their trading system. They can be either the main signal for making transactions or an additional one, acting as an analytical tool.  In this indicator, days, weeks and months were selected as important periods, since they are the key trading periods of large market participants. As you know, prices move from level to
MultiFractal is a modified Bill Williams fractal indicator, supplemented by higher order fractals, the difference between which is four in size, similar to changing the time frame. Advantages over the original terminal indicator: Convenience Visibility Information content The indicator is convenient because you do not need to switch to different timeframes when working. Visibility - in one chart you can see the structure of the chart from smaller to medium and large market movements. Information
Market Noise Market Noise is an indicator that determines market phases on a price chart, and also distinguishes clear smooth trend movements from noisy flat movements when an accumulation or distribution phase occurs. Each phase is good for its own type of trading: trend for trend-following systems, and flat for aggressive ones. When market noise begins, you can decide to exit trades. In the same way, and vice versa, as soon as the noise ends, you need to turn off aggressive trading systems. S
Currency Strength Dynamic Currency Strength Dynamic is an indicator of currency strength. Currency strength refers to the trend direction of most or all currency pairs that a currency is a part of. The indicator is based on readings of the difference between moving averages, similar to the MACD indicator, on the 28 most popular currency pairs: majors and minors. Advantages Unique oscillatory calculation method Availability of buttons to disable or enable lines of specific currencies Informat
MultiFractal Levels MultiFractal Levels is a modified Bill Williams fractal indicator with the addition of levels. Fractals are built from all TFs allowed in the settings. Levels are built only based on the latest fractals that have not yet been tested by price. Advantages over the original terminal indicator: Convenience Visibility Informativeness Latest levels Customizable fractal Customizable levels The indicator is convenient because you do not need to switch to different timeframes when w
SMC Larry Williams Structure is an indicator for analyzing price chart structures that builds and connects the most important swing points using the method of the famous trader Larry Williams from his bestseller “Long-Term Secrets of Short-Term Trading”, creating a solid foundation for adapting the market structure and analyzing the areas of interest of large participants using the Smart Money concept. The swing construction is based on simple and clear logic — identifying key local extremes whe
Filter:
No reviews
Reply to review