Market Noise MT4
- Indicators
-
Ivan Butko
 Greetings, friends!
I write in mql4 and mql5. In my market you will find a variety of products, every day I develop something new, I research something. New indicators and advisors will appear in the near future. - Version: 1.3
- Updated: 29 June 2025
- Activations: 20
Market Noise
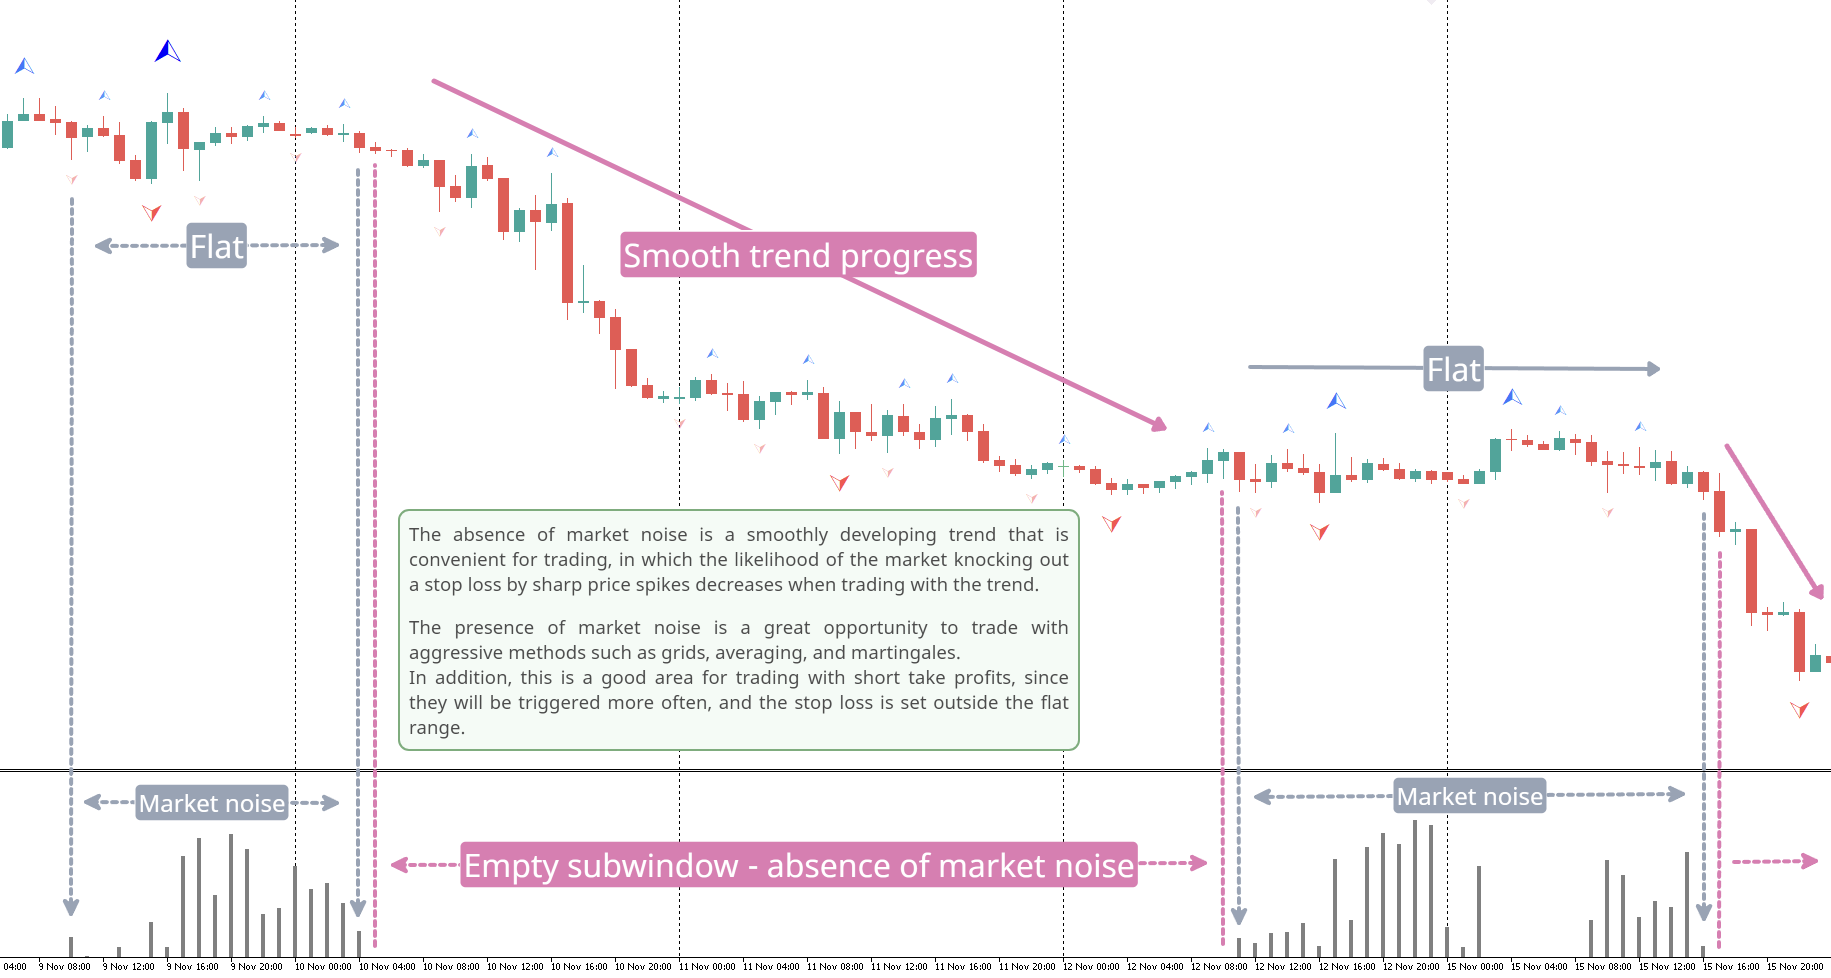
Market Noise is an indicator that determines market phases on a price chart, and also distinguishes clear smooth trend movements from noisy flat movements when an accumulation or distribution phase occurs.
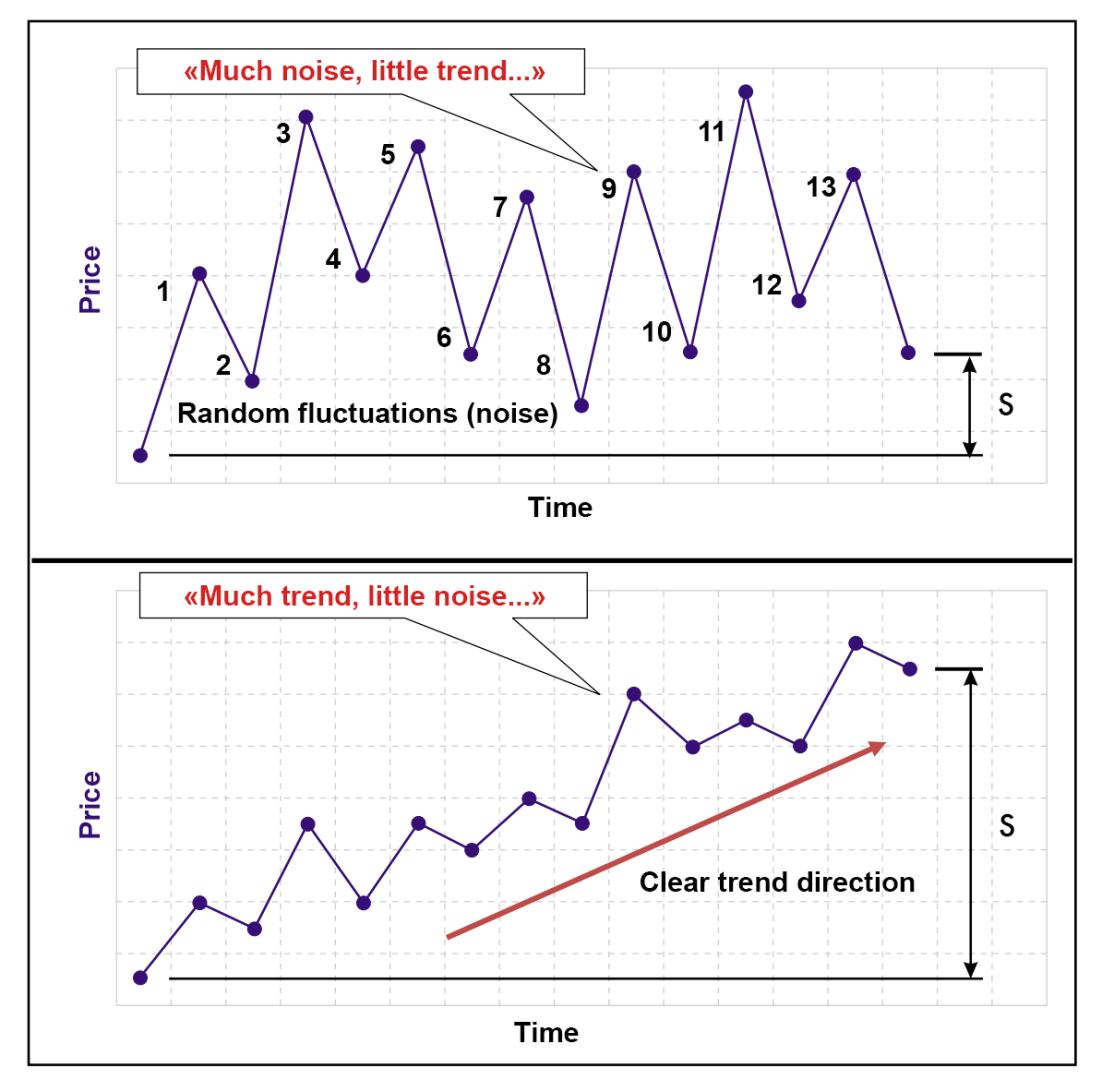
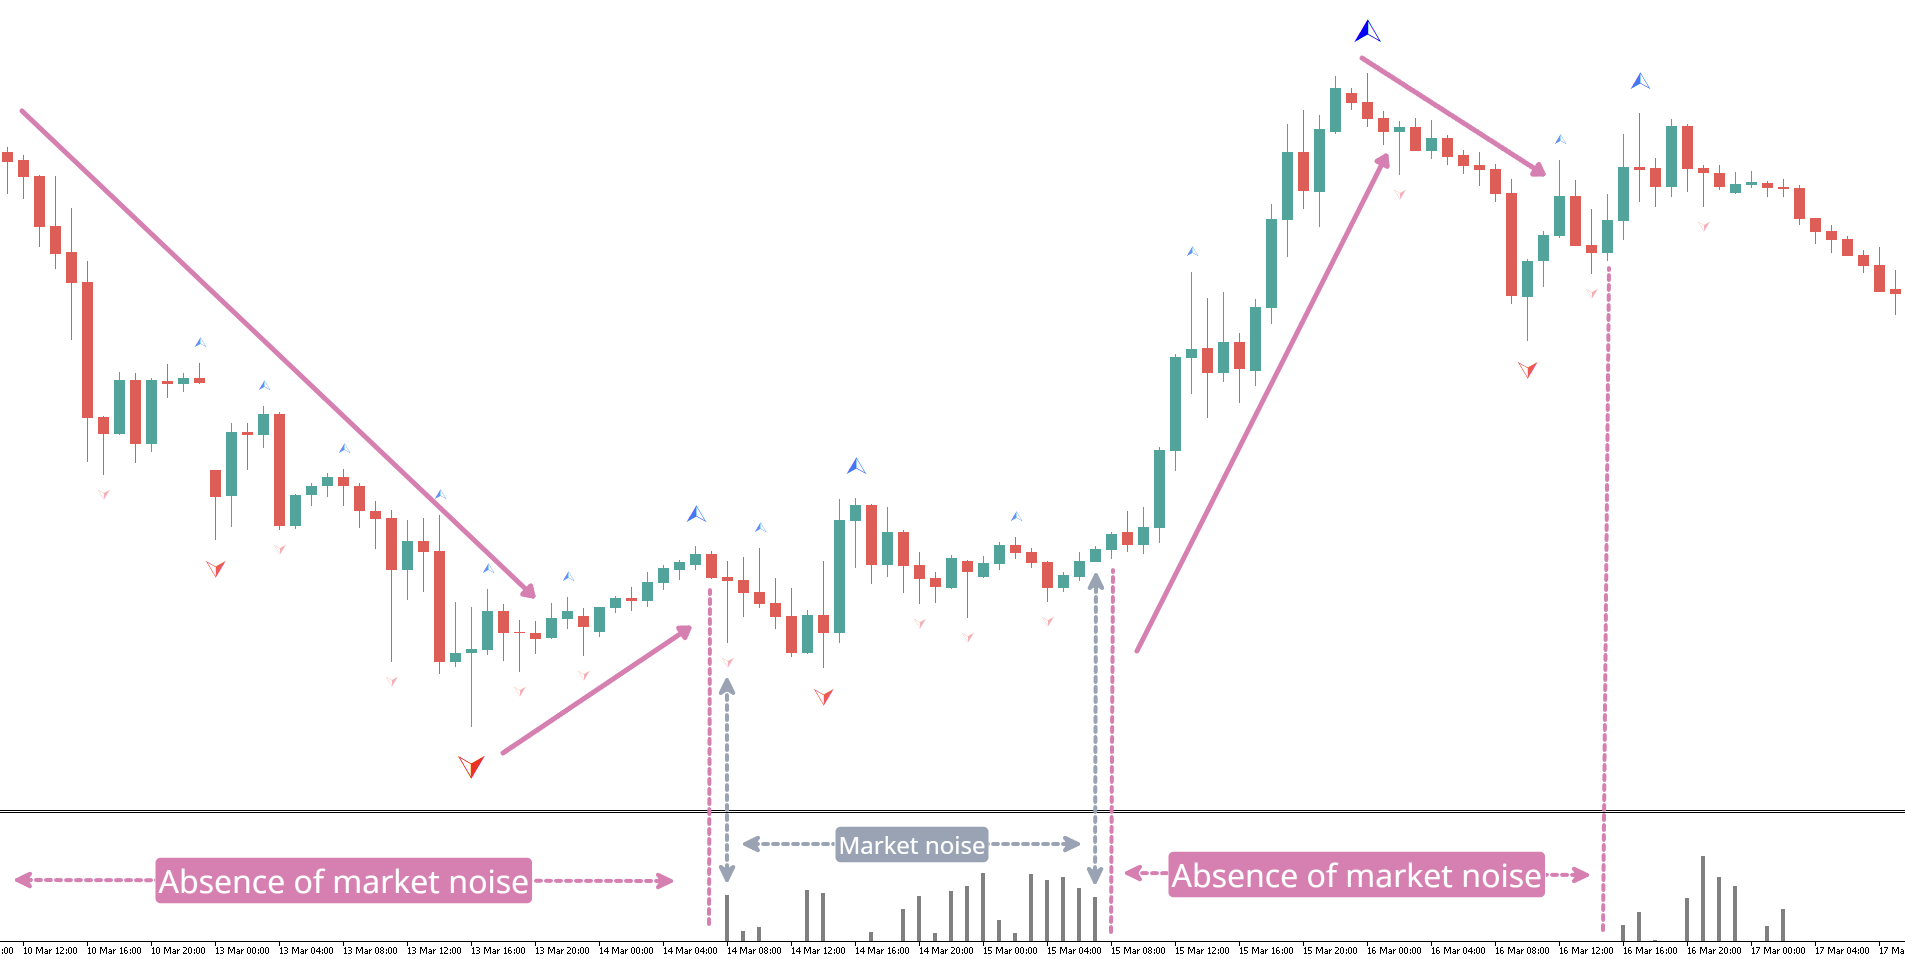
Each phase is good for its own type of trading: trend for trend-following systems, and flat for aggressive ones. When market noise begins, you can decide to exit trades. In the same way, and vice versa, as soon as the noise ends, you need to turn off aggressive trading systems. Someone can trade both types of trading strategies, switching from one to the other. Therefore, this indicator plays the role of a good assistant in the field of trading decisions. Any price movements can be divided into two components - the general price movement for a selected period of time and noise in the form of price fluctuations within this period. At the same time, different markets at different periods of time can demonstrate a wide range of mutual relations between the noise and trend components (Fig. 1). The higher the noise level in price movements, the more difficult it is to discern the direction and strength of the underlying trend. Therefore, in this case it is necessary to use slower trend identification methods. On the other hand, in markets with low noise levels, the main trend is determined quite easily and faster methods of determining trends are reasonable, ensuring a minimum lag of trading signals from changes in price direction. To determine the state of the market, an advanced efficiency ratio (ER) is used, which is based on an exponential comparison of the total price movement and the sum of noise market movements over a certain period. The efficiency ratio (ER) can vary from 0 to 1. The ER value will be zero when the market there is no directional movement, only noise. The ER value will be equal to one when the market moves in one direction, with a complete absence of noise.
Advantages
- Defining a clear trend for trend trading systems
- Flat determination for aggressive systems (grids, averaging, martingale, sitting out), or trading systems with high SL and low TP
- Few settings - only the calculation period in bars
Use the Market Noise indicator as an addition to your trading system
МТ5 - https://www.mql5.com/ru/market/product/107899
Try also my other products in the market https://www.mql5.com/ru/users/capitalplus/seller
Wishing you great profits in trading!
User didn't leave any comment to the rating
Considering the calculation cycles, filtering, and the current platform - this indicator is slightly more complex than regular oscillators, which is why it is so different with your fast work.