在交易图表上通过资源驱动的双三次插值图像缩放技术创建动态 MQL5 图形界面

引言
利用动态视觉效果自定义交易图表可以提升我们的市场分析水平,但要实现高质量的图像渲染,需要精心构思 MQL5 程序。在本文中,我们将介绍一款强大的工具,它能够实现动态图形界面,利用资源驱动的图像缩放结合双三次插值技术,打造出清晰、灵活的图表视觉效果。我们将通过以下步骤来探索这一过程:
最终,您将拥有一个强大的工具,可以通过专业的、用户可控的图像图形来改造您的交易图表。
动态资源驱动图像图形概述
我们的目标是构建一个 MQL5 工具,在 MetaTrader 5 图表上嵌入并缩放图像,从而创建动态的、用户可控的图形界面。我们将把位图图像作为资源加载,使用双三次插值将其缩放以适应图表尺寸,并根据用户输入(如锚定到角落或动态居中)进行定位。这将使我们能够在保持宽高比的同时叠加自定义视觉效果(如标志或图案),并支持在背景或前景显示之间切换,所有这些都经过优化,以确保实时性能。这样,图表将变得更加有趣和吸引人。
对于缩放,我们将使用双三次插值,而不是最近邻和双线性方法。最近邻插值会产生像素化的结果,而双线性插值则会模糊细节。以下是一张详细的示意图,解释了我们为何选择双三次插值而非其他方法。
图形可视化。

像素化结果可视化

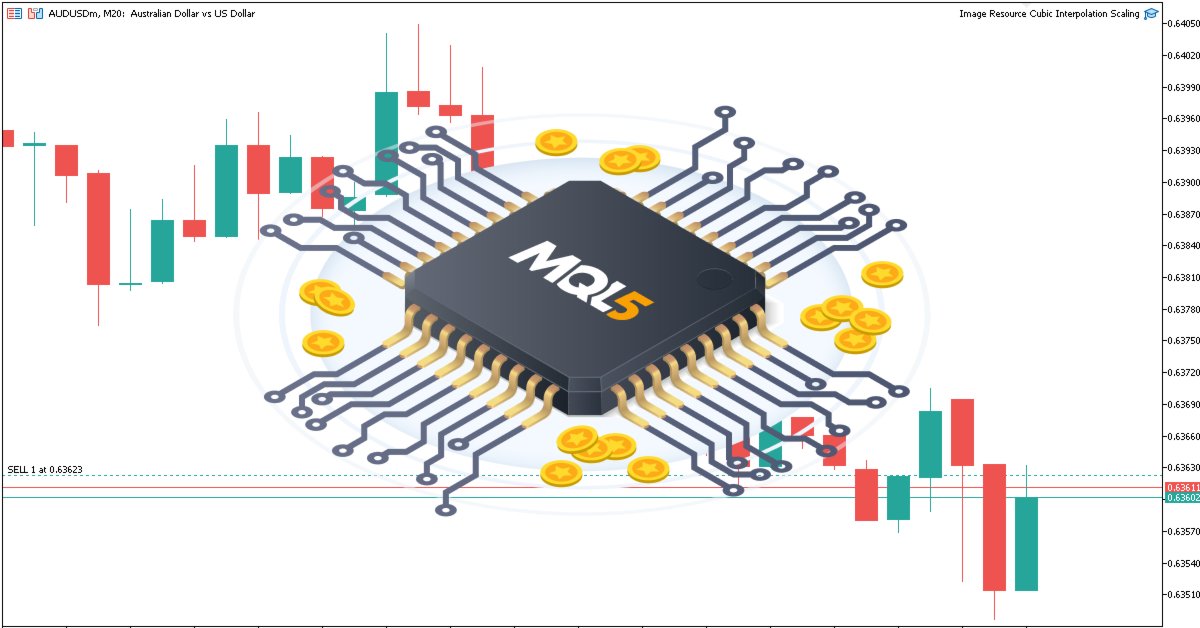
双三次插值利用 4×4 像素邻域和三次多项式,确保更平滑的渐变和更清晰的边缘。我们选择双三次插值是因为它具有卓越的清晰度和效率,非常适合在各种图表尺寸上进行动态调整,能够提供清晰的视觉效果,从而有助于提升交易决策。以下是我们期望实现的目标示例,使用的是自定义的 MQL5 图像。

MQL5实现
要在 MQL5 中创建程序,我们首先需要确保图像采用正确的格式,即位图(BMP)格式。与JPEG格式相比,BMP 格式是未压缩的位图图像,具有更高的分辨率。因此,如果您需要使用相关图像,而它采用其他格式,可以使用免费的在线资源进行转换。至于我们,这些是我们将要使用的图像,因为它们已经准备就绪。

获取到相应格式的文件后,我们需要将其移动到 Images 文件夹中。您可以打开导航器面板,定位到 Images 文件夹,右键点击该文件夹,然后选择"打开文件夹"。这将打开默认文件夹,其中默认包含两个美元和欧元图像文件。您可以将图像文件粘贴到该位置。以下是直观的图示。

完成这些操作后,我们就可以开始了。我们要做的第一件事是将图像作为资源添加进去。
//+------------------------------------------------------------------+
//|                   Image Resource Cubic Interpolation Scaling.mq5 |
//|                           Copyright 2025, Allan Munene Mutiiria. |
//|                                   https://t.me/Forex_Algo_Trader |
//+------------------------------------------------------------------+
#property copyright "Copyright 2025, Allan Munene Mutiiria."
#property link      "https://t.me/Forex_Algo_Trader"
#property version   "1.00"

#resource "\\Images\\mql5-circuit.bmp" //--- Include the image file as a resource
#define ORIGINAL_IMAGE_RESOURCE "::Images\\mql5-circuit.bmp" //--- Define the resource path for the original image
#define CHART_IMAGE_OBJECT_NAME "ChartImage" //--- Define the name of the chart image object
在这里,我们奠定了在图表上嵌入和显示图像的基础。我们使用 #resource 指令将位于 “\Images\mql5-circuit.bmp” 的位图文件作为资源包含进来,确保程序可以随时访问它。
然后,我们定义宏 “ORIGINAL_IMAGE_RESOURCE”,将其设置为 “::Images\mql5-circuit.bmp”,以创建对图像资源路径的标准化引用,我们将使用它来加载图像数据。此外,我们将宏 “CHART_IMAGE_OBJECT_NAME” 定义为 “ChartImage”,这将作为显示图像的图表对象的唯一标识符,使我们能够通过控制其在图表上的外观来对其进行管理。
接下来,我们需要定义一些将在整个程序中使用的全局变量和输入参数。
// Enum for selecting anchor corner
enum ENUM_ANCHOR_CORNER {
   TOP_LEFT = 0,     // Top-Left
   TOP_RIGHT = 1,    // Top-Right
   BOTTOM_LEFT = 2,  // Bottom-Left
   BOTTOM_RIGHT = 3  // Bottom-Right
};

// Input parameters for user customization
input bool LimitToOriginalSize = true; // Image scaling limited to original size
input bool ImageInBackground = true; // Image displayed in background (true) or foreground (false)
input bool CenterImageDynamically = true; // Image centered dynamically (true) or positioned manually (false)
input ENUM_ANCHOR_CORNER AnchorCorner = TOP_LEFT; // Anchor corner for manual positioning
input int XOffsetFromCorner = 100; // x-offset in pixels from the chosen corner
input int YOffsetFromCorner = 100; // y-offset in pixels from the chosen corner

// Counter for generating unique resource names for scaled images
int scaled_resource_counter = 0; //--- Initialize a counter for creating unique resource names
为了配置图像放置的用户控件,我们定义了 “ENUM_ANCHOR_CORNER” 枚举,提供 “TOP_LEFT”、“TOP_RIGHT”、“BOTTOM_LEFT” 和 “BOTTOM_RIGHT” 选项用于选择图表角落。
我们设置 input 参数:“LimitToOriginalSize”(true)用于限制缩放,“ImageInBackground”(true)用于背景/前景显示,“CenterImageDynamically”(true)用于自动或手动定位,“AnchorCorner”(TOP_LEFT)用于角落选择,“XOffsetFromCorner” 和 “YOffsetFromCorner”(100 像素)用于手动偏移。我们还将 “scaled_resource_counter” 初始化为 0,以便为缩放后的图像指定唯一名称。
为了在图表上显示图像,我们将使用一个包含所有逻辑的自定义函数。
//+------------------------------------------------------------------+
//| Display the image on the chart                                   |
//+------------------------------------------------------------------+
bool DisplayImageOnChart() {
   // Load the original image from the resource
   uint image_pixels[]; //--- Declare an array to store image pixel data
   uint original_image_width, original_image_height; //--- Declare variables for original image dimensions

   if (!ResourceReadImage(ORIGINAL_IMAGE_RESOURCE, image_pixels, original_image_width, original_image_height)) { //--- Read the image resource into the pixel array
      Print("Error: Failed to read original image data from resource."); //--- Log an error if reading the image fails
      return false; //--- Return false to indicate failure
   }

   // Get chart dimensions
   int chart_pixel_width = (int)ChartGetInteger(0, CHART_WIDTH_IN_PIXELS); //--- Retrieve the chart width in pixels
   int chart_pixel_height = (int)ChartGetInteger(0, CHART_HEIGHT_IN_PIXELS); //--- Retrieve the chart height in pixels

   // Calculate scaled dimensions while preserving aspect ratio
   double image_aspect_ratio = (double)original_image_width / original_image_height; //--- Calculate the aspect ratio of the original image
   double chart_aspect_ratio = (double)chart_pixel_width / chart_pixel_height; //--- Calculate the aspect ratio of the chart
   int scaled_image_width, scaled_image_height; //--- Declare variables for scaled image dimensions

   if (image_aspect_ratio > chart_aspect_ratio) { //--- Check if the image is wider relative to the chart
      scaled_image_width = chart_pixel_width; //--- Set scaled width to match chart width
      scaled_image_height = (int)(chart_pixel_width / image_aspect_ratio); //--- Calculate scaled height to maintain aspect ratio
   } else {
      scaled_image_height = chart_pixel_height; //--- Set scaled height to match chart height
      scaled_image_width = (int)(chart_pixel_height * image_aspect_ratio); //--- Calculate scaled width to maintain aspect ratio
   }

   // Limit scaling to original size if enabled
   if (LimitToOriginalSize) { //--- Check if the user has enabled limiting to original size
      scaled_image_width = MathMin(scaled_image_width, (int)original_image_width); //--- Restrict width to original width
      scaled_image_height = MathMin(scaled_image_height, (int)original_image_height); //--- Restrict height to original height
      // Recalculate one dimension to maintain aspect ratio
      if (scaled_image_width < scaled_image_height * image_aspect_ratio) { //--- Check if width is the limiting factor
         scaled_image_height = (int)(scaled_image_width / image_aspect_ratio); //--- Adjust height to maintain aspect ratio
      } else {
         scaled_image_width = (int)(scaled_image_height * image_aspect_ratio); //--- Adjust width to maintain aspect ratio
      }
   }

   // Log dimensions for debugging
   PrintFormat(
      "Original: %dx%d, Chart: %dx%d, Scaled: %dx%d",
      original_image_width, original_image_height,
      chart_pixel_width, chart_pixel_height,
      scaled_image_width, scaled_image_height
   ); //--- Log the original, chart, and scaled dimensions for debugging

   return true;

}
我们首先定义 “DisplayImageOnChart” 函数,用于在图表上渲染图像。首先,我们声明 array 类型的 “image_pixels” 数组,用于存储图像的像素数据,以及 “original_image_width” 和 “original_image_height” 变量,用于保存原始图像的尺寸。使用 ResourceReadImage 函数,我们将图像数据从 “ORIGINAL_IMAGE_RESOURCE” 宏加载到 “image_pixels” 数组中,同时捕获其宽度和高度。如果该操作失败,我们通过 Print 函数记录错误信息并返回 false,表示操作失败,从而中止后续处理。
接下来,我们获取图表的尺寸,以确保图像能够适当适配。我们使用 ChartGetInteger 函数获取图表的宽度和高度,并将其转换为整数后分别存储在 “chart_pixel_width” 和 “chart_pixel_height” 中。为了在缩放时保持图像的宽高比,我们通过将 “original_image_width” 除以 “original_image_height” 计算 “image_aspect_ratio”,并将 “chart_pixel_width” 除以 “chart_pixel_height” 计算 “chart_aspect_ratio”。这两个比例将指导我们的缩放逻辑。
然后,我们声明 “scaled_image_width” 和 “scaled_image_height” 变量,用于存储缩放后图像的尺寸。为了保持宽高比,我们将 “image_aspect_ratio” 与 “chart_aspect_ratio” 进行比较。如果图像相对于图表更宽(即 “image_aspect_ratio” 大于 “chart_aspect_ratio”),我们将 “scaled_image_width” 设置为 “chart_pixel_width”,并通过将 “chart_pixel_width” 除以 “image_aspect_ratio” 计算 “scaled_image_height”。否则,我们将 “scaled_image_height” 设置为 “chart_pixel_height”,并通过将 “chart_pixel_height” 乘以 “image_aspect_ratio” 计算 “scaled_image_width”。这样能够确保图像在不发生畸变的情况下适配图表。
如果 “LimitToOriginalSize” 输入参数为 true,我们将缩放限制在原始图像尺寸内,以防止放大图像。我们使用 MathMin 函数将 “scaled_image_width” 限制在 “original_image_width”,将 “scaled_image_height” 限制在 “original_image_height”。在该限制之后,为了保持宽高比,我们检查 “scaled_image_width” 是否小于 “scaled_image_height” 乘以 “image_aspect_ratio”。如果是,我们通过将 “scaled_image_width” 除以 “image_aspect_ratio” 重新计算 “scaled_image_height”;否则,我们通过将 “scaled_image_height” 乘以 “image_aspect_ratio” 重新计算 “scaled_image_width”。
最后,我们使用 PrintFormat 函数记录原始尺寸、图表尺寸和缩放后尺寸。我们将使用它来跟踪图表的动态变化,如下所示。

从图像中可以看出,我们已经读取了图表和图像的尺寸。现在我们需要做的是动态缩放图像以适配图表。为此,我们需要一个自定义函数来实现这一功能。
//+------------------------------------------------------------------+
//| Scale the image using bicubic interpolation                      |
//+------------------------------------------------------------------+
void ScaleImage(
   uint &pixels[], int original_width, int original_height,
   int new_width, int new_height
) {
   uint scaled_pixels[]; //--- Declare an array for scaled pixel data
   ArrayResize(scaled_pixels, new_width * new_height); //--- Resize the array to fit the scaled image

   for (int y = 0; y < new_height; y++) { //--- Iterate over each row of the scaled image
      for (int x = 0; x < new_width; x++) { //--- Iterate over each column of the scaled image
         // Map to original image coordinates
         double original_x = (double)x * original_width / new_width; //--- Calculate the corresponding x-coordinate in the original image
         double original_y = (double)y * original_height / new_height; //--- Calculate the corresponding y-coordinate in the original image

         // Apply bicubic interpolation
         uint pixel = BicubicInterpolate(pixels, original_width, original_height, original_x, original_y); //--- Interpolate the pixel value
         scaled_pixels[y * new_width + x] = pixel; //--- Store the interpolated pixel in the scaled array
      }
   }

   ArrayResize(pixels, new_width * new_height); //--- Resize the original pixel array to the new dimensions
   ArrayCopy(pixels, scaled_pixels); //--- Copy the scaled pixels back to the original array
}
在这里,我们定义了 “ScaleImage” 函数,使用双三次插值方法调整图像大小。我们声明 “scaled_pixels” 数组,并使用 ArrayResize 函数将其大小调整为 “new_width” × “new_height” 像素。我们遍历每个像素,通过 “original_x” 和 “original_y” 将坐标映射到原始图像。
对于每个像素,我们调用 “BicubicInterpolate” 函数(稍后将详细说明)来计算像素值,并将其存储在 “scaled_pixels” 的位置 “y” × “new_width” + “x” 处。最后,我们使用 ArrayResize 调整 “pixels” 的大小,并使用 ArrayCopy 将 “scaled_pixels” 复制到其中,以便进行后续的图表处理。
以下是负责通过双三次插值计算像素值的函数。让我们先定义一个函数来计算单个颜色元素的插值,然后可以将其用于计算单个像素的插值。
//+------------------------------------------------------------------+
//| Perform bicubic interpolation for a single color component       |
//+------------------------------------------------------------------+
double BicubicInterpolateComponent(uchar &components[], double fractional_x, double fractional_y) {
   // Calculate cubic interpolation weights for x
   double weights_x[4]; //--- Declare an array for x interpolation weights
   double t = fractional_x; //--- Store the fractional x value
   weights_x[0] = (-0.5 * t * t * t + t * t - 0.5 * t);        //--- Calculate weight for x-1
   weights_x[1] = (1.5 * t * t * t - 2.5 * t * t + 1);         //--- Calculate weight for x
   weights_x[2] = (-1.5 * t * t * t + 2 * t * t + 0.5 * t);    //--- Calculate weight for x+1
   weights_x[3] = (0.5 * t * t * t - 0.5 * t * t);             //--- Calculate weight for x+2

   // Interpolate in x for each y
   double y_values[4]; //--- Declare an array for intermediate y values
   for (int j = 0; j < 4; j++) { //--- Iterate over rows of the neighborhood
      y_values[j] =
         weights_x[0] * components[j * 4 + 0] +
         weights_x[1] * components[j * 4 + 1] +
         weights_x[2] * components[j * 4 + 2] +
         weights_x[3] * components[j * 4 + 3]; //--- Perform interpolation in x for each y
   }

   // Calculate cubic interpolation weights for y
   double weights_y[4]; //--- Declare an array for y interpolation weights
   t = fractional_y; //--- Store the fractional y value
   weights_y[0] = (-0.5 * t * t * t + t * t - 0.5 * t); //--- Calculate weight for y-1
   weights_y[1] = (1.5 * t * t * t - 2.5 * t * t + 1); //--- Calculate weight for y
   weights_y[2] = (-1.5 * t * t * t + 2 * t * t + 0.5 * t); //--- Calculate weight for y+1
   weights_y[3] = (0.5 * t * t * t - 0.5 * t * t); //--- Calculate weight for y+2

   // Interpolate in y
   double result =
      weights_y[0] * y_values[0] +
      weights_y[1] * y_values[1] +
      weights_y[2] * y_values[2] +
      weights_y[3] * y_values[3]; //--- Perform interpolation in y to get the final value

   // Clamp the result to valid color range [0, 255]
   return MathMax(0, MathMin(255, result)); //--- Clamp the interpolated value to the valid color range
}
在这里,我们实现了 “BicubicInterpolateComponent” 函数,用于在图像缩放过程中对单个颜色分量执行双三次插值。我们声明 “weights_x” 数组以存储 x 轴的插值权重,并将 “t” 设置为 “fractional_x”,即 x 坐标的小数部分。
我们使用三次多项式公式计算位置 x-1、x、x+1 和 x+2 的四个权重,存储在 “weights_x” 中,从而实现平滑插值。接下来,我们声明 “y_values” array 以保存中间结果,并遍历 4×4 像素邻域的四行。对于每一行 “j”,我们通过将 “weights_x” 值与 “components” 数组中索引 “j × 4 + 0” 到 “j × 4 + 3” 处的对应颜色分量相乘,计算 “y_values[j]”,执行 x 轴方向的插值。
然后,我们声明 “weights_y” 数组,并将 “t” 设置为 “fractional_y” 用于 y 轴权重,使用相同的三次公式计算位置 y-1、y、y+1 和 y+2 的权重。我们通过使用 “weights_y” 对 “y_values” 进行加权和运算,在 y 轴方向上执行插值,计算 “result”。最后,我们使用 MathMax 和 MathMin 函数将 “result” 限制在有效颜色范围 [0, 255] 内,确保输出适合像素颜色表示。我们还需要为每个像素准备颜色通道分量,因此让我们设计一个颜色通道提取函数。
//+------------------------------------------------------------------+
//| Extract ARGB components from a pixel                             |
//+------------------------------------------------------------------+
void GetArgb(uint pixel, uchar &alpha, uchar &red, uchar &green, uchar &blue) {
   alpha = (uchar)((pixel >> 24) & 0xFF); //--- Extract the alpha channel from the pixel
   red = (uchar)((pixel >> 16) & 0xFF);   //--- Extract the red channel from the pixel
   green = (uchar)((pixel >> 8) & 0xFF);  //--- Extract the green channel from the pixel
   blue = (uchar)(pixel & 0xFF);          //--- Extract the blue channel from the pixel
}
我们实现了 “GetArgb” 函数,用于从目标像素中提取单个 ARGB 颜色分量。我们接受一个 “pixel” 值,并通过引用变量 “alpha”、“red”、“green” 和 “blue” 来存储提取的分量。使用位运算,我们将每个分量隔离:将 “pixel” 右移 24 位并与 “0xFF” 进行按位与运算以提取 “alpha”;右移 16 位并掩码以获取 “red”;右移 8 位并掩码以获取 “green”;对最低 8 位进行掩码以提取 “blue”。每个结果被强制转换为 uchar,确保数值位于 0-255 的范围内,适合颜色表示
我们使用 “0xFF” 掩码机制,确保从 32 位无符号整数像素中提取所需的字节(8 位),该像素以 ARGB 格式表示颜色,从而准确提取 alpha、红色、绿色或蓝色值。如果缺少 “& 0xFF”,可能会因为其他通道的高位未被清除而导致意想不到的结果。如果您对这些字符的含义感到好奇,我们讨论的是十六进制格式的数字 255。请查看这里。

有了这些函数,我们现在可以定义一个函数来对单个像素执行双三次插值,从而精确地缩放图像。
//+------------------------------------------------------------------+
//| Perform bicubic interpolation for a single pixel                 |
//+------------------------------------------------------------------+
uint BicubicInterpolate(
   uint &pixels[], int width, int height,
   double x, double y
) {
   // Get integer and fractional parts
   int x0 = (int)x; //--- Extract the integer part of the x-coordinate
   int y0 = (int)y; //--- Extract the integer part of the y-coordinate
   double fractional_x = x - x0; //--- Calculate the fractional part of the x-coordinate
   double fractional_y = y - y0; //--- Calculate the fractional part of the y-coordinate

   // Define 4x4 neighborhood
   int x_indices[4], y_indices[4]; //--- Declare arrays for x and y indices
   for (int i = -1; i <= 2; i++) { //--- Iterate over the 4x4 neighborhood
      x_indices[i + 1] = MathMin(MathMax(x0 + i, 0), width - 1); //--- Calculate clamped x-index
      y_indices[i + 1] = MathMin(MathMax(y0 + i, 0), height - 1); //--- Calculate clamped y-index
   }

   // Get 16 pixels in the 4x4 neighborhood
   uint neighborhood_pixels[16]; //--- Declare an array for the 4x4 neighborhood pixels
   for (int j = 0; j < 4; j++) { //--- Iterate over rows of the neighborhood
      for (int i = 0; i < 4; i++) { //--- Iterate over columns of the neighborhood
         neighborhood_pixels[j * 4 + i] = pixels[y_indices[j] * width + x_indices[i]]; //--- Store the pixel value
      }
   }

   // Extract ARGB components
   uchar alpha_components[16], red_components[16], green_components[16], blue_components[16]; //--- Declare arrays for ARGB components
   for (int i = 0; i < 16; i++) { //--- Iterate over the neighborhood pixels
      GetArgb(
         neighborhood_pixels[i],
         alpha_components[i], red_components[i],
         green_components[i], blue_components[i]
      ); //--- Extract ARGB components for each pixel
   }

   // Perform bicubic interpolation for each component
   uchar alpha_out = (uchar)BicubicInterpolateComponent(alpha_components, fractional_x, fractional_y); //--- Interpolate the alpha component
   uchar red_out = (uchar)BicubicInterpolateComponent(red_components, fractional_x, fractional_y); //--- Interpolate the red component
   uchar green_out = (uchar)BicubicInterpolateComponent(green_components, fractional_x, fractional_y); //--- Interpolate the green component
   uchar blue_out = (uchar)BicubicInterpolateComponent(blue_components, fractional_x, fractional_y); //--- Interpolate the blue component

   // Combine components into a single pixel
   return (alpha_out << 24) | (red_out << 16) | (green_out << 8) | blue_out; //--- Combine ARGB components into a single pixel value
}
在这里,我们实现了 “BicubicInterpolate” 函数,通过双三次插值过程计算单个像素的颜色。我们首先提取输入坐标 “x” 和 “y” 的整数部分到 “x0” 和 “y0” 中,并计算它们的小数部分,分别为 “fractional_x” 和 “fractional_y”。我们定义 “x_indices” 和 “y_indices” 数组来存储 4×4 邻域的坐标,从 -1 迭代到 2,计算 “x0” 和 “y0” 周围的索引。使用 MathMin 和 MathMax 函数,我们将这些索引限制在有效范围 [0, “width”-1] 和 [0, “height”-1] 内。
然后,我们创建 “neighborhood_pixels” 数组来保存来自 4×4 邻域的 16 个像素,通过遍历 “y_indices” 和 “x_indices” 从 “pixels” 数组的 “y_indices[j] × width + x_indices[i]” 位置获取像素值来填充它。接下来,我们声明 “alpha_components”、“red_components”、“green_components” 和 “blue_components” 数组,并使用 “GetArgb” 函数提取 “neighborhood_pixels” 中 16 个像素中每一个的 ARGB 值。
对于每个颜色分量,我们调用 “BicubicInterpolateComponent” 函数,传入 “fractional_x” 和 “fractional_y”,将结果作为 “uchar” 值存储在 “alpha_out”、“red_out”、“green_out” 和 “blue_out” 中。最后,我们使用位移运算将这些分量组合成单个像素值:“alpha_out” 移位 24 位,“red_out” 移位 16 位,“green_out” 移位 8 位,以及 “blue_out”,返回生成的 “uint” 值供缩放图像使用。现在我们可以调用 “ScaleImage” 函数使其生效。
// Scale the image using bicubic interpolation
ScaleImage(image_pixels, original_image_width, original_image_height, scaled_image_width, scaled_image_height); //--- Scale the image to the calculated dimensions
调用该函数后,我们现在可以创建一个包含缩放图像的新资源。
// Create a unique resource name for the scaled image
string scaled_resource_name = "::ScaledImage" + IntegerToString(scaled_resource_counter++); //--- Generate a unique resource name using the counter

// Create a new resource with the scaled image
if (!ResourceCreate(
   scaled_resource_name, image_pixels, scaled_image_width, scaled_image_height,
   0, 0, scaled_image_width, COLOR_FORMAT_ARGB_NORMALIZE
)) { //--- Create a new resource for the scaled image
   Print("Error: Failed to create resource for scaled image: ", scaled_resource_name); //--- Log an error if resource creation fails
   return false; //--- Return false to indicate failure
}
为了生成并将缩放后的图像作为资源存储,我们通过定义 “scaled_resource_name” 字符串创建一个唯一的资源名称,将 “::ScaledImage” 与应用于 “scaled_resource_counter” 的 IntegerToString 函数的结果连接起来,然后我们递增该计数器以确保后续资源的唯一性。
接下来,我们使用 ResourceCreate 函数创建一个具有 “scaled_resource_name” 的新资源,使用 “image_pixels” 数组、“scaled_image_width”、“scaled_image_height”,并指定偏移量为 0,宽度为 “scaled_image_width”,以及 COLOR_FORMAT_ARGB_NORMALIZE 格式。如果 “ResourceCreate” 失败,我们使用 Print 函数记录错误,包括 “scaled_resource_name”,并返回 false 表示失败,停止进一步处理。
如果执行到这一步,我们只需要在图表上定位并可视化图像,因此让我们首先定义定位坐标。
// Determine image position based on user input
int x_offset, y_offset; //--- Declare variables for x and y offsets
if (CenterImageDynamically) { //--- Check if the user wants to center the image dynamically
   x_offset = (chart_pixel_width - scaled_image_width) / 2; //--- Calculate horizontal offset to center the image
   y_offset = (chart_pixel_height - scaled_image_height) / 2; //--- Calculate vertical offset to center the image
} else {
   // Set base position based on chosen anchor corner
   switch (AnchorCorner) { //--- Select the anchor corner based on user input
      case TOP_LEFT: //--- Handle Top-Left corner
         x_offset = XOffsetFromCorner; //--- Use user-defined x-offset from top-left
         y_offset = YOffsetFromCorner; //--- Use user-defined y-offset from top-left
         break;
      case TOP_RIGHT: //--- Handle Top-Right corner
         x_offset = chart_pixel_width - scaled_image_width - XOffsetFromCorner; //--- Calculate x-offset from right edge
         y_offset = YOffsetFromCorner; //--- Use user-defined y-offset from top
         break;
      case BOTTOM_LEFT: //--- Handle Bottom-Left corner
         x_offset = XOffsetFromCorner; //--- Use user-defined x-offset from left
         y_offset = chart_pixel_height - scaled_image_height - YOffsetFromCorner; //--- Calculate y-offset from bottom
         break;
      case BOTTOM_RIGHT: //--- Handle Bottom-Right corner
         x_offset = chart_pixel_width - scaled_image_width - XOffsetFromCorner; //--- Calculate x-offset from right edge
         y_offset = chart_pixel_height - scaled_image_height - YOffsetFromCorner; //--- Calculate y-offset from bottom
         break;
      default: //--- Handle unexpected case
         x_offset = XOffsetFromCorner; //--- Default to top-left x-offset
         y_offset = YOffsetFromCorner; //--- Default to top-left y-offset
   }
}
至于定位,我们声明 “x_offset” 和 “y_offset” 变量。如果 “CenterImageDynamically” 为 true,我们通过将 “x_offset” 设置为(“chart_pixel_width” - “scaled_image_width”)/ 2,“y_offset” 设置为(“chart_pixel_height” - “scaled_image_height”)/ 2 来使图像居中。
否则,通过对 “AnchorCorner” 使用 switch 语句设置偏移量:“TOP_LEFT” 使用 “XOffsetFromCorner” 和 “YOffsetFromCorner”;“TOP_RIGHT” 将 “x_offset” 设置为 “chart_pixel_width” - “scaled_image_width” - “XOffsetFromCorner”;“BOTTOM_LEFT” 将 “y_offset” 设置为 “chart_pixel_height” - “scaled_image_height” - “YOffsetFromCorner”;“BOTTOM_RIGHT” 则组合两种方式。默认情况下使用 “XOffsetFromCorner” 和 “YOffsetFromCorner”。
现在我们需要一个函数,通过定义的坐标来定位图像。
//+------------------------------------------------------------------+
//| Create and position the chart image object                       |
//+------------------------------------------------------------------+
void CreateFullChartImage(
   string object_name, string resource_name,
   int x_size, int y_size,
   int x_offset, int y_offset,
   bool is_background
) {
   // Create the bitmap label object if it doesn't exist
   if (ObjectFind(0, object_name) < 0) { //--- Check if the object already exists
      ObjectCreate(0, object_name, OBJ_BITMAP_LABEL, 0, 0, 0); //--- Create a new bitmap label object
   }

   // Set object properties
   ObjectSetString(0, object_name, OBJPROP_BMPFILE, resource_name); //--- Set the resource file for the bitmap
   ObjectSetInteger(0, object_name, OBJPROP_XSIZE, x_size); //--- Set the width of the bitmap
   ObjectSetInteger(0, object_name, OBJPROP_YSIZE, y_size); //--- Set the height of the bitmap
   ObjectSetInteger(0, object_name, OBJPROP_XDISTANCE, x_offset); //--- Set the horizontal position of the bitmap
   ObjectSetInteger(0, object_name, OBJPROP_YDISTANCE, y_offset); //--- Set the vertical position of the bitmap
   ObjectSetInteger(0, object_name, OBJPROP_BACK, is_background); //--- Set whether the bitmap is in the background based on input

   // Redraw the chart to update the display
   ChartRedraw(0); //--- Redraw the chart to reflect changes
}
在这里,我们实现了 “CreateFullChartImage” 函数,用于在图表上创建并定位图像对象。我们首先使用 ObjectFind 函数检查名为 “object_name” 的对象是否存在。如果不存在(返回值小于 0),我们使用 ObjectCreate 函数创建一个新的位图标签对象,指定 “object_name”、OBJ_BITMAP_LABEL 和默认的图表坐标。
然后,我们设置对象的属性:使用 ObjectSetString 将 “resource_name” 链接到 OBJPROP_BMPFILE 作为图像源;使用 ObjectSetInteger 将 “OBJPROP_XSIZE” 设置为 “x_size”,“OBJPROP_YSIZE” 设置为 “y_size”,“OBJPROP_XDISTANCE” 设置为 “x_offset”,“OBJPROP_YDISTANCE” 设置为 “y_offset” 以确定尺寸和位置;将 OBJPROP_BACK 设置为 “is_background” 以切换背景或前景显示。最后,我们调用 ChartRedraw 函数更新图表显示,呈现新增或修改后的图像对象。然后,我们调用此函数来可视化图像。
CreateFullChartImage(
   CHART_IMAGE_OBJECT_NAME, scaled_resource_name,
   scaled_image_width, scaled_image_height,
   x_offset, y_offset, ImageInBackground
); //--- Create and position the chart image object, using user-specified background setting
调用该函数后,一切就绪,我们可以在 OnInit 事件处理程序中调用这个主函数来创建初始图像。
//+------------------------------------------------------------------+
//| Expert initialization function                                   |
//+------------------------------------------------------------------+
int OnInit() {
   // Display the image on the chart during initialization
   if (!DisplayImageOnChart()) { //--- Attempt to display the image on the chart
      Print("Error: Failed to display the initial image."); //--- Log an error if image display fails
      return (INIT_FAILED); //--- Return failure status if initialization fails
   }
   return (INIT_SUCCEEDED); //--- Return success status if initialization succeeds
}
在 OnInit 事件处理程序中,我们调用 “DisplayImageOnChart” 函数在初始化期间渲染图像。如果 “DisplayImageOnChart” 返回 false,表示图像显示失败,我们记录错误信息并返回 INIT_FAILED,表明初始化失败,终止程序。如果显示成功,我们返回 INIT_SUCCEEDED,表示初始化已完成,程序可以继续运行。编译后,我们得到以下结果。

从图像中可以看出,我们能够在初始运行时将资源图像映射到图表上。然而,我们需要使图像在图表尺寸变化时能够响应。因此,我们需要 OnChartEvent 事件处理程序。
//+------------------------------------------------------------------+
//| Chart event handler                                              |
//+------------------------------------------------------------------+
void OnChartEvent(
   const int event_id,         // Event ID
   const long &long_param,     // Long type event parameter
   const double &double_param, // Double type event parameter
   const string &string_param  // String type event parameter
) {
   // Handle chart resize events to update the image
   if (event_id == CHARTEVENT_CHART_CHANGE) { //--- Check if the event is a chart change (e.g., resize)
      if (!DisplayImageOnChart()) { //--- Attempt to update the image on the chart
         Print("Error: Failed to update image on chart resize."); //--- Log an error if image update fails
      }
   }
}
在这里,我们定义了 OnChartEvent 事件处理程序来处理程序中与图表相关的事件,特别关注图表的调整大小。我们检查 “event_id” 是否等于 CHARTEVENT_CHART_CHANGE,该事件表示图表修改(如调整大小)。如果为真,我们调用 “DisplayImageOnChart” 函数来更新图像显示,使其与新的图表尺寸相匹配。如果 “DisplayImageOnChart” 返回 false,表示图像更新失败,我们记录错误信息以提醒用户注意此问题。最后,我们需要在删除程序时清除图表上映射的所有资源。
//+------------------------------------------------------------------+
//| Expert deinitialization function                                 |
//+------------------------------------------------------------------+
void OnDeinit(const int reason) {
   // Clean up by deleting the chart image object
   ObjectDelete(0, CHART_IMAGE_OBJECT_NAME); //--- Remove the chart image object during deinitialization
   // Dynamic resources are automatically freed when the EA is removed //--- Note that dynamic resources are automatically released
}
为了确保程序能够干净地退出,在 OnDeinit 事件处理程序中,我们调用 ObjectDelete 函数从图表上移除由 “CHART_IMAGE_OBJECT_NAME” 标识的图表图像对象。这样可以防止程序结束后留下任何残留对象。请注意,为缩放图像创建的动态资源在移除 Expert Advisor 时会被系统自动释放,无需额外的清理操作。当我们运行程序时,会得到以下结果。

从图像可以看出,我们成功创建了指定的图像并将其设置为资源,按照用户定义的方式动态缩放图像,从而实现了我们的目标。现在剩下的是对程序进行彻底的测试,这将在接下来的部分中讨论。
测试和验证
我们进行了所有测试,并将其编译为一个图形交换格式 (GIF) 可视化文件,展示了该图像的动态特性,能够响应图表调整大小和用户输入,且在此过程中不会损失任何质量。

结论
总之,我们构建了一个用于在 MetaTrader 5 图表上实现动态图像图形的 MQL5 工具,利用双三次插值实现了清晰、自适应的视觉效果。我们展示了如何实现并应用它来进行用户控制的图像缩放和定位。您可以定制此工具,以增强您的交易图表的功能性和美观度。
本文由MetaQuotes Ltd译自英文
原文地址: https://www.mql5.com/en/articles/17892
注意: MetaQuotes Ltd.将保留所有关于这些材料的权利。全部或部分复制或者转载这些材料将被禁止。
本文由网站的一位用户撰写,反映了他们的个人观点。MetaQuotes Ltd 不对所提供信息的准确性负责,也不对因使用所述解决方案、策略或建议而产生的任何后果负责。
