Creating Dynamic MQL5 Graphical Interfaces through Resource-Driven Image Scaling with Bicubic Interpolation on Trading Charts

Introduction
Customizing trading charts with dynamic visuals can elevate how we analyze markets, but achieving high-quality image rendering demands well-thought MetaQuotes Language 5 (MQL5) programming. In this article, we introduce a powerful tool that enables dynamic graphical interfaces, leveraging resource-driven image scaling with bicubic interpolation for crisp, adaptable chart visuals. We’ll explore the process through these steps:
- Overview of Dynamic Resource-Driven Image Graphics
- MQL5 Implementation
- Testing and Validation
- Conclusion
By the end, you’ll have a robust tool to transform your trading charts with professional, user-controlled image graphics.
Overview of Dynamic Resource-Driven Image Graphics
We aim to build an MQL5 tool that embeds and scales images on MetaTrader 5 charts, creating dynamic, user-controlled graphical interfaces. We will load a bitmap image as a resource, scale it to fit chart dimensions using bicubic interpolation and position it based on user inputs like anchoring to corners or centering dynamically. This will allow us to overlay custom visuals—logos or patterns—while maintaining aspect ratios and toggling background or foreground display, all optimized for real-time performance. That way, the charts will be more interesting and appealing.
For scaling, we will use bicubic interpolation over nearest neighbor and bilinear methods. The closest neighbor produces pixelated results and bilinear blurs details. Here is a detailed visualization as to why we chose Bicubic Interpolation over the other methods.
The graph visualization.

Resulting pixelation visualization.

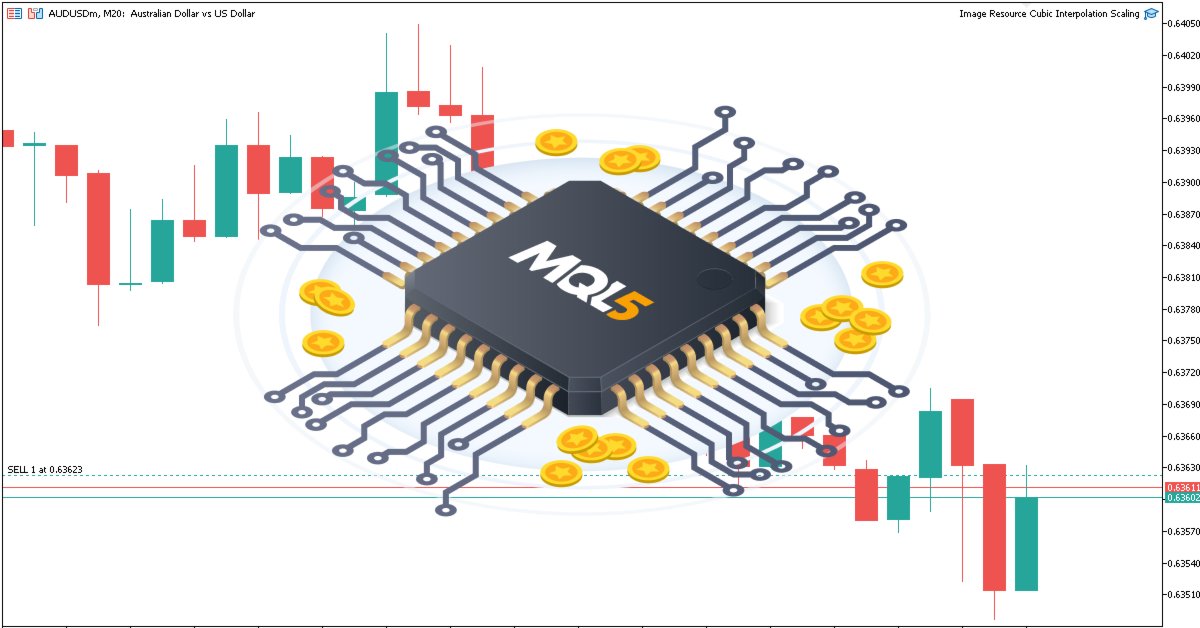
Bicubic, leveraging a 4x4 pixel neighborhood and cubic polynomials, ensures smoother gradients and sharper edges. We chose bicubic for its superior clarity and efficiency, ideal for dynamic resizing across chart sizes, delivering crisp visuals that enhance trading decisions. Here is an example of what we aim for, using a custom MQL5 image.

MQL5 Implementation
To create the program in MQL5, we will first need to have the images in the correct format which is Bitmap (BMP) format, which is uncompressed bitmapped images with high resolution, compared to the Joint Photographic Experts Group (JPEG). So, if you have a relevant image that you need to use and is in any other format, you can convert it using free online resources. As for us, these are the images that we will be using as we have already prepared them.

After obtaining files in the respective formats, we then need to move them to the images folder. You can simply open the Navigator, locate the Images folder, right-click on it, and select "Open Folder". This will open the default folder with two dollar and euro image files by default. You can paste your image files there. Here is a visual illustration.

Once that is done, we are now ready to roll. The first thing we will do is add the image as a resource.
//+------------------------------------------------------------------+
//|                   Image Resource Cubic Interpolation Scaling.mq5 |
//|                           Copyright 2025, Allan Munene Mutiiria. |
//|                                   https://t.me/Forex_Algo_Trader |
//+------------------------------------------------------------------+
#property copyright "Copyright 2025, Allan Munene Mutiiria."
#property link      "https://t.me/Forex_Algo_Trader"
#property version   "1.00"

#resource "\\Images\\mql5-circuit.bmp" //--- Include the image file as a resource
#define ORIGINAL_IMAGE_RESOURCE "::Images\\mql5-circuit.bmp" //--- Define the resource path for the original image
#define CHART_IMAGE_OBJECT_NAME "ChartImage" //--- Define the name of the chart image object
Here, we establish the groundwork for embedding and displaying our image on the charts. We utilize the #resource directive to incorporate a bitmap file located at "\Images\mql5-circuit.bmp" as a resource, ensuring it is readily available for our program to access.
We then define the "ORIGINAL_IMAGE_RESOURCE" macro, set to "::Images\mql5-circuit.bmp", to create a standardized reference to the image’s resource path, which we will use to load the image data. Additionally, we define the "CHART_IMAGE_OBJECT_NAME" macro as "ChartImage", which we will use as the unique identifier for the chart object displaying the image, enabling us to manage it by controlling its appearance on the chart.
The next thing that we will need is to define some global variables and inputs that we'll use throughout the program.
// Enum for selecting anchor corner
enum ENUM_ANCHOR_CORNER {
   TOP_LEFT = 0,     // Top-Left
   TOP_RIGHT = 1,    // Top-Right
   BOTTOM_LEFT = 2,  // Bottom-Left
   BOTTOM_RIGHT = 3  // Bottom-Right
};

// Input parameters for user customization
input bool LimitToOriginalSize = true; // Image scaling limited to original size
input bool ImageInBackground = true; // Image displayed in background (true) or foreground (false)
input bool CenterImageDynamically = true; // Image centered dynamically (true) or positioned manually (false)
input ENUM_ANCHOR_CORNER AnchorCorner = TOP_LEFT; // Anchor corner for manual positioning
input int XOffsetFromCorner = 100; // x-offset in pixels from the chosen corner
input int YOffsetFromCorner = 100; // y-offset in pixels from the chosen corner

// Counter for generating unique resource names for scaled images
int scaled_resource_counter = 0; //--- Initialize a counter for creating unique resource names
To configure user controls for image placement, we define the "ENUM_ANCHOR_CORNER" enumeration with options "TOP_LEFT", "TOP_RIGHT", "BOTTOM_LEFT", and "BOTTOM_RIGHT" for selecting a chart corner.
We set input parameters: "LimitToOriginalSize" (true) to cap scaling, "ImageInBackground" (true) for background/foreground display, "CenterImageDynamically" (true) for auto or manual positioning, "AnchorCorner" (TOP_LEFT) for corner selection, and "XOffsetFromCorner" and "YOffsetFromCorner" (100 pixels) for manual offsets. We also initialize "scaled_resource_counter" to 0 for unique scaled image names.
To display the image on the chart, we will use a custom function that will house all the logic.
//+------------------------------------------------------------------+
//| Display the image on the chart                                   |
//+------------------------------------------------------------------+
bool DisplayImageOnChart() {
   // Load the original image from the resource
   uint image_pixels[]; //--- Declare an array to store image pixel data
   uint original_image_width, original_image_height; //--- Declare variables for original image dimensions

   if (!ResourceReadImage(ORIGINAL_IMAGE_RESOURCE, image_pixels, original_image_width, original_image_height)) { //--- Read the image resource into the pixel array
      Print("Error: Failed to read original image data from resource."); //--- Log an error if reading the image fails
      return false; //--- Return false to indicate failure
   }

   // Get chart dimensions
   int chart_pixel_width = (int)ChartGetInteger(0, CHART_WIDTH_IN_PIXELS); //--- Retrieve the chart width in pixels
   int chart_pixel_height = (int)ChartGetInteger(0, CHART_HEIGHT_IN_PIXELS); //--- Retrieve the chart height in pixels

   // Calculate scaled dimensions while preserving aspect ratio
   double image_aspect_ratio = (double)original_image_width / original_image_height; //--- Calculate the aspect ratio of the original image
   double chart_aspect_ratio = (double)chart_pixel_width / chart_pixel_height; //--- Calculate the aspect ratio of the chart
   int scaled_image_width, scaled_image_height; //--- Declare variables for scaled image dimensions

   if (image_aspect_ratio > chart_aspect_ratio) { //--- Check if the image is wider relative to the chart
      scaled_image_width = chart_pixel_width; //--- Set scaled width to match chart width
      scaled_image_height = (int)(chart_pixel_width / image_aspect_ratio); //--- Calculate scaled height to maintain aspect ratio
   } else {
      scaled_image_height = chart_pixel_height; //--- Set scaled height to match chart height
      scaled_image_width = (int)(chart_pixel_height * image_aspect_ratio); //--- Calculate scaled width to maintain aspect ratio
   }

   // Limit scaling to original size if enabled
   if (LimitToOriginalSize) { //--- Check if the user has enabled limiting to original size
      scaled_image_width = MathMin(scaled_image_width, (int)original_image_width); //--- Restrict width to original width
      scaled_image_height = MathMin(scaled_image_height, (int)original_image_height); //--- Restrict height to original height
      // Recalculate one dimension to maintain aspect ratio
      if (scaled_image_width < scaled_image_height * image_aspect_ratio) { //--- Check if width is the limiting factor
         scaled_image_height = (int)(scaled_image_width / image_aspect_ratio); //--- Adjust height to maintain aspect ratio
      } else {
         scaled_image_width = (int)(scaled_image_height * image_aspect_ratio); //--- Adjust width to maintain aspect ratio
      }
   }

   // Log dimensions for debugging
   PrintFormat(
      "Original: %dx%d, Chart: %dx%d, Scaled: %dx%d",
      original_image_width, original_image_height,
      chart_pixel_width, chart_pixel_height,
      scaled_image_width, scaled_image_height
   ); //--- Log the original, chart, and scaled dimensions for debugging

   return true;

}
We begin by defining the "DisplayImageOnChart" function, which we will use to render our image on the chart. We start by declaring the "image_pixels" array to hold the pixel data of the image and the "original_image_width" and "original_image_height" variables to store the dimensions of the original image. Using the ResourceReadImage function, we load the image data from the "ORIGINAL_IMAGE_RESOURCE" macro into the "image_pixels" array, capturing its width and height. If this operation fails, we log an error message with the Print function and return false to indicate failure, halting further processing.
Next, we retrieve the chart’s dimensions to ensure the image fits appropriately. We use the ChartGetInteger function to obtain the chart’s width and height, storing them in "chart_pixel_width" and "chart_pixel_height" after casting to integers. To maintain the image’s proportions during scaling, we calculate the "image_aspect_ratio" by dividing "original_image_width" by "original_image_height" and the "chart_aspect_ratio" by dividing "chart_pixel_width" by "chart_pixel_height". These ratios will guide our scaling logic.
We then declare "scaled_image_width" and "scaled_image_height" to store the dimensions of the scaled image. To preserve the aspect ratio, we compare the "image_aspect_ratio" to the "chart_aspect_ratio". If the image is wider relative to the chart (i.e., "image_aspect_ratio" exceeds "chart_aspect_ratio"), we set "scaled_image_width" to "chart_pixel_width" and calculate "scaled_image_height" by dividing "chart_pixel_width" by "image_aspect_ratio". Otherwise, we set "scaled_image_height" to "chart_pixel_height" and compute "scaled_image_width" by multiplying "chart_pixel_height" by "image_aspect_ratio". This ensures the image fits the chart without distortion.
If the "LimitToOriginalSize" input is true, we restrict scaling to the original image dimensions to prevent upscaling. We use the MathMin function to cap "scaled_image_width" at "original_image_width" and "scaled_image_height" at "original_image_height". To maintain the aspect ratio after this restriction, we check if "scaled_image_width" is less than "scaled_image_height" multiplied by "image_aspect_ratio". If so, we recalculate "scaled_image_height" by dividing "scaled_image_width" by "image_aspect_ratio"; otherwise, we recalculate "scaled_image_width" by multiplying "scaled_image_height" by "image_aspect_ratio".
Finally, we log the original, chart, and scaled dimensions using the PrintFormat function. We will use this to track dynamic changes in the chart as shown below.

From the image, we can see that we already read the chart and image dimensions. What we need to do now is scale our image dynamically to fit in the chart. We will need a custom function to help achieve that.
//+------------------------------------------------------------------+
//| Scale the image using bicubic interpolation                      |
//+------------------------------------------------------------------+
void ScaleImage(
   uint &pixels[], int original_width, int original_height,
   int new_width, int new_height
) {
   uint scaled_pixels[]; //--- Declare an array for scaled pixel data
   ArrayResize(scaled_pixels, new_width * new_height); //--- Resize the array to fit the scaled image

   for (int y = 0; y < new_height; y++) { //--- Iterate over each row of the scaled image
      for (int x = 0; x < new_width; x++) { //--- Iterate over each column of the scaled image
         // Map to original image coordinates
         double original_x = (double)x * original_width / new_width; //--- Calculate the corresponding x-coordinate in the original image
         double original_y = (double)y * original_height / new_height; //--- Calculate the corresponding y-coordinate in the original image

         // Apply bicubic interpolation
         uint pixel = BicubicInterpolate(pixels, original_width, original_height, original_x, original_y); //--- Interpolate the pixel value
         scaled_pixels[y * new_width + x] = pixel; //--- Store the interpolated pixel in the scaled array
      }
   }

   ArrayResize(pixels, new_width * new_height); //--- Resize the original pixel array to the new dimensions
   ArrayCopy(pixels, scaled_pixels); //--- Copy the scaled pixels back to the original array
}
Here, we define the "ScaleImage" function to resize an image using bicubic interpolation. We declare the "scaled_pixels" array and use the ArrayResize function to size it for "new_width" * "new_height" pixels. We loop through each pixel, mapping coordinates to the original image with "original_x" and "original_y".
For each, we call the "BicubicInterpolate" function, which we will explain below, to compute the pixel value, storing it in "scaled_pixels" at "y" * "new_width" + "x". Finally, we resize "pixels" with ArrayResize and copy "scaled_pixels" into it using ArrayCopy for further chart processing.
Here is the function responsible for computing the pixel value via bicubic interpolation. Let us first define a function to compute the interpolation for a single color element, then we can use it to compute the interpolation for individual pixels.
//+------------------------------------------------------------------+
//| Perform bicubic interpolation for a single color component       |
//+------------------------------------------------------------------+
double BicubicInterpolateComponent(uchar &components[], double fractional_x, double fractional_y) {
   // Calculate cubic interpolation weights for x
   double weights_x[4]; //--- Declare an array for x interpolation weights
   double t = fractional_x; //--- Store the fractional x value
   weights_x[0] = (-0.5 * t * t * t + t * t - 0.5 * t);        //--- Calculate weight for x-1
   weights_x[1] = (1.5 * t * t * t - 2.5 * t * t + 1);         //--- Calculate weight for x
   weights_x[2] = (-1.5 * t * t * t + 2 * t * t + 0.5 * t);    //--- Calculate weight for x+1
   weights_x[3] = (0.5 * t * t * t - 0.5 * t * t);             //--- Calculate weight for x+2

   // Interpolate in x for each y
   double y_values[4]; //--- Declare an array for intermediate y values
   for (int j = 0; j < 4; j++) { //--- Iterate over rows of the neighborhood
      y_values[j] =
         weights_x[0] * components[j * 4 + 0] +
         weights_x[1] * components[j * 4 + 1] +
         weights_x[2] * components[j * 4 + 2] +
         weights_x[3] * components[j * 4 + 3]; //--- Perform interpolation in x for each y
   }

   // Calculate cubic interpolation weights for y
   double weights_y[4]; //--- Declare an array for y interpolation weights
   t = fractional_y; //--- Store the fractional y value
   weights_y[0] = (-0.5 * t * t * t + t * t - 0.5 * t); //--- Calculate weight for y-1
   weights_y[1] = (1.5 * t * t * t - 2.5 * t * t + 1); //--- Calculate weight for y
   weights_y[2] = (-1.5 * t * t * t + 2 * t * t + 0.5 * t); //--- Calculate weight for y+1
   weights_y[3] = (0.5 * t * t * t - 0.5 * t * t); //--- Calculate weight for y+2

   // Interpolate in y
   double result =
      weights_y[0] * y_values[0] +
      weights_y[1] * y_values[1] +
      weights_y[2] * y_values[2] +
      weights_y[3] * y_values[3]; //--- Perform interpolation in y to get the final value

   // Clamp the result to valid color range [0, 255]
   return MathMax(0, MathMin(255, result)); //--- Clamp the interpolated value to the valid color range
}
Here, we implement the "BicubicInterpolateComponent" function to perform bicubic interpolation for a single color component in our image scaling process. We declare the "weights_x" array to store interpolation weights for the x-axis and set "t" to "fractional_x", the fractional part of the x-coordinate.
We calculate four weights in "weights_x" using cubic polynomial formulas for positions x-1, x, x+1, and x+2, enabling smooth interpolation. Next, we declare the "y_values" array to hold intermediate results and iterate over four rows of a 4x4 pixel neighborhood. For each row "j", we compute "y_values[j]" by multiplying the "weights_x" values with corresponding color components from the "components" array at indices "j * 4 + 0" to "j * 4 + 3", performing x-axis interpolation.
We then declare the "weights_y" array and set "t" to "fractional_y" for y-axis weights, calculating them with the same cubic formulas for y-1, y, y+1, and y+2. We interpolate in the y-axis by computing "result" as the weighted sum of "y_values" using "weights_y". Finally, we clamp "result" to the valid color range [0, 255] using the MathMax and MathMin functions, ensuring the output is suitable for pixel color representation. We will also need color channel components for each pixel, so let's have a function for making the color channel extraction.
//+------------------------------------------------------------------+
//| Extract ARGB components from a pixel                             |
//+------------------------------------------------------------------+
void GetArgb(uint pixel, uchar &alpha, uchar &red, uchar &green, uchar &blue) {
   alpha = (uchar)((pixel >> 24) & 0xFF); //--- Extract the alpha channel from the pixel
   red = (uchar)((pixel >> 16) & 0xFF);   //--- Extract the red channel from the pixel
   green = (uchar)((pixel >> 8) & 0xFF);  //--- Extract the green channel from the pixel
   blue = (uchar)(pixel & 0xFF);          //--- Extract the blue channel from the pixel
}
We implement the "GetArgb" function to extract individual ARGB color components from a targeted pixel. We take a "pixel" value and reference variables "alpha", "red", "green", and "blue" to store the extracted components. Using bitwise operations, we isolate each component: we shift "pixel" right by 24 bits and mask with "0xFF" to extract "alpha"; shift by 16 bits and mask for "red"; shift by 8 bits and mask for "green"; and mask the lowest 8 bits for "blue". Each result is cast to uchar, ensuring the values fit the 0-255 range for color representation.
We used the "0xFF" system to ensure it masks the desired byte (8 bits) from a 32-bit unsigned integer pixel, which represents a color in ARGB format, ensuring accurate extraction of alpha, red, green, or blue values. Without "& 0xFF", we’d get unexpected results because the higher bits from other channels might remain. If you are wondering what the characters are, we are just talking about 255 in hexadecimal format. Have a look here.

Armed with these functions, we can now define a function to perform the bicubic interpolation for a single pixel to scale the image precisely.
//+------------------------------------------------------------------+
//| Perform bicubic interpolation for a single pixel                 |
//+------------------------------------------------------------------+
uint BicubicInterpolate(
   uint &pixels[], int width, int height,
   double x, double y
) {
   // Get integer and fractional parts
   int x0 = (int)x; //--- Extract the integer part of the x-coordinate
   int y0 = (int)y; //--- Extract the integer part of the y-coordinate
   double fractional_x = x - x0; //--- Calculate the fractional part of the x-coordinate
   double fractional_y = y - y0; //--- Calculate the fractional part of the y-coordinate

   // Define 4x4 neighborhood
   int x_indices[4], y_indices[4]; //--- Declare arrays for x and y indices
   for (int i = -1; i <= 2; i++) { //--- Iterate over the 4x4 neighborhood
      x_indices[i + 1] = MathMin(MathMax(x0 + i, 0), width - 1); //--- Calculate clamped x-index
      y_indices[i + 1] = MathMin(MathMax(y0 + i, 0), height - 1); //--- Calculate clamped y-index
   }

   // Get 16 pixels in the 4x4 neighborhood
   uint neighborhood_pixels[16]; //--- Declare an array for the 4x4 neighborhood pixels
   for (int j = 0; j < 4; j++) { //--- Iterate over rows of the neighborhood
      for (int i = 0; i < 4; i++) { //--- Iterate over columns of the neighborhood
         neighborhood_pixels[j * 4 + i] = pixels[y_indices[j] * width + x_indices[i]]; //--- Store the pixel value
      }
   }

   // Extract ARGB components
   uchar alpha_components[16], red_components[16], green_components[16], blue_components[16]; //--- Declare arrays for ARGB components
   for (int i = 0; i < 16; i++) { //--- Iterate over the neighborhood pixels
      GetArgb(
         neighborhood_pixels[i],
         alpha_components[i], red_components[i],
         green_components[i], blue_components[i]
      ); //--- Extract ARGB components for each pixel
   }

   // Perform bicubic interpolation for each component
   uchar alpha_out = (uchar)BicubicInterpolateComponent(alpha_components, fractional_x, fractional_y); //--- Interpolate the alpha component
   uchar red_out = (uchar)BicubicInterpolateComponent(red_components, fractional_x, fractional_y); //--- Interpolate the red component
   uchar green_out = (uchar)BicubicInterpolateComponent(green_components, fractional_x, fractional_y); //--- Interpolate the green component
   uchar blue_out = (uchar)BicubicInterpolateComponent(blue_components, fractional_x, fractional_y); //--- Interpolate the blue component

   // Combine components into a single pixel
   return (alpha_out << 24) | (red_out << 16) | (green_out << 8) | blue_out; //--- Combine ARGB components into a single pixel value
}
Here, we implement the "BicubicInterpolate" function to compute a single pixel’s color using the bicubic interpolation process. We start by extracting the integer parts of the input coordinates "x" and "y" into "x0" and "y0", and calculate their fractional parts as "fractional_x" and "fractional_y". We define "x_indices" and "y_indices" arrays to store a 4x4 neighborhood’s coordinates, iterating from -1 to 2 to compute indices around "x0" and "y0". Using MathMin and MathMax, we clamp these to valid ranges [0, "width"-1] and [0, "height"-1].
We then create the "neighborhood_pixels" array to hold 16 pixels from the 4x4 neighborhood, populating it by iterating over "y_indices" and "x_indices" to fetch pixel values from the "pixels" array at "y_indices[j] * width + x_indices[i]". Next, we declare "alpha_components", "red_components", "green_components", and "blue_components" arrays and use the "GetArgb" function to extract ARGB values for each of the 16 pixels in "neighborhood_pixels".
For each color component, we call the "BicubicInterpolateComponent" function with "fractional_x" and "fractional_y", storing results in "alpha_out", "red_out", "green_out", and "blue_out" as "uchar" values. Finally, we combine these into a single pixel value using bitwise shifts: "alpha_out" shifted 24 bits, "red_out" 16 bits, "green_out" 8 bits, and "blue_out", returning the resulting "uint" for use in the scaled image. We can now call the "ScaleImage" function to take effect.
// Scale the image using bicubic interpolation
ScaleImage(image_pixels, original_image_width, original_image_height, scaled_image_width, scaled_image_height); //--- Scale the image to the calculated dimensions
After calling the function, we can now create a new resource with the scaled image.
// Create a unique resource name for the scaled image
string scaled_resource_name = "::ScaledImage" + IntegerToString(scaled_resource_counter++); //--- Generate a unique resource name using the counter

// Create a new resource with the scaled image
if (!ResourceCreate(
   scaled_resource_name, image_pixels, scaled_image_width, scaled_image_height,
   0, 0, scaled_image_width, COLOR_FORMAT_ARGB_NORMALIZE
)) { //--- Create a new resource for the scaled image
   Print("Error: Failed to create resource for scaled image: ", scaled_resource_name); //--- Log an error if resource creation fails
   return false; //--- Return false to indicate failure
}
To generate and store a scaled image as a resource, we create a unique resource name by defining the "scaled_resource_name" string, concatenating "::ScaledImage" with the result of the IntegerToString function applied to "scaled_resource_counter", which we then increment to ensure uniqueness for subsequent resources.
Next, we use the ResourceCreate function to create a new resource with "scaled_resource_name", using the "image_pixels" array, "scaled_image_width", "scaled_image_height", and specifying offsets of 0, a width of "scaled_image_width", and the COLOR_FORMAT_ARGB_NORMALIZE format. If "ResourceCreate" fails, we log an error with the Print function, including "scaled_resource_name", and return false to indicate failure, halting further processing.
If we pass here, we just need to position and visualize the image on the chart, so let's first define the positioning coordinates.
// Determine image position based on user input
int x_offset, y_offset; //--- Declare variables for x and y offsets
if (CenterImageDynamically) { //--- Check if the user wants to center the image dynamically
   x_offset = (chart_pixel_width - scaled_image_width) / 2; //--- Calculate horizontal offset to center the image
   y_offset = (chart_pixel_height - scaled_image_height) / 2; //--- Calculate vertical offset to center the image
} else {
   // Set base position based on chosen anchor corner
   switch (AnchorCorner) { //--- Select the anchor corner based on user input
      case TOP_LEFT: //--- Handle Top-Left corner
         x_offset = XOffsetFromCorner; //--- Use user-defined x-offset from top-left
         y_offset = YOffsetFromCorner; //--- Use user-defined y-offset from top-left
         break;
      case TOP_RIGHT: //--- Handle Top-Right corner
         x_offset = chart_pixel_width - scaled_image_width - XOffsetFromCorner; //--- Calculate x-offset from right edge
         y_offset = YOffsetFromCorner; //--- Use user-defined y-offset from top
         break;
      case BOTTOM_LEFT: //--- Handle Bottom-Left corner
         x_offset = XOffsetFromCorner; //--- Use user-defined x-offset from left
         y_offset = chart_pixel_height - scaled_image_height - YOffsetFromCorner; //--- Calculate y-offset from bottom
         break;
      case BOTTOM_RIGHT: //--- Handle Bottom-Right corner
         x_offset = chart_pixel_width - scaled_image_width - XOffsetFromCorner; //--- Calculate x-offset from right edge
         y_offset = chart_pixel_height - scaled_image_height - YOffsetFromCorner; //--- Calculate y-offset from bottom
         break;
      default: //--- Handle unexpected case
         x_offset = XOffsetFromCorner; //--- Default to top-left x-offset
         y_offset = YOffsetFromCorner; //--- Default to top-left y-offset
   }
}
As for the positioning, we declare "x_offset" and "y_offset". If "CenterImageDynamically" is true, we center the image with "x_offset" as ("chart_pixel_width" - "scaled_image_width") / 2 and "y_offset" as ("chart_pixel_height" - "scaled_image_height") / 2.
Otherwise, a switch on "AnchorCorner" sets offsets: "TOP_LEFT" uses "XOffsetFromCorner" and "YOffsetFromCorner"; "TOP_RIGHT" sets "x_offset" to "chart_pixel_width" - "scaled_image_width" - "XOffsetFromCorner"; "BOTTOM_LEFT" sets "y_offset" to "chart_pixel_height" - "scaled_image_height" - "YOffsetFromCorner"; "BOTTOM_RIGHT" combines both. Default uses "XOffsetFromCorner" and "YOffsetFromCorner".
We now need a function to position the image via the defined coordinates.
//+------------------------------------------------------------------+
//| Create and position the chart image object                       |
//+------------------------------------------------------------------+
void CreateFullChartImage(
   string object_name, string resource_name,
   int x_size, int y_size,
   int x_offset, int y_offset,
   bool is_background
) {
   // Create the bitmap label object if it doesn't exist
   if (ObjectFind(0, object_name) < 0) { //--- Check if the object already exists
      ObjectCreate(0, object_name, OBJ_BITMAP_LABEL, 0, 0, 0); //--- Create a new bitmap label object
   }

   // Set object properties
   ObjectSetString(0, object_name, OBJPROP_BMPFILE, resource_name); //--- Set the resource file for the bitmap
   ObjectSetInteger(0, object_name, OBJPROP_XSIZE, x_size); //--- Set the width of the bitmap
   ObjectSetInteger(0, object_name, OBJPROP_YSIZE, y_size); //--- Set the height of the bitmap
   ObjectSetInteger(0, object_name, OBJPROP_XDISTANCE, x_offset); //--- Set the horizontal position of the bitmap
   ObjectSetInteger(0, object_name, OBJPROP_YDISTANCE, y_offset); //--- Set the vertical position of the bitmap
   ObjectSetInteger(0, object_name, OBJPROP_BACK, is_background); //--- Set whether the bitmap is in the background based on input

   // Redraw the chart to update the display
   ChartRedraw(0); //--- Redraw the chart to reflect changes
}
Here, we implement the "CreateFullChartImage" function to create and position an image object on the chart. We first check if the object named "object_name" exists using the ObjectFind function. If it doesn’t (result < 0), we create a new bitmap label object with the ObjectCreate function, specifying "object_name", OBJ_BITMAP_LABEL, and default chart coordinates.
We then set the object’s properties: using ObjectSetString, we link "resource_name" to OBJPROP_BMPFILE for the image source; with ObjectSetInteger, we set "OBJPROP_XSIZE" to "x_size", "OBJPROP_YSIZE" to "y_size", "OBJPROP_XDISTANCE" to "x_offset", and "OBJPROP_YDISTANCE" to "y_offset" for size and position; and OBJPROP_BACK to "is_background" to toggle background or foreground display. Finally, we call the ChartRedraw function to update the chart display with the new or modified image object. We then call this function to visualize the image.
CreateFullChartImage(
   CHART_IMAGE_OBJECT_NAME, scaled_resource_name,
   scaled_image_width, scaled_image_height,
   x_offset, y_offset, ImageInBackground
); //--- Create and position the chart image object, using user-specified background setting
After calling the function, we are all set and we can call this main function now on the OnInit event handler to create the first image.
//+------------------------------------------------------------------+
//| Expert initialization function                                   |
//+------------------------------------------------------------------+
int OnInit() {
   // Display the image on the chart during initialization
   if (!DisplayImageOnChart()) { //--- Attempt to display the image on the chart
      Print("Error: Failed to display the initial image."); //--- Log an error if image display fails
      return (INIT_FAILED); //--- Return failure status if initialization fails
   }
   return (INIT_SUCCEEDED); //--- Return success status if initialization succeeds
}
On the OnInit event handler, we call the "DisplayImageOnChart" function to render the image during initialization. If "DisplayImageOnChart" returns false, indicating a failure to display the image, we log an error message and return INIT_FAILED to signal that initialization has failed, halting the program. If the display is successful, we return INIT_SUCCEEDED to indicate that initialization was completed successfully, allowing the program to proceed. On compilation, here is what we have.

From the image, we can see that we can map the resource image on the initial run. However, we need to make the image responsive when the chart dimensions change. Thus, we will need the OnChartEvent event handler.
//+------------------------------------------------------------------+
//| Chart event handler                                              |
//+------------------------------------------------------------------+
void OnChartEvent(
   const int event_id,         // Event ID
   const long &long_param,     // Long type event parameter
   const double &double_param, // Double type event parameter
   const string &string_param  // String type event parameter
) {
   // Handle chart resize events to update the image
   if (event_id == CHARTEVENT_CHART_CHANGE) { //--- Check if the event is a chart change (e.g., resize)
      if (!DisplayImageOnChart()) { //--- Attempt to update the image on the chart
         Print("Error: Failed to update image on chart resize."); //--- Log an error if image update fails
      }
   }
}
Here, we define the OnChartEvent event handler to handle chart-related events in our program, specifically focusing on chart resizing. We check if "event_id" equals CHARTEVENT_CHART_CHANGE, which indicates a chart modification such as resizes. If true, we call the "DisplayImageOnChart" function to update the image’s display to match the new chart dimensions. If "DisplayImageOnChart" returns false, signaling a failure to update the image, we log an error message to alert the user of the issue. We finally need to remove all the resources we mapped on the chart when we remove the program.
//+------------------------------------------------------------------+
//| Expert deinitialization function                                 |
//+------------------------------------------------------------------+
void OnDeinit(const int reason) {
   // Clean up by deleting the chart image object
   ObjectDelete(0, CHART_IMAGE_OBJECT_NAME); //--- Remove the chart image object during deinitialization
   // Dynamic resources are automatically freed when the EA is removed //--- Note that dynamic resources are automatically released
}
To ensure a clean exit, on the OnDeinit event handler, we call the ObjectDelete function to remove the chart image object identified by "CHART_IMAGE_OBJECT_NAME" from the chart. This prevents any residual objects from remaining after the program ends. Note that dynamic resources, such as those created for scaled images, are automatically freed by the system when the Expert Advisor is removed, requiring no additional cleanup. When we run the program, we have the following outcome.

From the image, we can see that we create the defined image and set it as a resource and scale it dynamically as defined by user, achieving our objective. What now remains is testing the program thoroughly, and that is handled in the next topic below.
Testing and Validation
We did all the testing and compiled it in a Graphical Interchange Format (GIF) visualization showing that it is dynamic and responds to chart resizes and user inputs, without losing any quality within the process.

Conclusion
In conclusion, we’ve built an MQL5 tool for dynamic image graphics on MetaTrader 5 charts, using bicubic interpolation for crisp, adaptable visuals. We’ve shown how to implement and apply it for user-controlled image scaling and positioning. You can tailor this tool to enhance your trading charts’ functionality and aesthetics.
Warning: All rights to these materials are reserved by MetaQuotes Ltd. Copying or reprinting of these materials in whole or in part is prohibited.
This article was written by a user of the site and reflects their personal views. MetaQuotes Ltd is not responsible for the accuracy of the information presented, nor for any consequences resulting from the use of the solutions, strategies or recommendations described.

- Free trading apps
- Over 8,000 signals for copying
- Economic news for exploring financial markets
You agree to website policy and terms of use