KT Renko Patterns MT5
- Indicators
-
KEENBASE SOFTWARE SOLUTIONS
 Keenbase Trading develops professional MetaTrader 4 and MetaTrader 5 indicators and Expert Advisors designed to help traders make more informed trading decisions.
 - Version: 3.0
- Updated: 8 October 2026
- Activations: 10
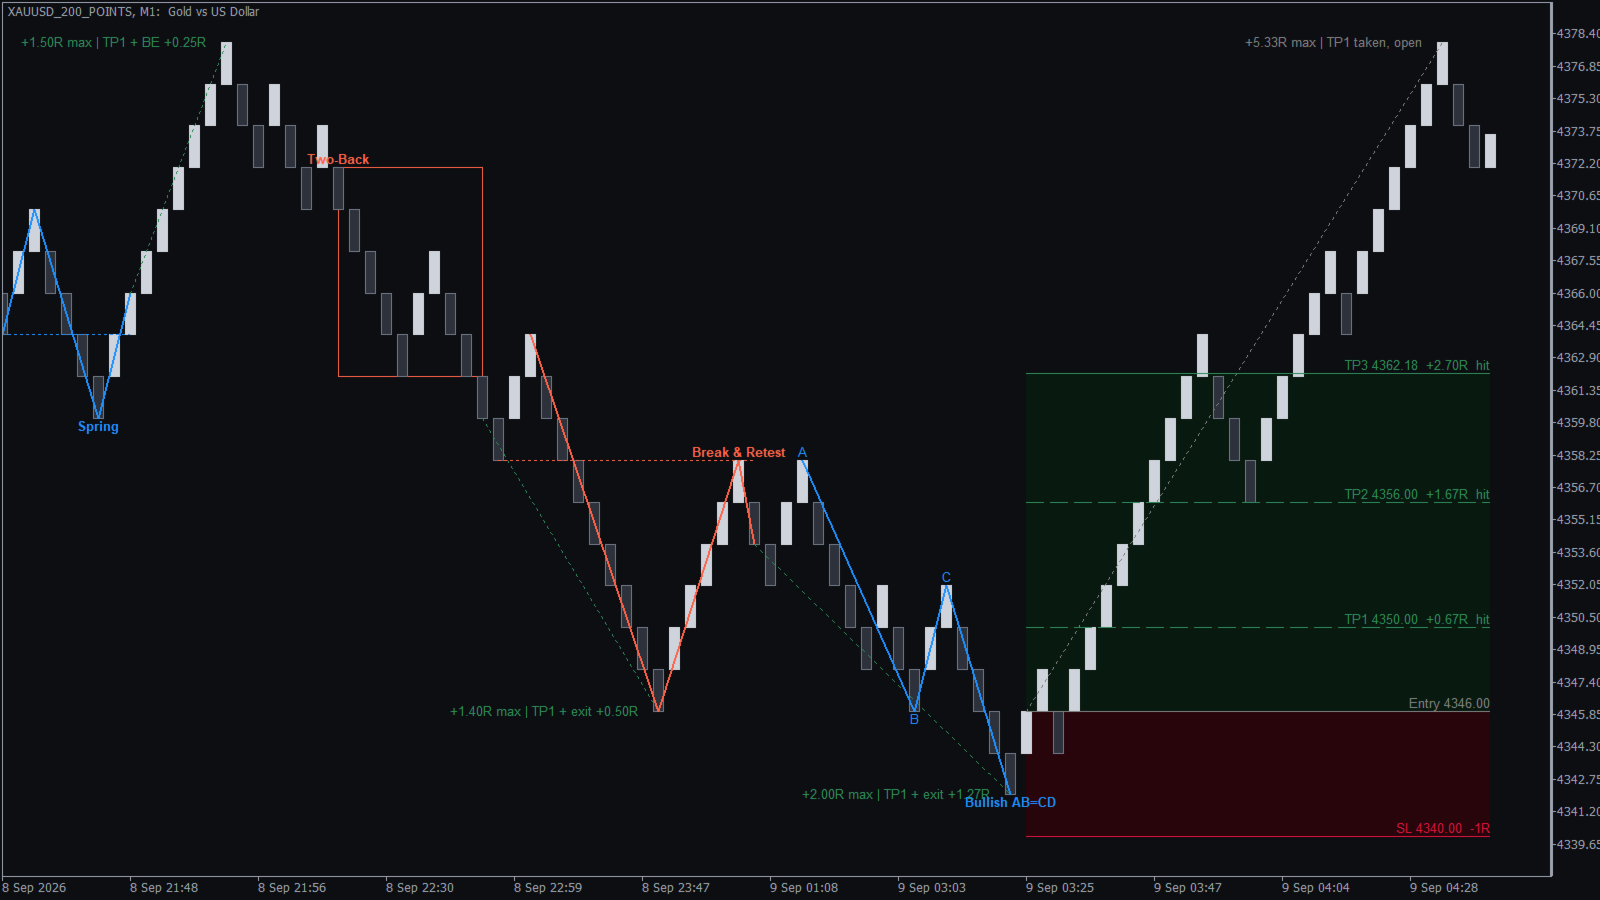
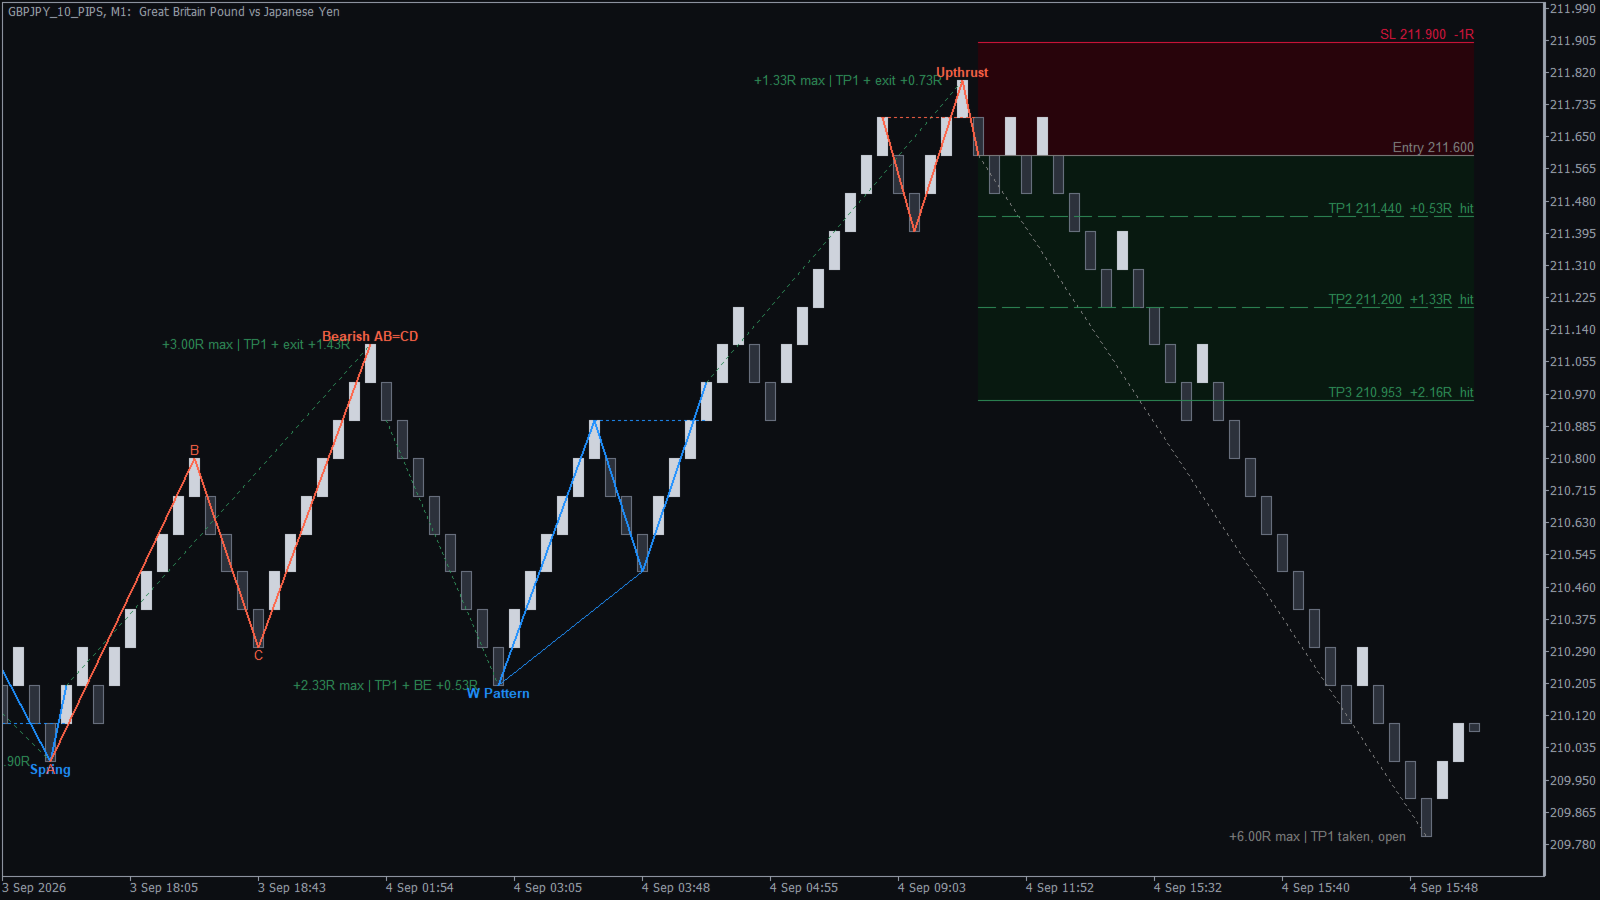
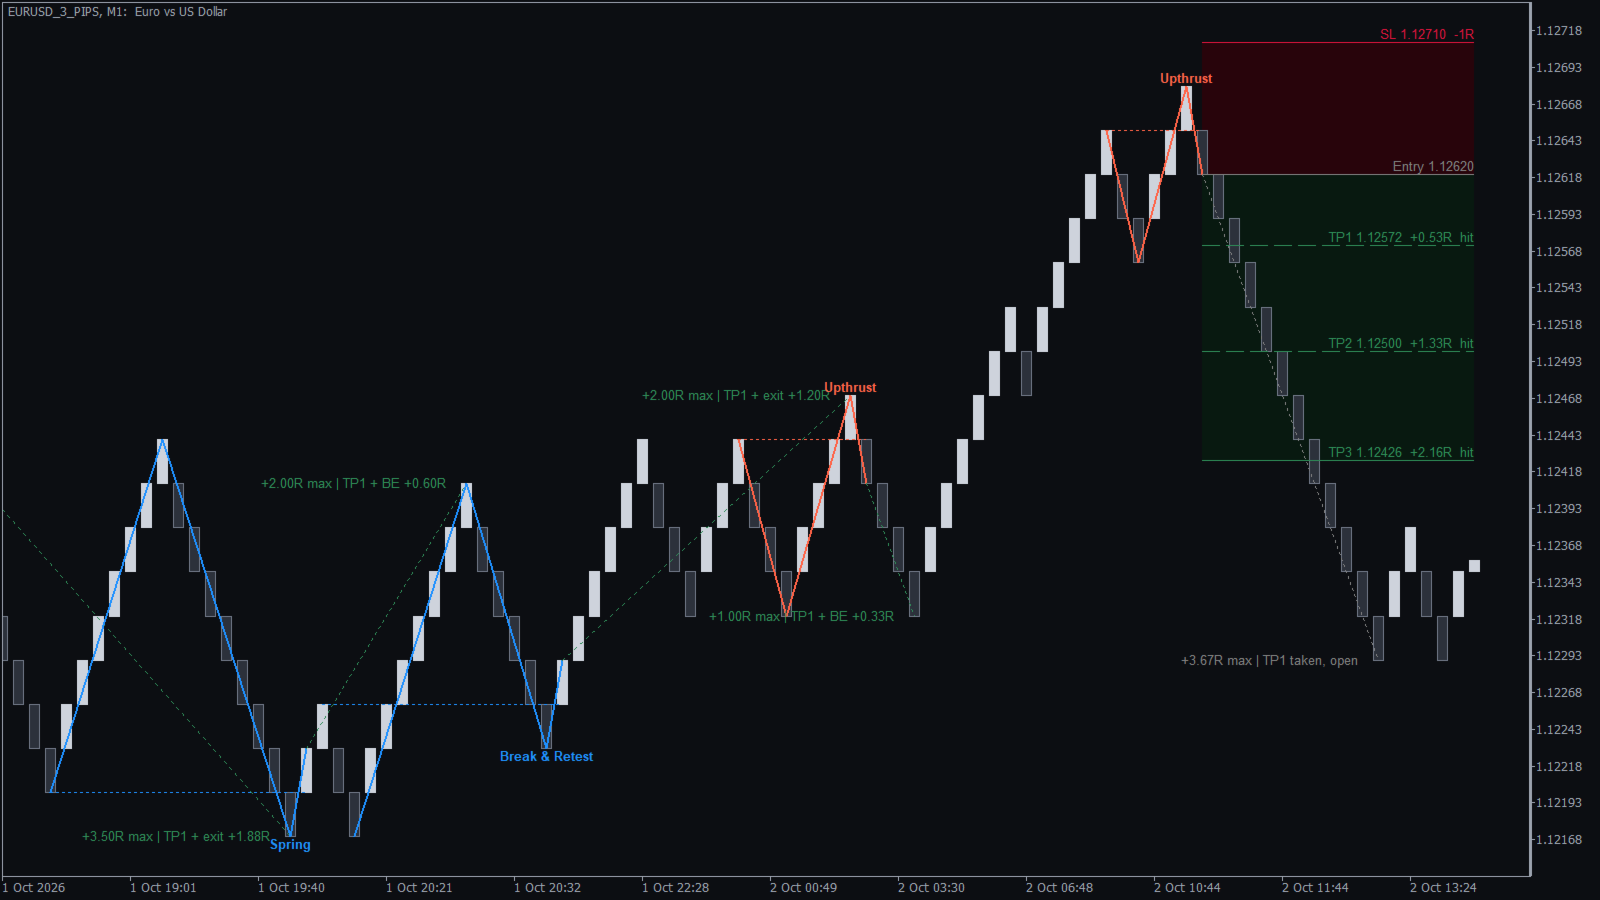
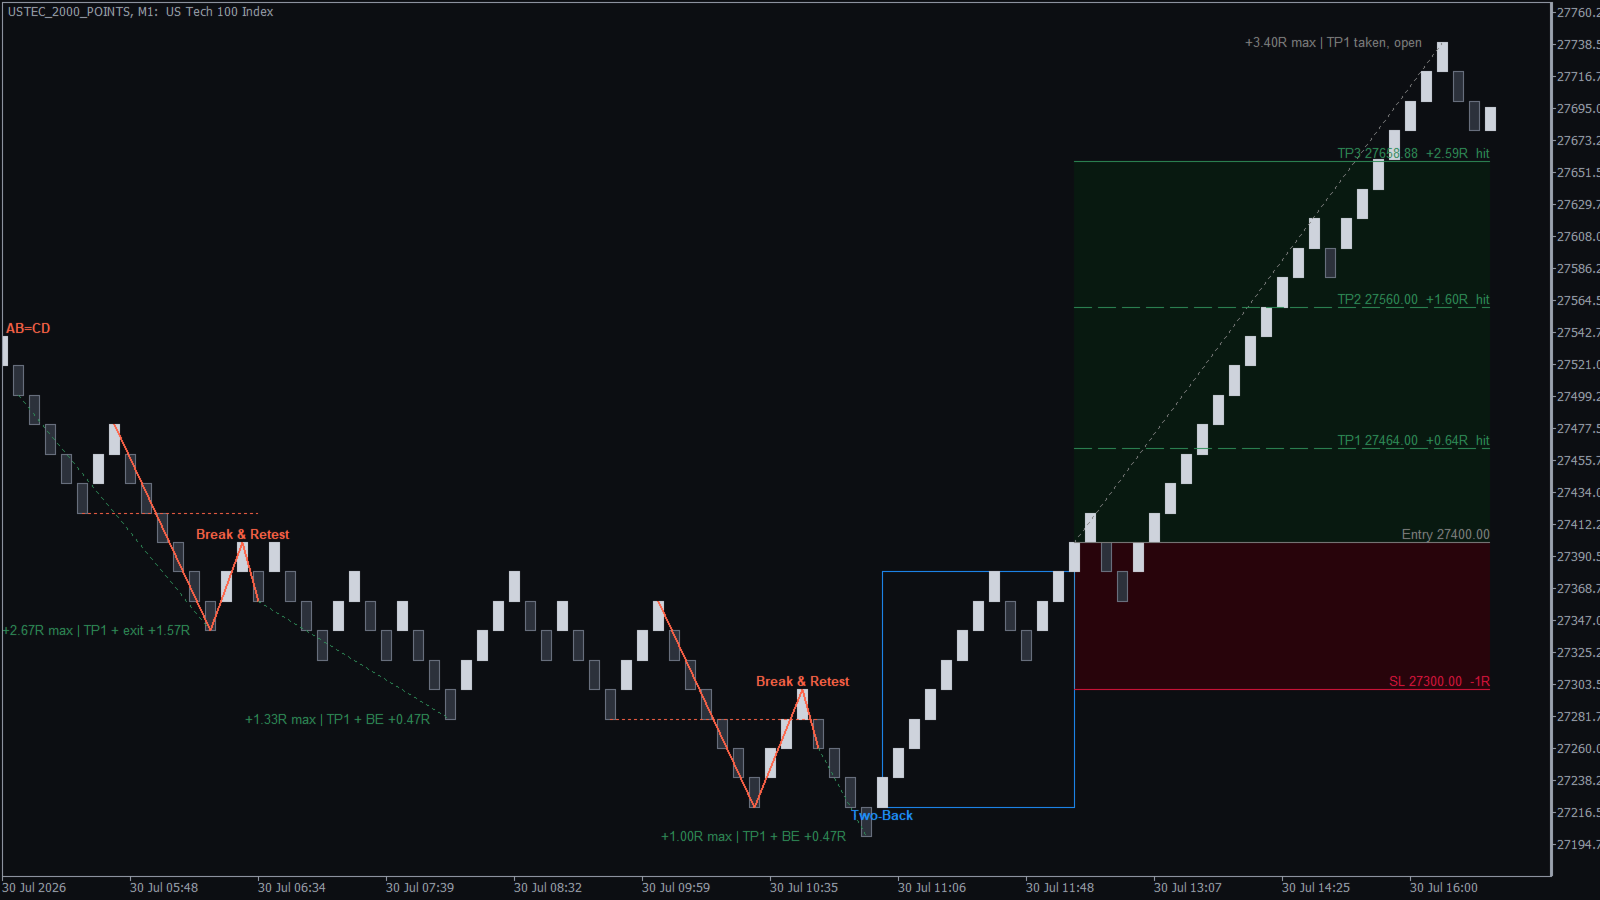
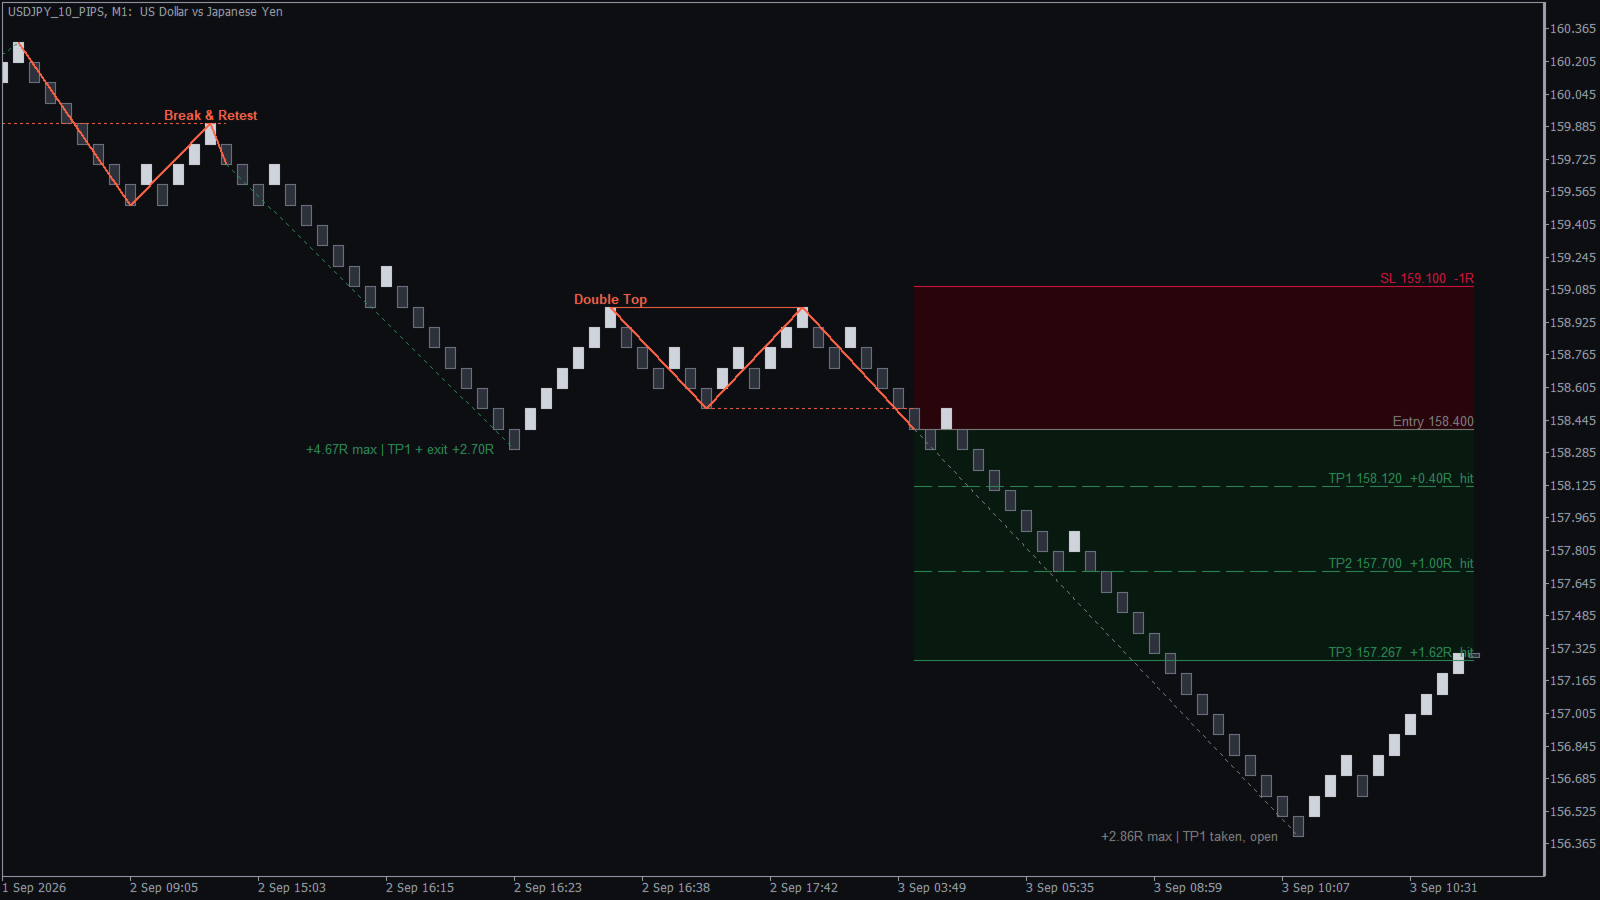
A Renko patterns indicator for MetaTrader that turns every pattern into a complete trade plan: the entry, a stop loss beyond the pattern and three take profit targets, drawn on your Renko chart as soon as a closed brick confirms the breakout.
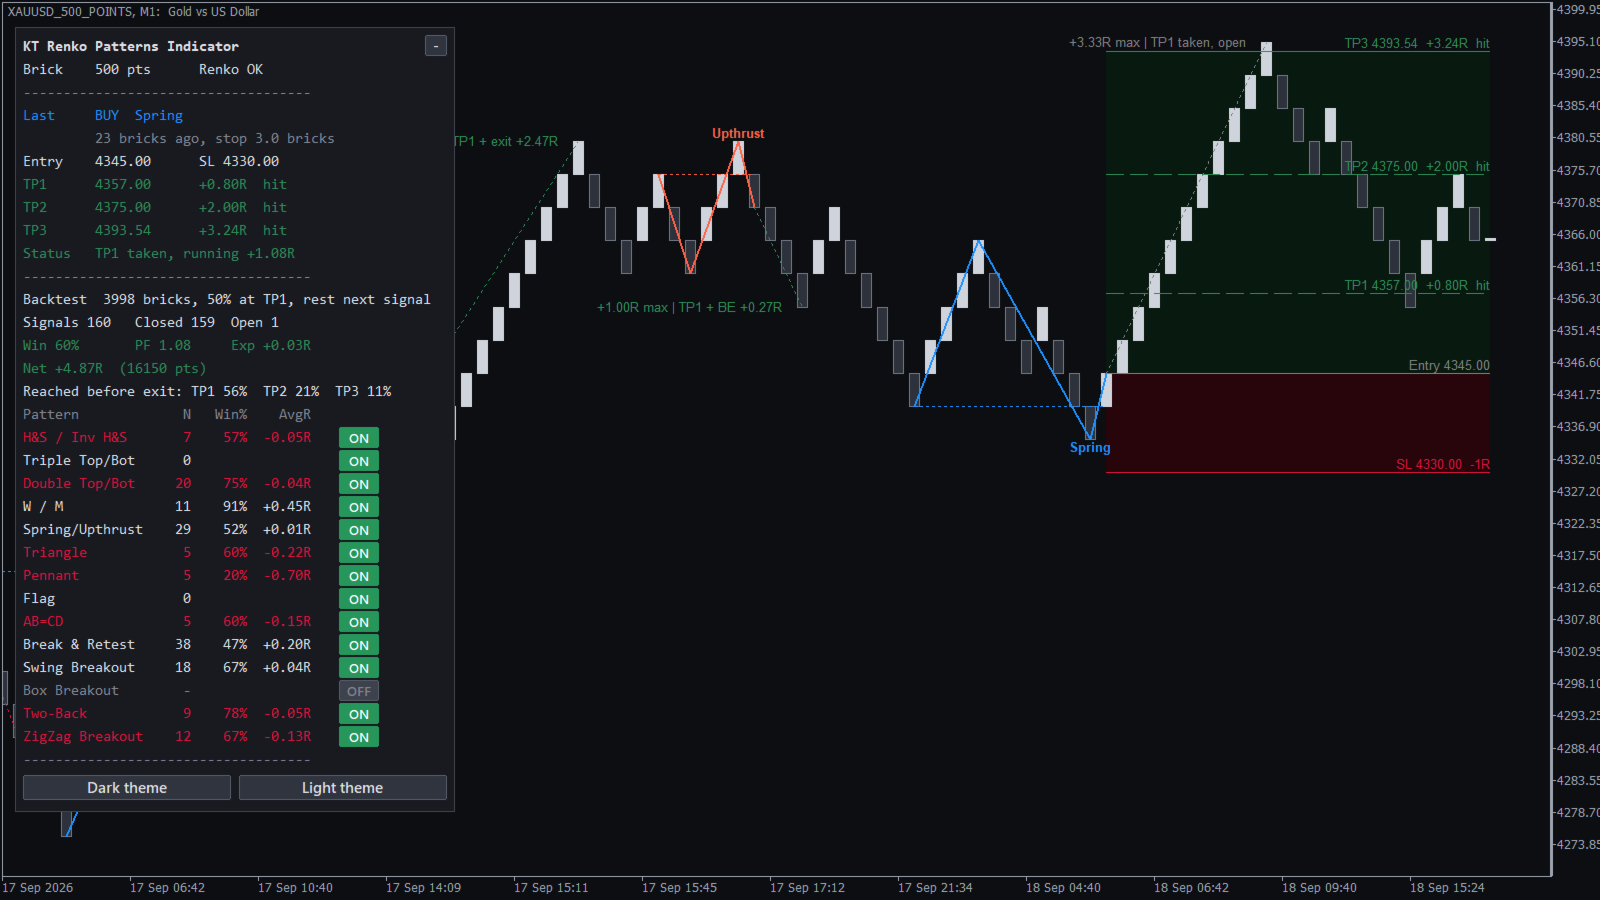
It also keeps the score. A dashboard follows every past signal to its stop loss or exit, so you see how each of the 14 patterns has worked on your own symbol and brick size before you take the next signal.
What you get
- 14 Renko chart patterns: Double Top and Bottom, Triple Top and Bottom, Head & Shoulders, W and M, Spring and Upthrust, AB=CD, Bull and Bear Flag, Power Pennant, Ascending and Descending Triangle, Break & Retest, Swing Breakout, Two-Back, ZigZag Breakout and Box Breakout.
- Confirmed on the closed brick: a signal appears only when a brick closes through the breakout level. The brick that is still forming never creates a signal, and signals never repaint.
- Trade plan box: the latest signal shows its entry, stop loss, TP1, TP2 and TP3, each with its price and its size in R, where 1R is your risk.
- Result line on every past signal: the best move of the trade and how it ended, so you can judge a pattern by scrolling back through the chart.
- Dashboard with the full record: win rate, profit factor, expectancy, net result in R and in pips or points, how often each target was reached, and the record of each pattern in its own row.
- One click pattern switch: click a pattern on the dashboard to switch it off, and the record is calculated again without it.
- Alerts with the whole plan: popup, sound, email and push notifications with the pattern name, entry, stop loss and all three targets.
How to use it
Attach the indicator to a Renko chart. It reads the brick size by itself, and the dashboard shows "Renko OK" when it reads the chart correctly. A blue arrow marks a buy and a red arrow marks a sell, with the pattern lines and the pattern name drawn on the bricks.
Before you trade, look at the dashboard. Keep the patterns with a positive average R on your symbol, switch off the others with one click, and let the record decide which signals you take.
Recommendations
Use a Renko chart with bricks of equal size; the KT Renko Live Chart Generator makes one in MetaTrader. The indicator works on forex, gold, indices and crypto. Open the same symbol at two brick sizes and keep the one whose dashboard shows the better average R. Your EA can also read every signal with its entry, stop loss and three targets.
Input parameters
- History Bricks to Scan: how many bricks are scanned and included in the record (0 uses the whole chart).
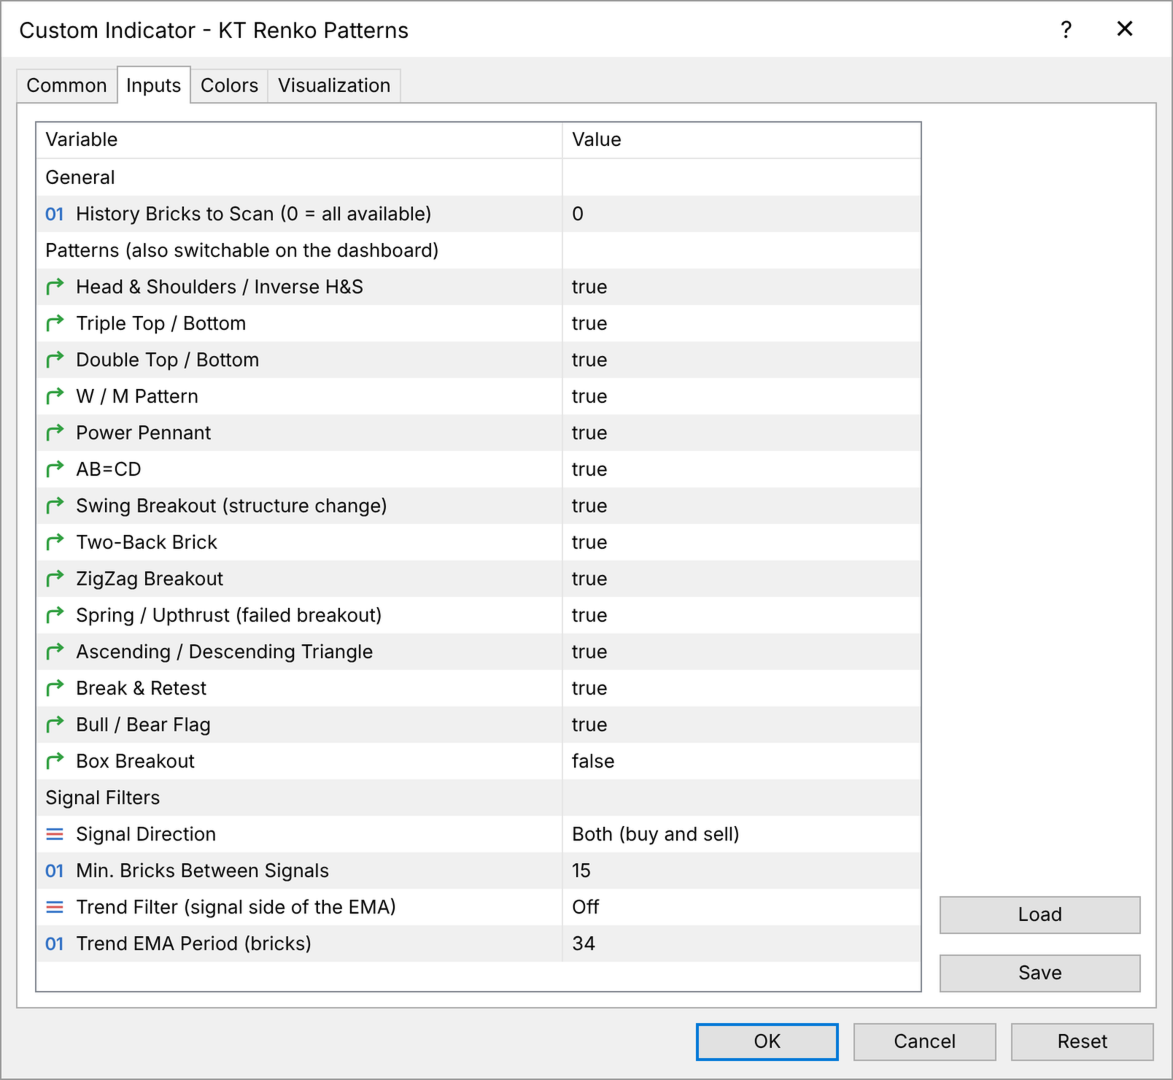
- Pattern switches: switch each of the 14 patterns on or off. Box Breakout is off by default.
- Signal Direction: buy and sell signals, buy signals only, or sell signals only.
- Min. Bricks Between Signals: the smallest gap between two signals (15 by default).
- Trend Filter and Trend EMA Period: keep signals on the trend side of an EMA counted in bricks (34 by default), for continuation patterns only or for all patterns.
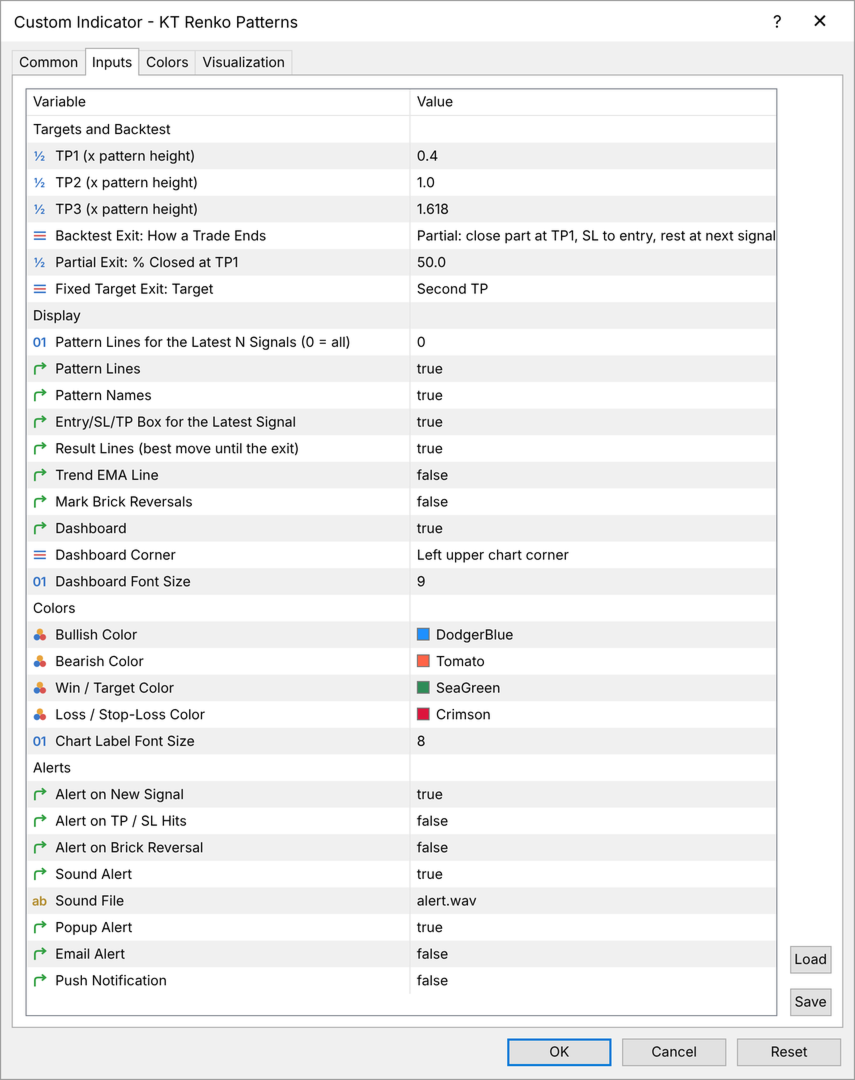
- TP1, TP2, TP3: the distance of each target from the entry, as a part of the pattern height (0.4, 1.0 and 1.618).
- Backtest Exit: how the record closes each trade: part at TP1 and the rest at the next signal, at the next signal, or at a fixed target.
- Display: pattern lines and names, the trade plan box, result lines, the trend EMA line, brick reversal marks, the dashboard corner and font size, and the colors.
- Alerts: new signal, target and stop loss hits, and brick reversals, as popup, sound, email and push notifications.
Trade the patterns that prove themselves
Every signal comes with a stop loss, three targets and the record of its pattern on your own chart. Add the KT Renko Patterns indicator to your Renko chart and take the signals your numbers support.