Trend Sensor MT5
- Indicators
- Yuriy Lyachshenko
- Version: 1.30
- Updated: 20 November 2023
- Activations: 5
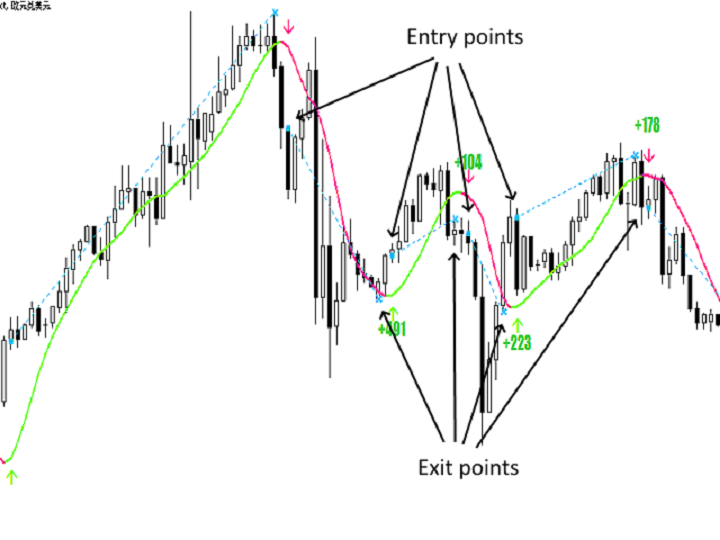
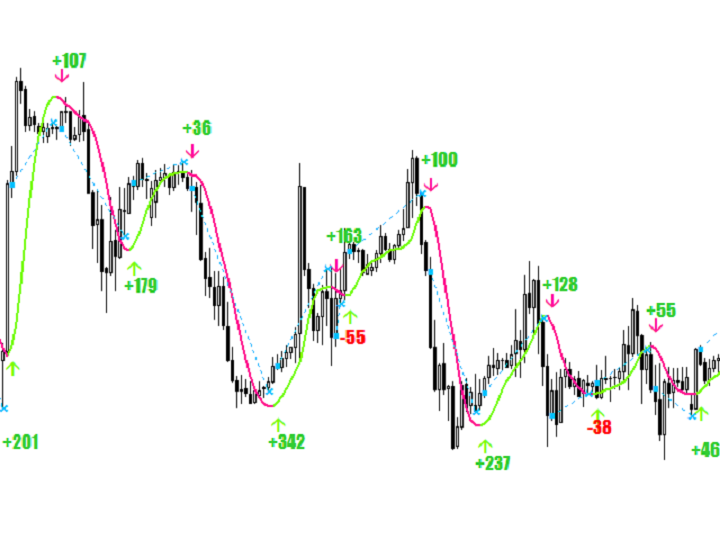
The indicator shows the most appropriate entry and exit points. It also displays statistical data on all signals for better analysis of trading.
With the help of this indicator you will be able to better understand the market.
As soon as the power of the trend begins to weaken (this will be shown on the panel), the trend line will gravitate to the horizontal position - this is the signal to exit the trade. Or you can exit when the average/median profit level is reached.
The indicator was the result of my trading experience since 2010.
Features
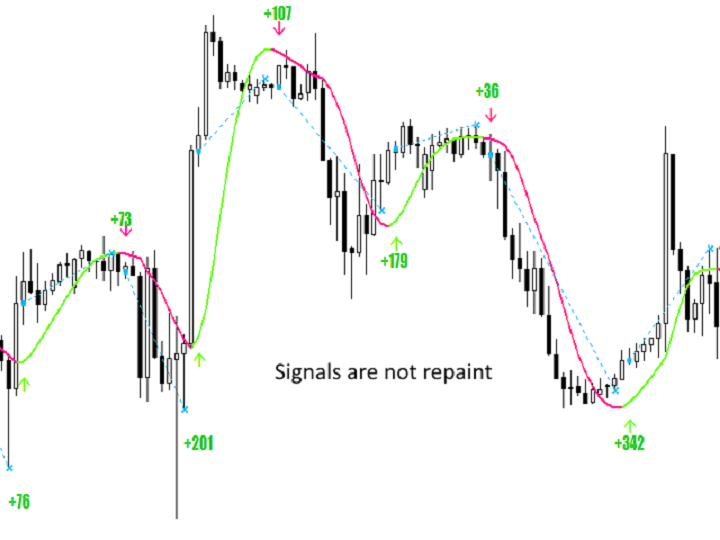
- This indicator does not redraw. What is printed on the historical chart will also be printed in real time.
- It can be used to trade any assets: cryptocurrencies, stocks, metals, indices, commodities and currencies.
- Works on all timeframes.
- Signals to enter appear at the opening of a new candle.
- The signals for exiting the trade are given tentatively, because often you can close the trade with a larger profit.
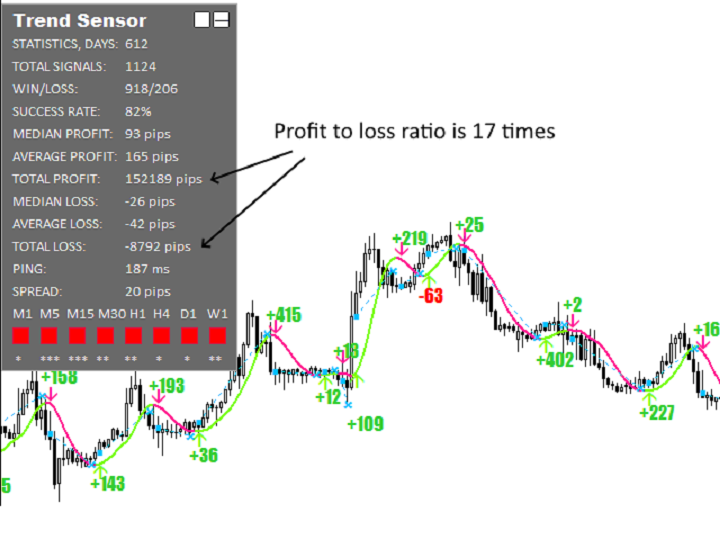
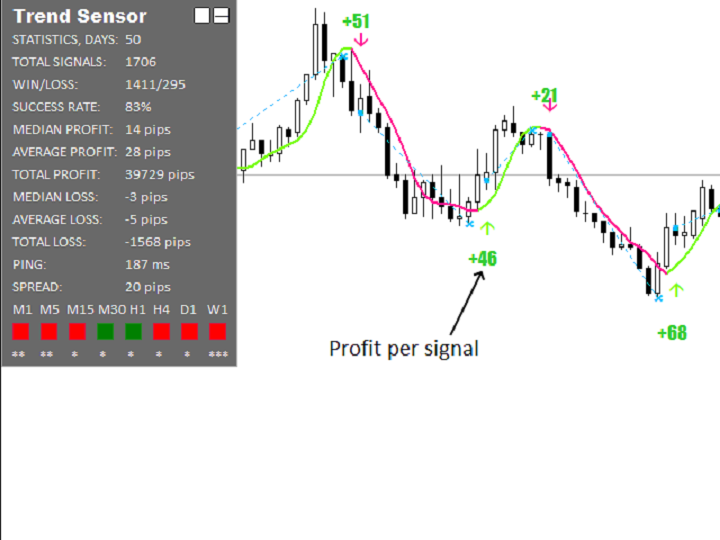
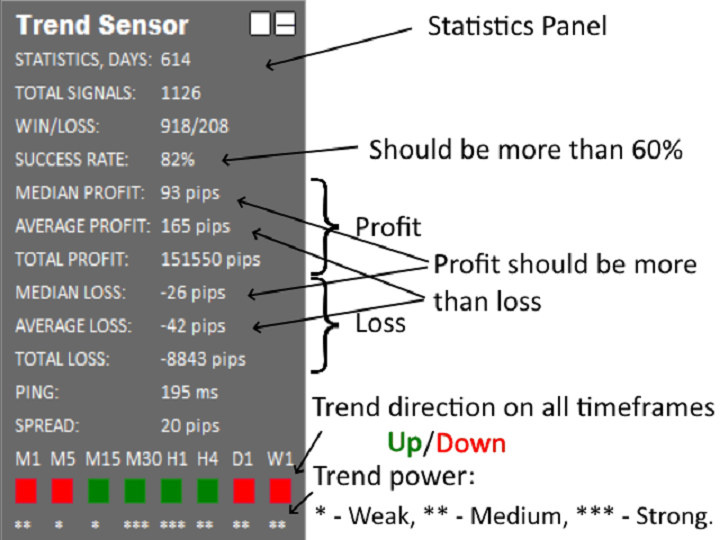
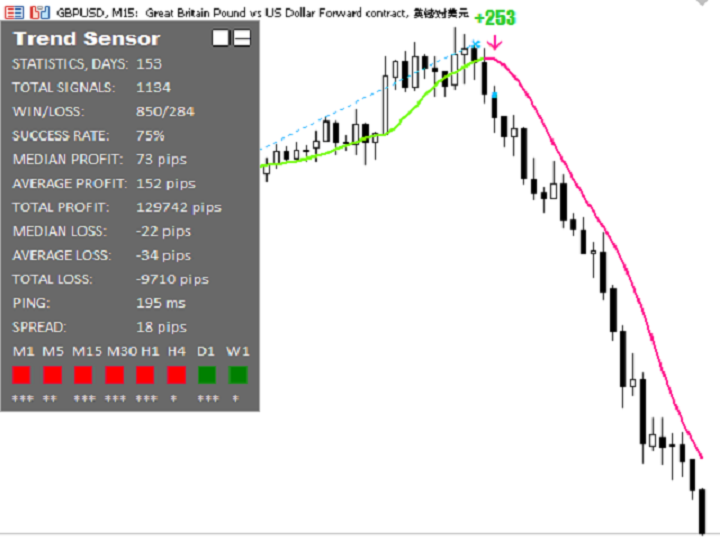
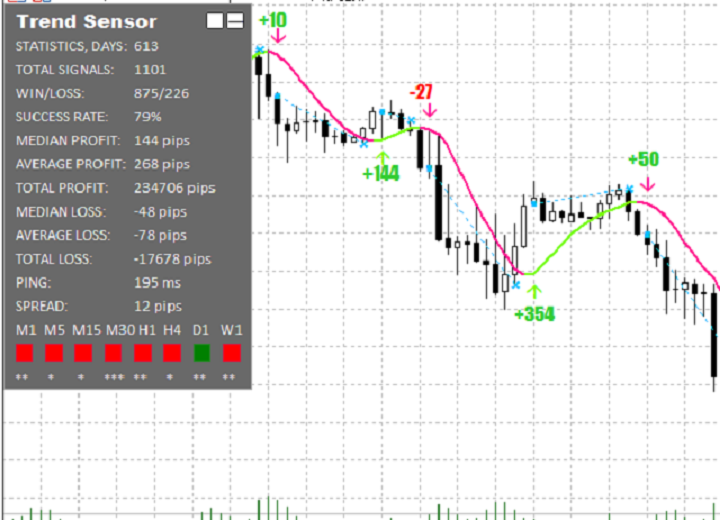
- On the top left there is a detailed panel of trade statistics, which can be minimized.
- Shows the direction of the trend and its power at once on timeframes from M1 to W1.
- Has a lightweight code, so it does not load and does not slow down the terminal.
- Uses a special formula for calculating the moving average, which determines the direction of the trend.
- In order not to miss a signal to enter a trade you can receive notification in the Alert window and on Push.
- For users of all levels, from beginners to experts.
Statistics panel
- Number of days from which the signal history is taken.
- The total number of signals on which the statistics is given.
- The ratio of the number of profitable and losing signals.
- The percentage of the total amount of profitable signals.
- Median profit per signal.
- Average profit per signal.
- Total profit of all signals.
- Median loss per signal.
- Average loss per signal.
- Total loss of all signals.
- Last ping to the broker's server.
- Current spread.
- Direction of the trend UP/DOWN on timeframes from M1 to W1.
- Measures the power of the trend: * Weak ** Medium *** Strong.
Parameters
| Trading style | Aggressive Medium Safe (indicator sensitivity, the more sensitive the more signals) |
| Working hours | indicator working hours in which interval signals to enter the market appear (time format should be xx:xx-xx:xx e.g. 00:00-23:59) |
| Show statistics | on/off show statistics panel of signals in the left top corner of the chart |
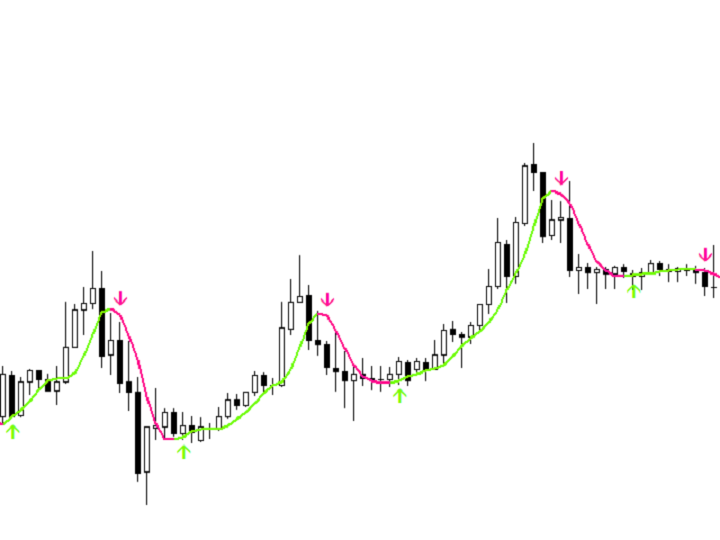
| Show line | on/off show trend line |
| Show arrows | on/off show arrows when trend changes |
| Show entry/exit | on/off show entry and exit points from market |
| Use alert notification | on/off pop-up window with notification and sound notification |
| Use push notification | on/off push notification |
If you have any questions or difficulties, please send me a private message.