Pivot Point MT4 Indicator by PipTick
- Indicators
-
Michal Jurnik
 "Talent is cheaper than table salt. What separates the talented individual from the successful one is a lot of hard work." - Stephen King. Those few words reflect myself very well. I am probably not the most talented developer in the world but I truly believe in hard work, professional attitude and
 - Version: 1.1
- Updated: 1 December 2021
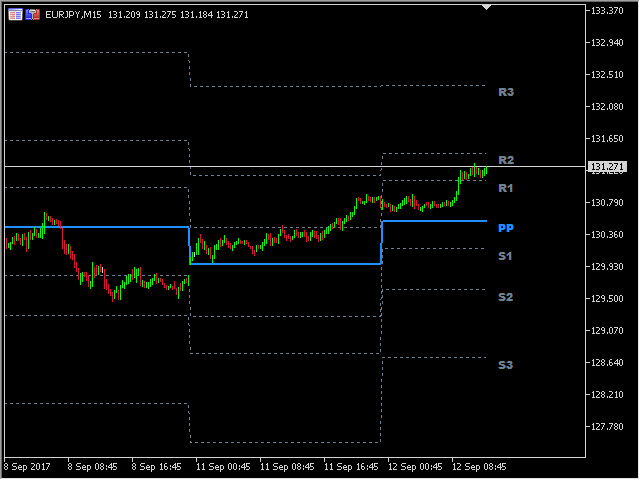
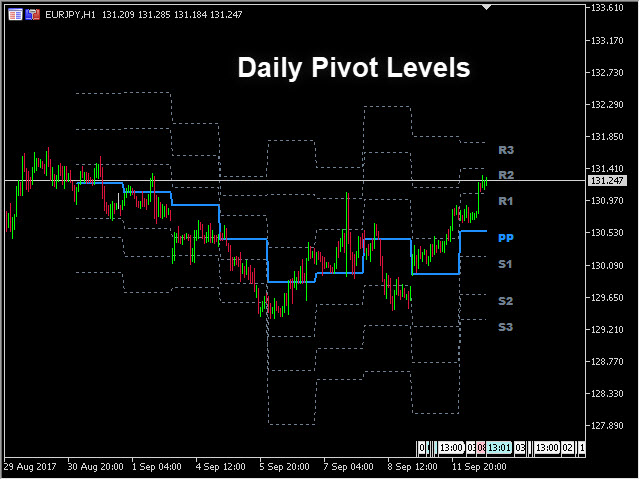
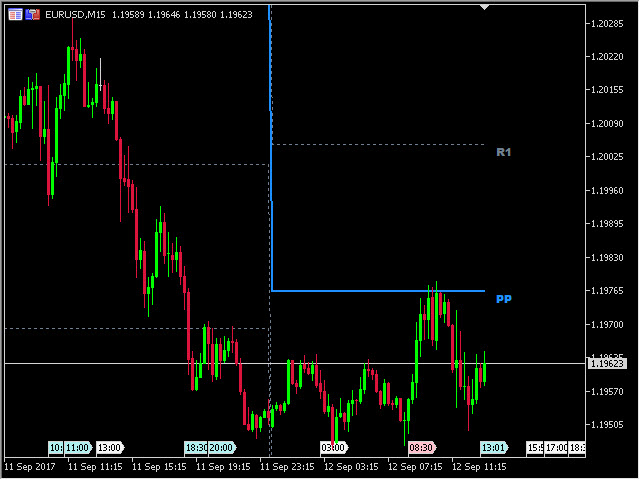
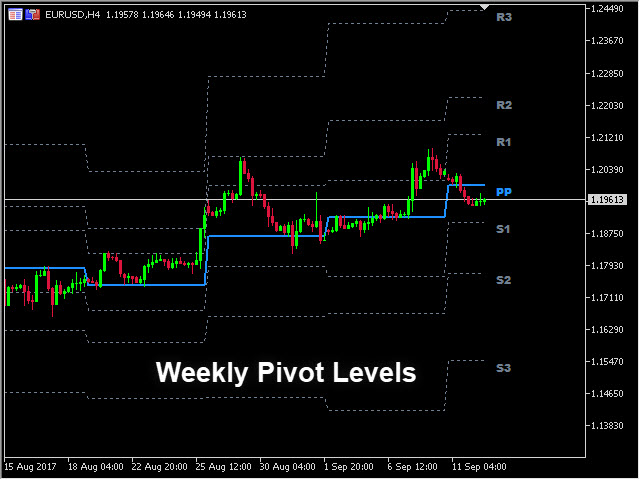
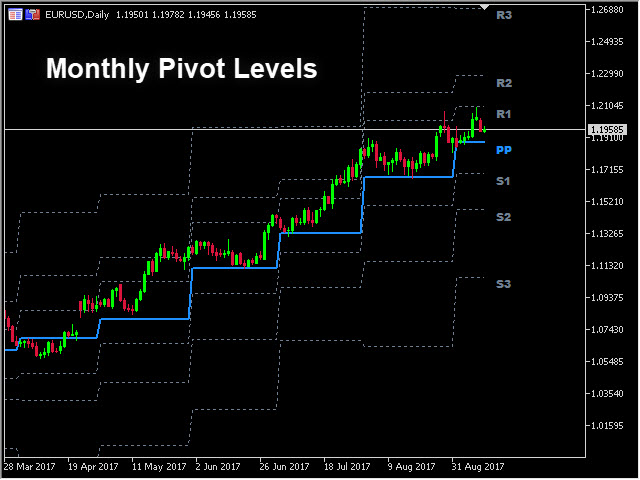
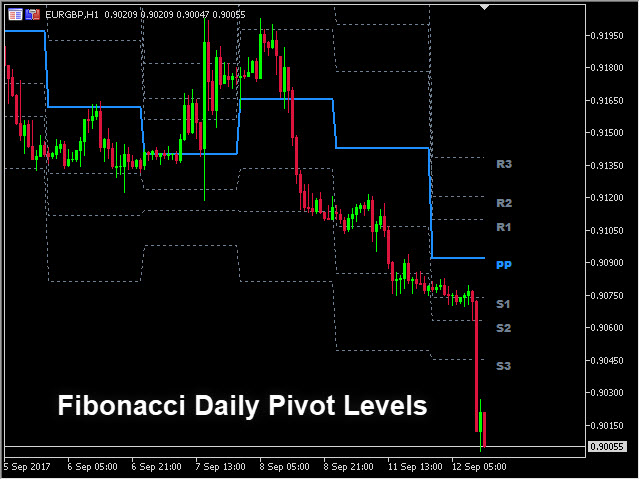
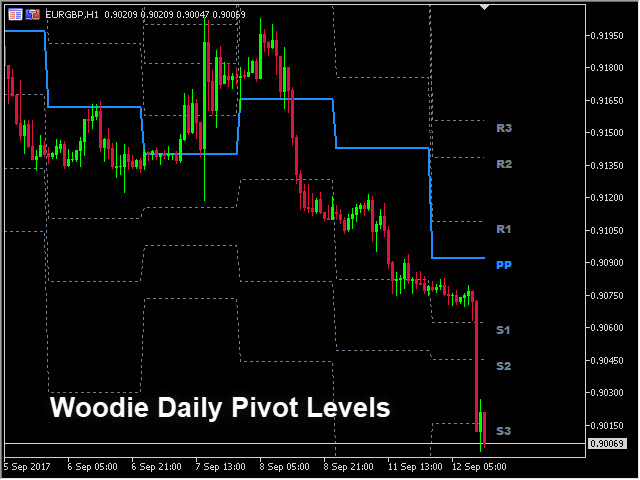
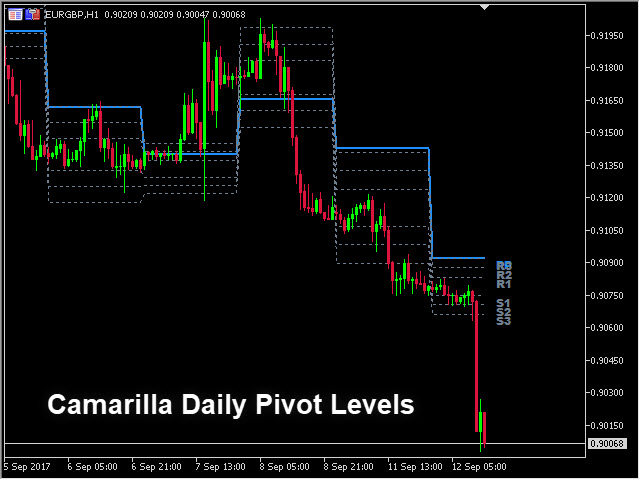
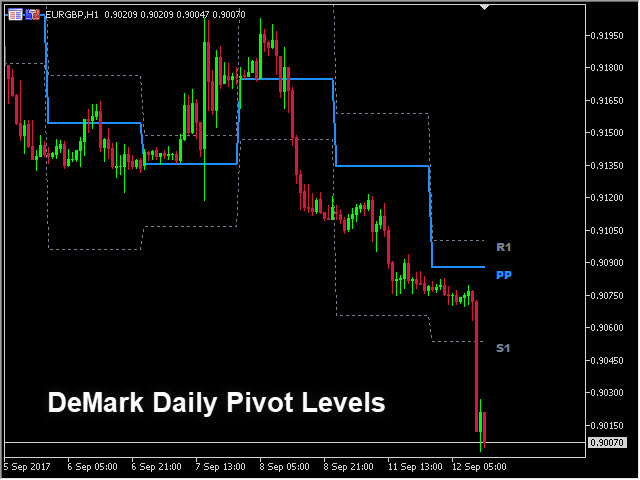
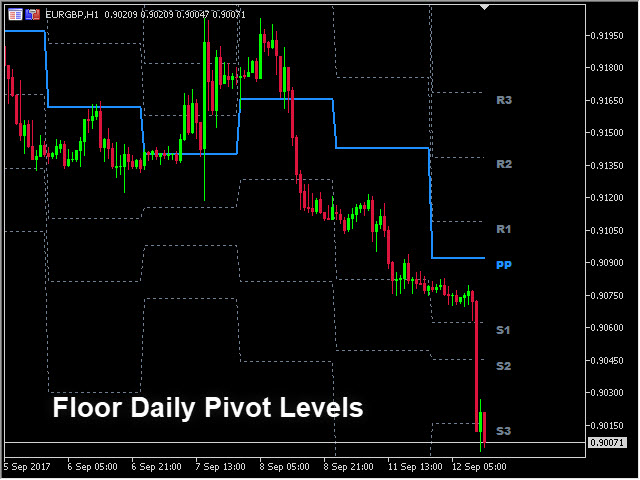
The Pivot Point indicator automatically calculates and displays the pivot point line and support and resistance levels. Pivot can be calculated according to the Classic, Floor, Fibonacci, Woodie, Camarilla or DeMark formula. It is also possible to select the period for calculating the indicator. A trader can choose from daily, weekly, monthly, or user-defined periods.
Types of pivots
- Classic
- Floor
- Fibonacci
- Woodie
- Camarilla
- DeMark
Main features
- The indicator shows the current and historical pivot point level
- Pivot support and resistance levels
- Alert notifications for indicator lines
- Custom session time
- Works on every timeframe (M1, M5, M15, M30, H1, H4, D1, W1, MN)
- The indicator is non-repainting
- Ready for backtesting
- Customizable parameters (Colors, Line thickness, Visibility...)
- High-speed calculation
- Available for MT4 and MT5


HI simple and accurate, easy to use it. WELL DONE. Thank you