JET Market Monitor B3 PRO
- Indicators
-
JETINVEST
 Roberto Junqueira, is Trader for over 20 years and has been developing indicators and trading experts for more than 10 years for the Forex, Cryptocurrencies and Stock Exchanges markets.
- Version: 1.0
- Activations: 5
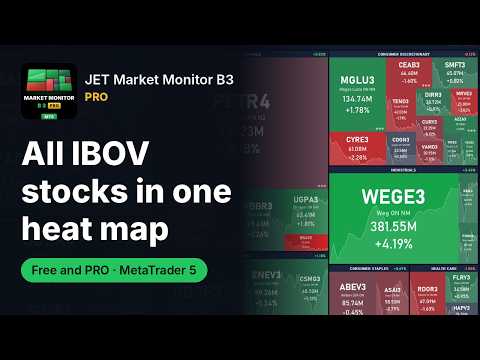
Brazilian stocks in a heat map or a list, right inside the MetaTrader 5 chart.
JET Market Monitor B3 PRO shows at a glance which stocks and sectors are up or down, and with what turnover. Every stock is a box: you choose what sets its size (turnover, daily, weekly, monthly or yearly change, or number of trades) and how to group them (by sector or by up and down). The color shows the change: green for up, red for down, gray for unchanged.
Start with the stocks of the IBOV portfolio or build your own lists.
It is a monitoring panel: it never opens, closes or changes orders.
Heat map
- Sort by (box size): Turnover, Daily change, Weekly change, Monthly change, Yearly change or Trades. With the period changes, the color and the percentage follow that period.
- Group by sector (11 sectors of the B3 sector classification, with the sector's change in the title bar) or by change: POSITIVE and NEGATIVE blocks, with the side that has more stocks on the left.
- Both choices combine: weekly change by sector, trades by change, and so on.
- Price line behind each box, over the period you choose: 1 day, 2 days, 1 week, 1 month, 3 months, 6 months, 1 year or This year.
- In each box: ticker, company name (e.g., "Petrobras PN N2"), traded value (or number of trades) and change. Smaller boxes show fewer lines, down to the ticker only.
List mode
- Every stock on screen, in columns: Symbol, Name, Sector, Last, Change (with a bar), Turnover (or Trades) and Weight (the stock's weight in the IBOV theoretical portfolio; 0 for symbols outside the IBOV).
- Click a header to sort; click again to reverse.
- Grouped by sector or by POSITIVE/NEGATIVE, as in the map.
- A− / A+ buttons adjust the font and row height.
Details box
Rest the mouse for 1 second over a box or row and see, live: ticker, day's change, full name, status (Real time, Pre-opening or Market closed), previous close, open, high and low.
Your own lists
- Up to 30 lists with up to 200 symbols each, beyond the IBOV.
- Editor inside the panel: create, rename and delete lists; search your broker's symbols by code or part of it.
- Lists are saved on the computer and are available on every chart and every MetaTrader 5 terminal on that machine.
More features
- Click a stock to open a new chart of it or switch the symbol of the current chart (choose the action and the timeframe in the inputs).
- Color scale: fixed, with an adjustable limit, or automatic, adapting to the current moves. Color legend at the bottom.
- Summary in the top bar: change of the IBOV portfolio, stocks up, down and unchanged, and the session status.
- Before the open, each stock shows how it closed the previous session and switches to the current day as soon as it trades for the first time.
- Optional price chart behind the panel, dark and light themes, interface in 11 languages, adjustable size and update interval.
- The choices of each chart (mode, sorting, grouping, price line period, list, theme) are remembered.
- X button: removes the panel and restores the chart's original settings.
Requirements
- MetaTrader 5 with a broker that offers B3 stocks (an account with the Brazilian stock symbols).
- On accounts without B3 stocks, the panel opens and shows "B3 symbols not found".
- Works on demo and real accounts.
Plans
Monthly rent or lifetime license. Rent it for 1 month to try it. Before that, test the demo in the Strategy Tester in visual mode; the panel does not receive clicks there, so choose the mode, sorting, grouping and price line period in the inputs.
Free version, with the heat map of the IBOV stocks by turnover and sector: JET Market Monitor B3 (https://www.mql5.com/en/market/product/207277).
Full manual: https://www.mql5.com/en/blogs/post/779774
Trading involves risk of loss. JET Market Monitor B3 PRO shows the current state of the stocks; it does not predict prices and does not guarantee results. Past behaviour does not guarantee future results.