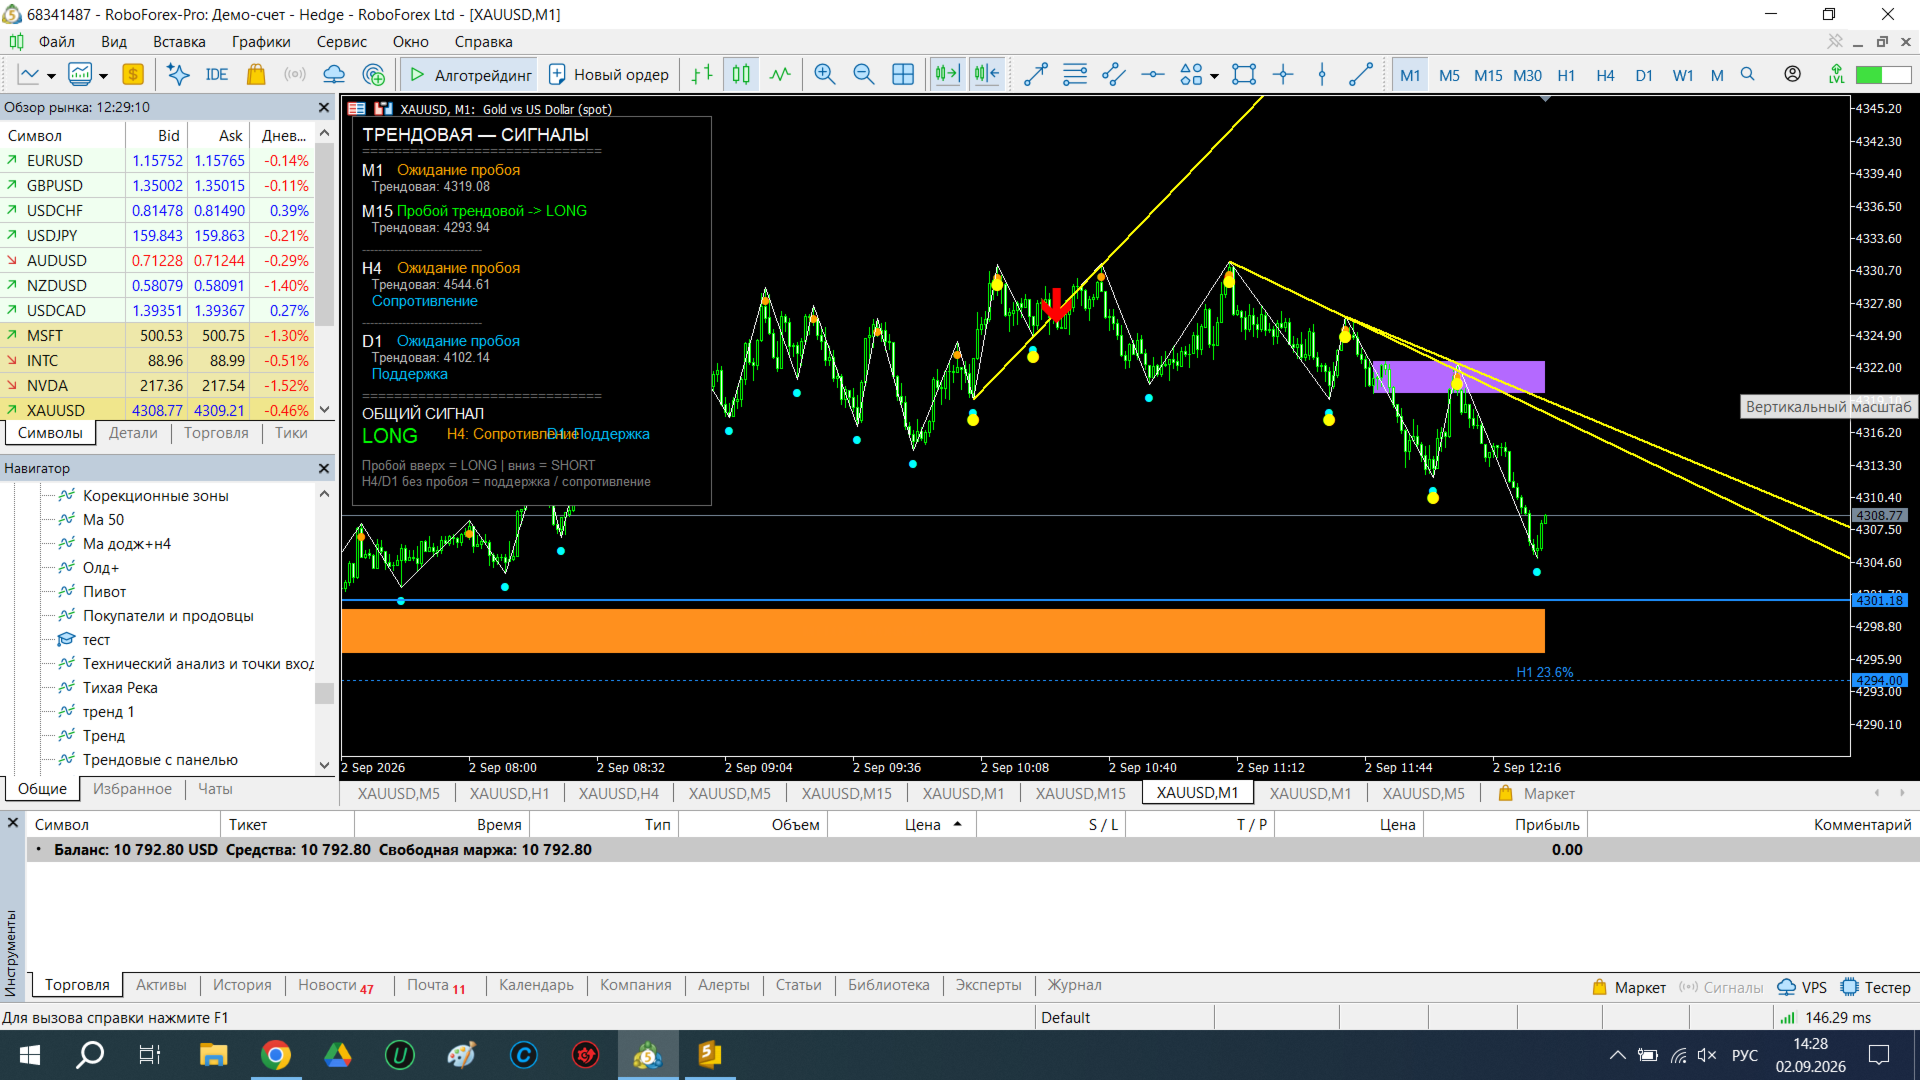
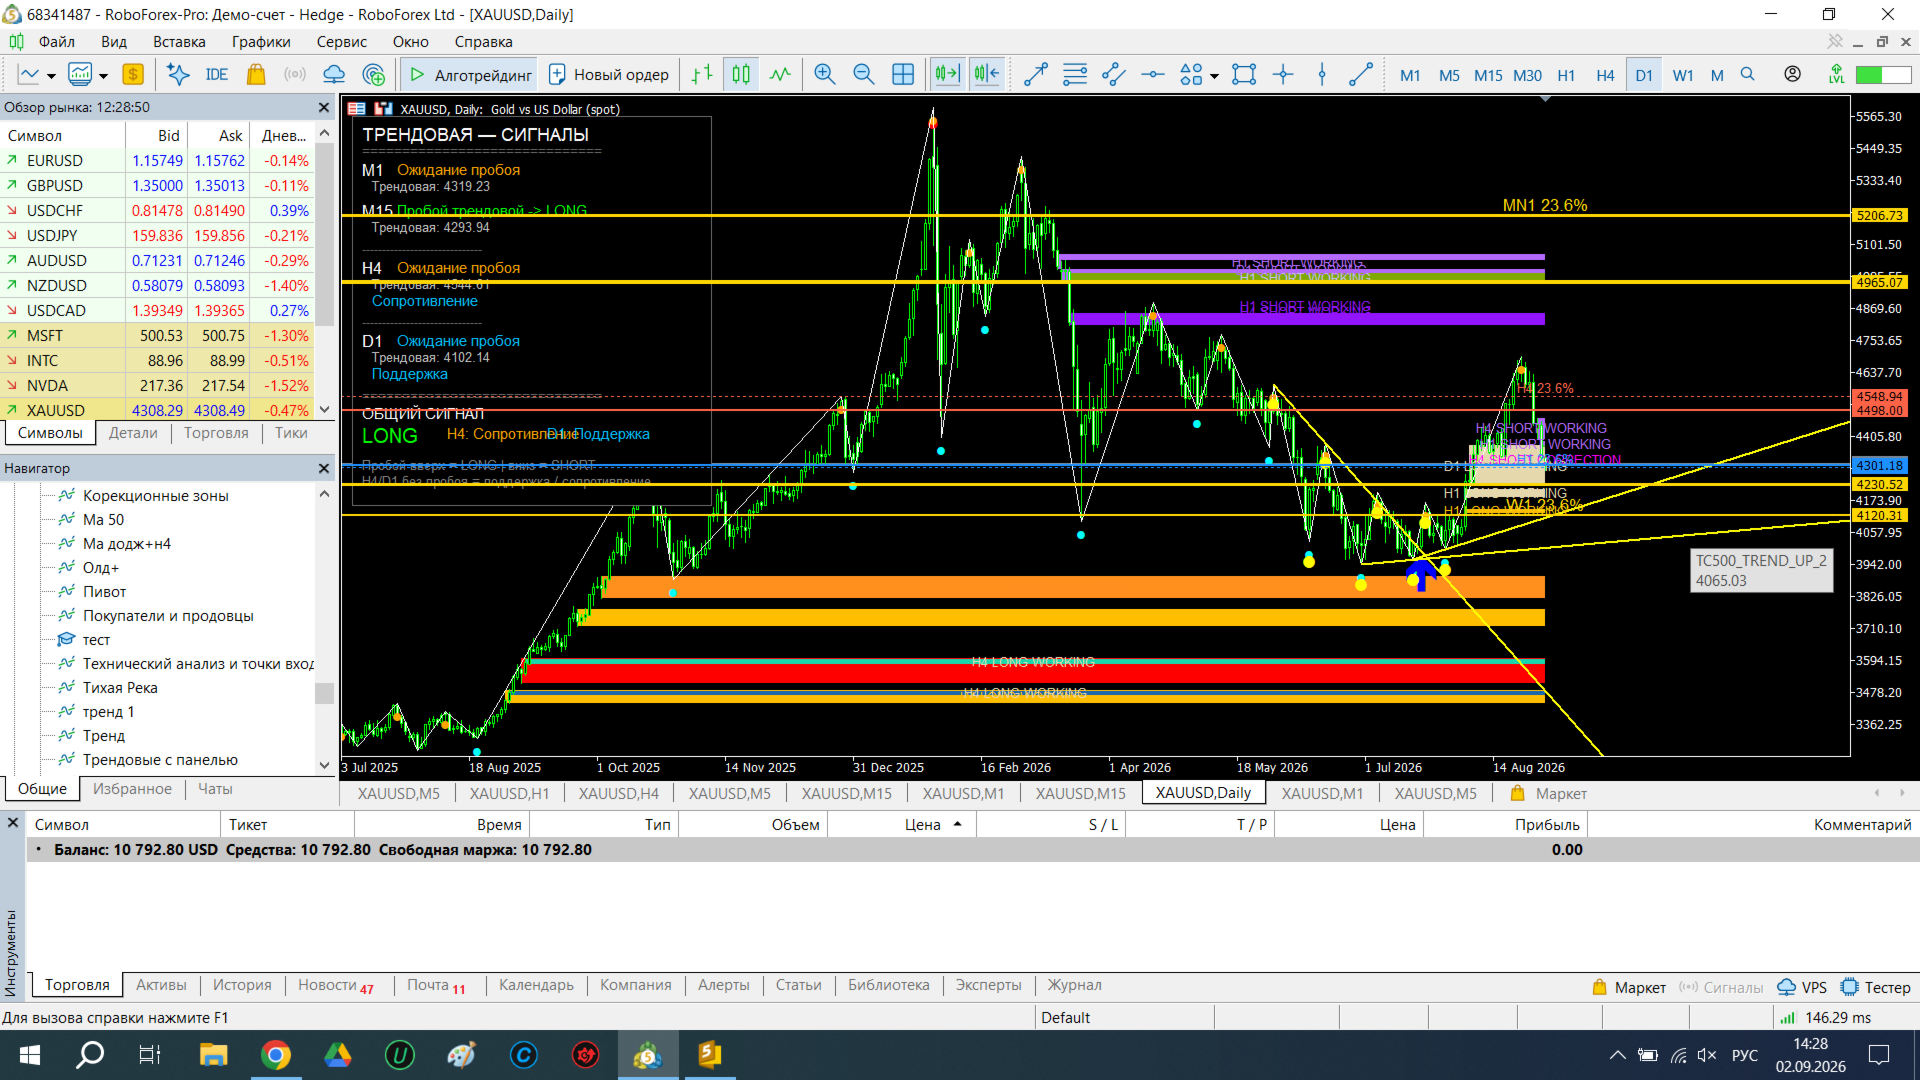
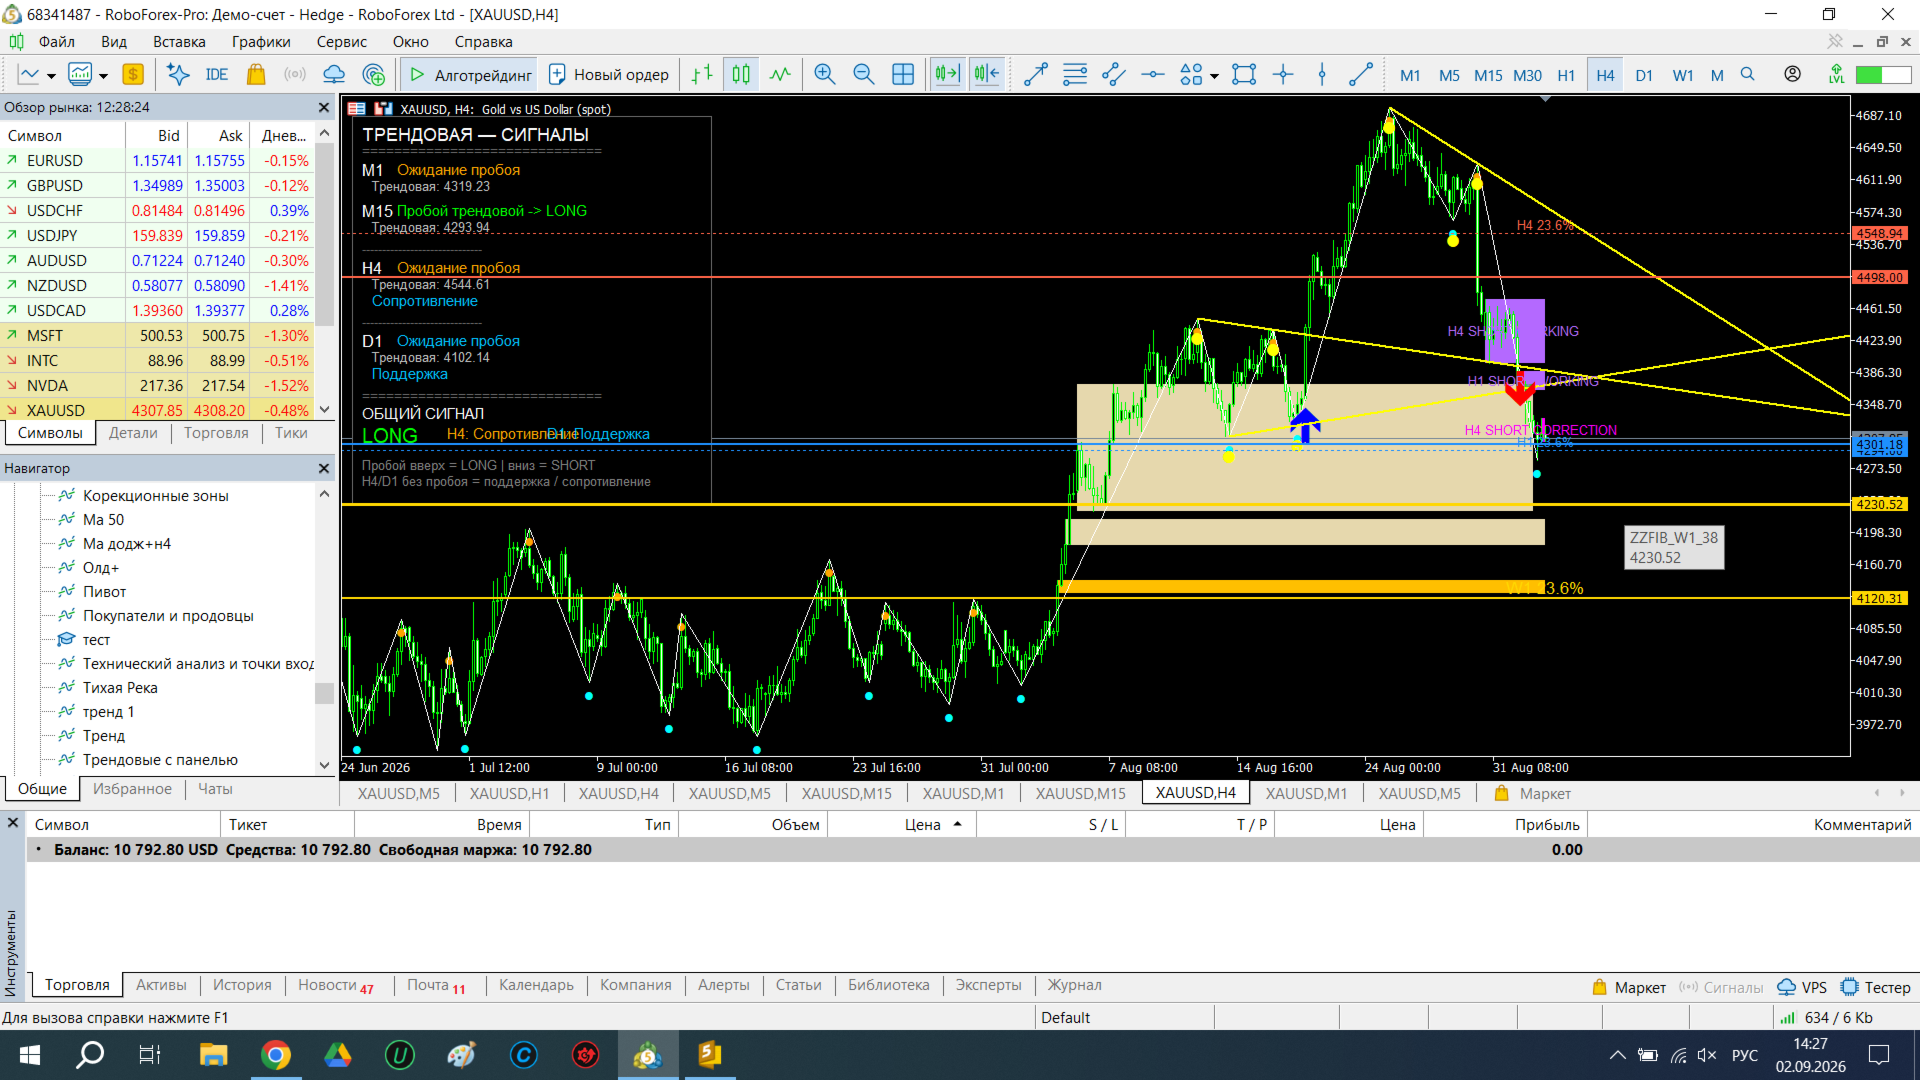
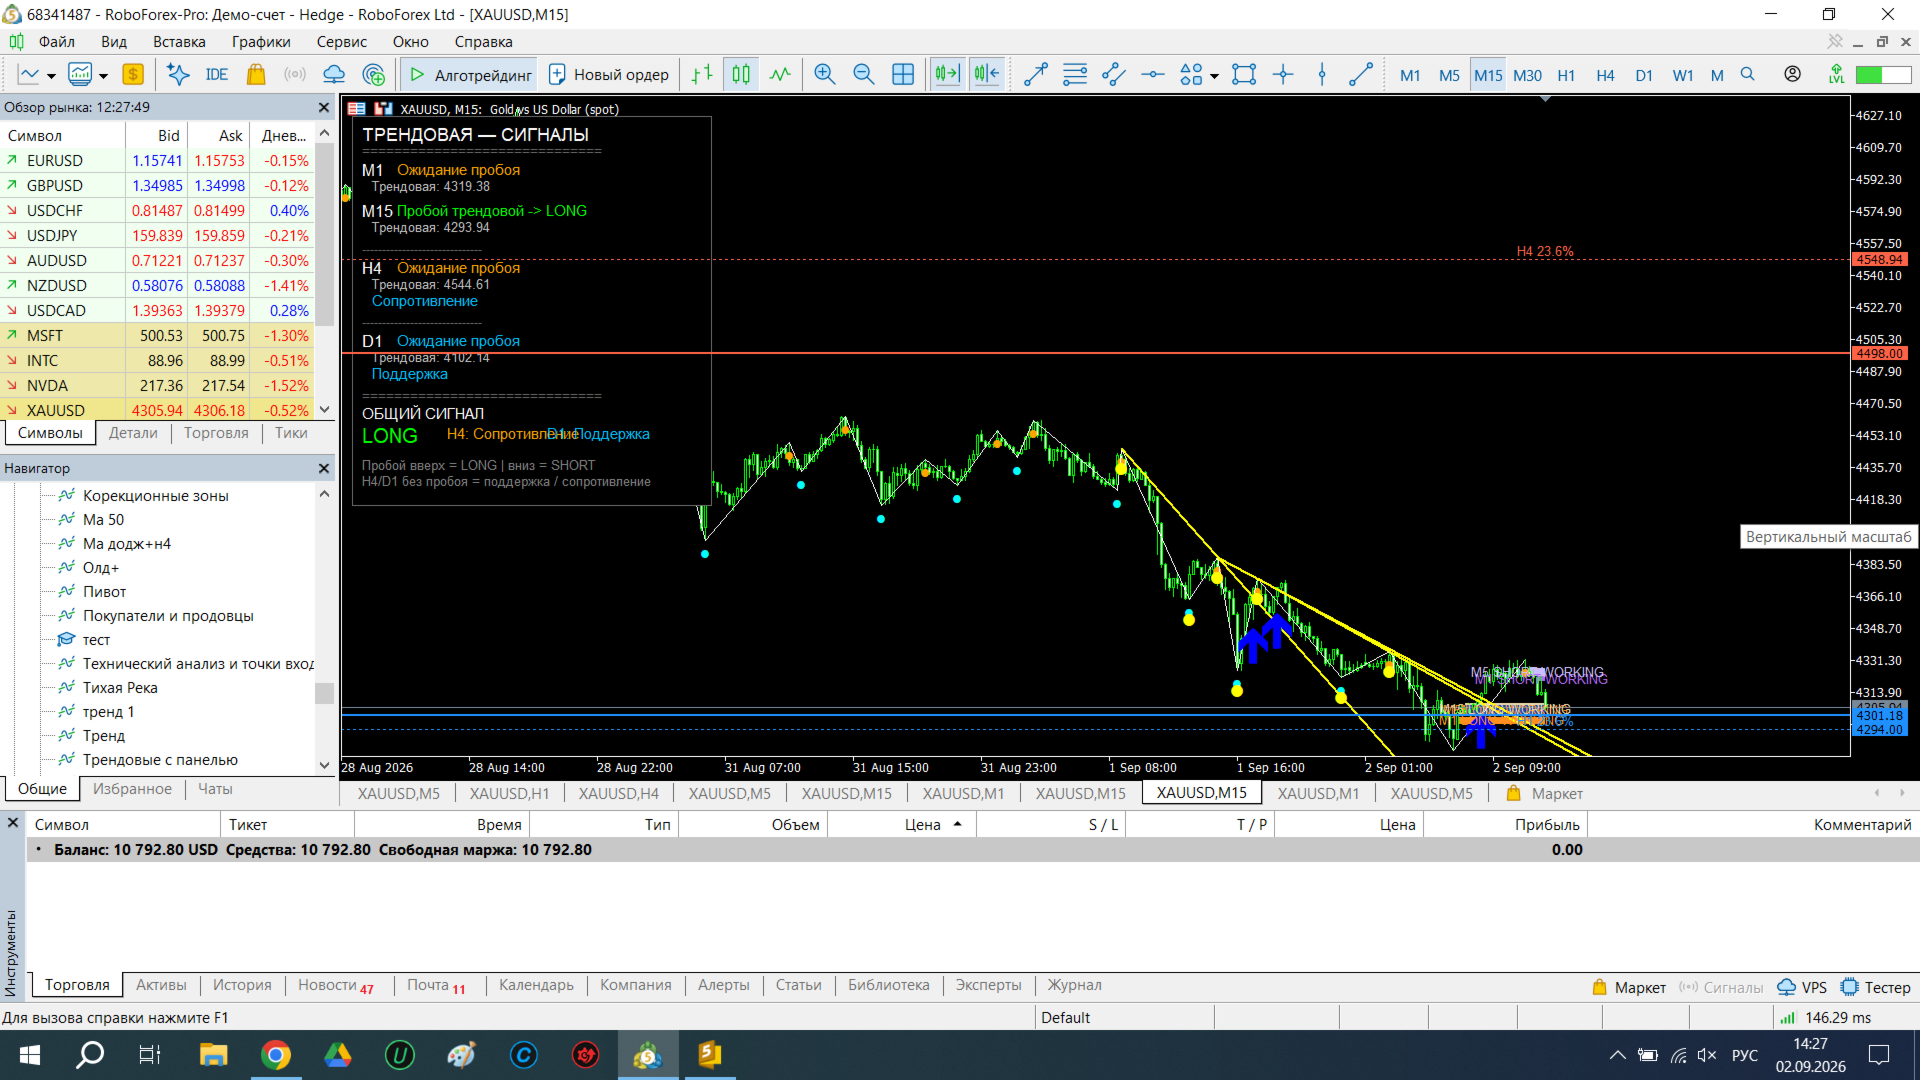
Technical analysis and entry points
- Indicators
- Version: 1.0
- Activations: 5

is a versatile analytical tool designed for both advanced traders and beginners. It combines classic trend line analysis with automatic Fibonacci level plotting to deliver precise market entries and structural clarity.
Built as an intuitive and clean on-screen dashboard, this indicator simplifies multi-timeframe analysis without cluttering your main workspace.
📊 Technical Analysis and Entry Points
The indicator automates the most critical aspects of price action and structural trading:
- Trend Line Analysis: The core algorithm scans price movements in real time to identify the dominant market direction, printing clear visual entry markers on the chart.
- Key Fibonacci Levels (38.2% and 23.6%): These high-probability zones are plotted automatically. Traders can utilize these levels both as precise entry points on pullbacks and as major take-profit targets.
- Intermediate Zones: Additional calculated support and resistance lines act as accumulation zones. They provide reliable opportunities for scaling into existing positions along the trend or catching early reversal impulses.
🖥 Multi-Timeframe Dashboard (Real-Time Navigation)
To maximize accuracy and eliminate constant chart-switching, the built-in graphical panel displays technical analysis across four key timeframes simultaneously :
- Daily (D1): Displays the long-term market structure and the major global trend.
- 4-Hour (H4): Serves as daily navigation, helping you align with the intraday momentum.
- Lower Timeframes: Used exclusively to find high-precision entry points in the direction of the higher-period trends.
💡 Core Features
- Automated Workflow: No manual drawing required — the indicator dynamically updates trends and Fibonacci grids.
- Cleaner Charts: Complex mathematical data is embedded directly into the panel, keeping the workspace clear.
- Multi-Asset Compatibility: Works efficiently on Forex pairs, Cryptocurrencies, Indices, and Commodities.