Navigator Equilibrium
- Indicators
-
Carlos Dante Diaz
 Hi, I'm Carlos Díaz, a programmer and algorithmic trader from Argentina with more than 10 years of experience as a trader. I design, code and test all my Expert Advisors in MQL5, using MetaEditor and the MetaTrader 5 Strategy Tester.
 - Version: 1.0
- Activations: 10
Navigator Equilibrium: market phase, momentum, peaks and divergences in a single window
Stop switching between a momentum oscillator, a trend filter, a volatility gauge and a divergence scanner. Navigator Equilibrium puts them together in one color-coded window, so you can see at a glance whether momentum is building or fading, who is in control, whether the market is trending or consolidating, and where price and momentum disagree.
It is built for discretionary traders who want a clear read of the market, and for EA developers who need clean, documented buffers.
What sets it apart
- A five-state histogram, not just up or down. Besides direction, the colors show whether momentum is gaining strength, losing strength, or stretched into a peak condition.
- A zero line that works as a market-condition gauge. It changes color to tell you whether the market is trending or consolidating.
- "Who is in control" at a glance. A cap on top of the histogram bars changes color against a slow average, and it also flags when counter-trend setups can be considered.
- Peak tracking. Every histogram peak is compared with the previous one on the same side, so you can see whether momentum is expanding or shrinking.
- Four divergence types detected automatically: regular and hidden, bullish and bearish. They are drawn as arrows with optional text, and the text keeps a fixed pixel gap to the arrow when you scroll or zoom.
- Switchable calculation modes for the histogram, the consolidation detection and the peak detection, so you can adapt it to your instrument.
- Full set of buffers for EAs, with every state, peak and divergence exposed as a readable value.
- Price data only. It needs no volume, and works on any symbol and timeframe.
- Fully customizable: colors, widths, line types, label size and what is drawn.
What you see on the chart
1. Momentum histogram (five colors)
| Color | Meaning |
|---|---|
| Bright green | Histogram above zero and rising: bullish momentum is building |
| Dark green | Histogram above zero and falling: bullish momentum is fading |
| Bright red | Histogram below zero and falling: bearish momentum is building |
| Dark red | Histogram below zero and rising: bearish momentum is fading |
| Magenta | Peak condition: the move is stretched and may be hard to sustain |
2. Zero line
- Cyan: the market is trending (unbalanced).
- Yellow: the market is consolidating (balanced).
3. Histogram cap (line or dots) and slow average
- The blue line is a slow average of the histogram.
- The cap on top of the bars is green when the histogram is above its average (buyers in control) and red when it is below (sellers in control).
- When the cap color is the opposite of the bar color, for example a green bar with a red cap, counter-trend setups can start to be considered. While it is not, the odds of trading against the current move are lower.
4. Peak dots
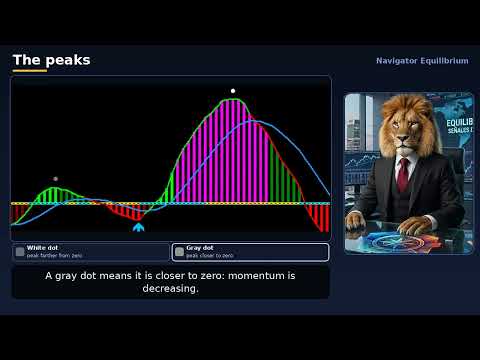
- White dot: the peak is farther from zero than the previous peak on the same side, so momentum is increasing.
- Gray dot: the peak is closer to zero, so momentum is decreasing.
5. Divergence arrows with optional text
- Each divergence type has its own color and arrow shape.
- The text can be placed above, below or outward from the arrow, in a short or a long version.
How peaks and divergences are defined
- A histogram peak is a bar whose value is the extreme among the bars on each side (3 by default), with the same sign, and larger than a minimum fraction of the recent average of |histogram|, which filters out small peaks.
- Each peak is compared with the previous peak on the same side, searched up to 100 bars back by default.
- The price extreme is the highest high (positive peaks) or the lowest low (negative peaks) around the peak.
The four divergence rules
| Type | Peaks | Price | Histogram | Reading |
|---|---|---|---|---|
| Regular bearish | positive | higher high | lower peak | possible reversal down |
| Hidden bearish | positive | lower high | higher peak | possible bearish continuation |
| Regular bullish | negative | lower low | shallower peak | possible reversal up |
| Hidden bullish | negative | higher low | deeper peak | possible bullish continuation |
Regular and hidden detection can be turned on or off independently.
Ways to use it
- Momentum phase. Bright colors show a move gaining strength; dark colors show it fading. Magenta marks stretched conditions, which can help with tightening stops or planning exits.
- Trend or range filter. Use the zero line to adapt your approach: cyan for trending conditions, yellow for consolidating ones.
- Control and counter-trend filter. Use the cap color to see who is in control, and to avoid or allow counter-trend setups.
- Momentum expansion or contraction. Peaks moving away from zero point to an expanding move, and peaks moving closer point to a weakening one.
- Reversal and continuation analysis. Use regular divergences to look for exhaustion and hidden divergences to look for continuation after pullbacks.
- Combine with structure. It pairs naturally with balance zones and volume profile tools, such as my Equilibrium Boxes and Volume Profile Multiple indicators: the first shows where the market is balanced, this one shows what momentum is doing there.
- Automation. Build rules in an EA with the buffers listed below.
Built for EA developers
Read the buffers with iCustom and CopyBuffer . Use shift 1 (the last closed bar) for decisions.
| Buffer | Content |
|---|---|
| 0 | Momentum histogram |
| 6 | Slow average of the histogram |
| 7 | State: +1 bullish, +2 bullish slowing, -1 bearish, -2 bearish slowing |
| 8 | Peak condition (magenta): +1 bullish, -1 bearish, 0 none |
| 9 | Consolidation: 1 consolidating, 0 trending |
| 10 | Control: +1 buyers (histogram above its average), -1 sellers |
| 11 | Counter-trend: +1 a long can be considered, -1 a short, 0 none |
| 12 | Histogram peak confirmed on this bar: +1 positive, -1 negative, 0 none |
| 13 | That peak vs the previous one on the same side: +1 away from zero, -1 closer, 0 no reference |
| 14 | State of positive peaks (+1 moving away, -1 moving closer), kept until the next peak |
| 15 | Same as 14, for negative peaks |
| 16 | Divergence: +1 regular bullish, +2 hidden bullish, -1 regular bearish, -2 hidden bearish, 0 none |
Examples of conditions you can build: allow long entries only when State is bullish and Consolidation is 0; react when Divergence is not 0; tighten management when Peak condition appears or State turns to "slowing".
Settings
Main parameters
- Length (25): bars used to calculate the histogram.
- Slow smoothing (13): period of the slow average.
- Consolidation length (10) and Consolidation standard deviation (2.0): used to detect consolidation.
Calculation modes
- Histogram calculation: linear regression of the deviation, or simple deviation of price from its mid line.
- Consolidation calculation: Bollinger bands inside the Keltner channel, or Bollinger band width below its average.
- Peak detection (magenta bars): histogram far above its average, or price makes a new extreme but the histogram does not.
- Histogram cap: line or dots.
Fine-tuning
- Optional division of the histogram by the ATR, so it is comparable across symbols.
- ATR period (14), Keltner multiplier (1.5), band width window (50) and factor (0.85), peak window (50) and multiplier (2.0).
Lines and widths
- Width of the histogram bars, the zero line, the cap and the average, and the line type of the cap and the average.
Colors
- Every histogram state, both zero line colors, the cap, the average, the peak dots and each divergence type.
Peaks and divergences
- Bars on each side to confirm a peak (3), how far back to look for the previous peak (100) and the minimum peak size (0.5).
- Detect regular or hidden divergences, and show or hide peak dots and arrows.
- Divergence text: none, above, below or outward; short or long version; font size; and extra distance to the arrow in pixels.
- How many bars back to draw marks (500) and mark size.
- A unique ID per instance, to use several copies on the same chart.
Good to know
- Peaks and divergences are confirmed a few bars after they happen (3 by default). Arrows and dots are drawn on the peak bar itself, so they appear after the confirmation. The buffers show the value on the confirmation bar.
- The histogram of the forming bar can change until the bar closes, as with any oscillator.
- The default settings are a starting point. Adjust the parameters to the instrument and timeframe you trade.
Disclaimer
Navigator Equilibrium is an analysis tool. It does not generate trade signals by itself and does not guarantee any result. Trading involves risk. Test it on a demo account and in the Strategy Tester before using it with real funds.