Radar Trade Analytic
- Indicators
- Version: 2.0
- Updated: 6 August 2026
- Activations: 10

📊 Radar Trade Analytic 2.0 – Quantitative Panel for MT5
🧠 What is Radar Trade Analytic?
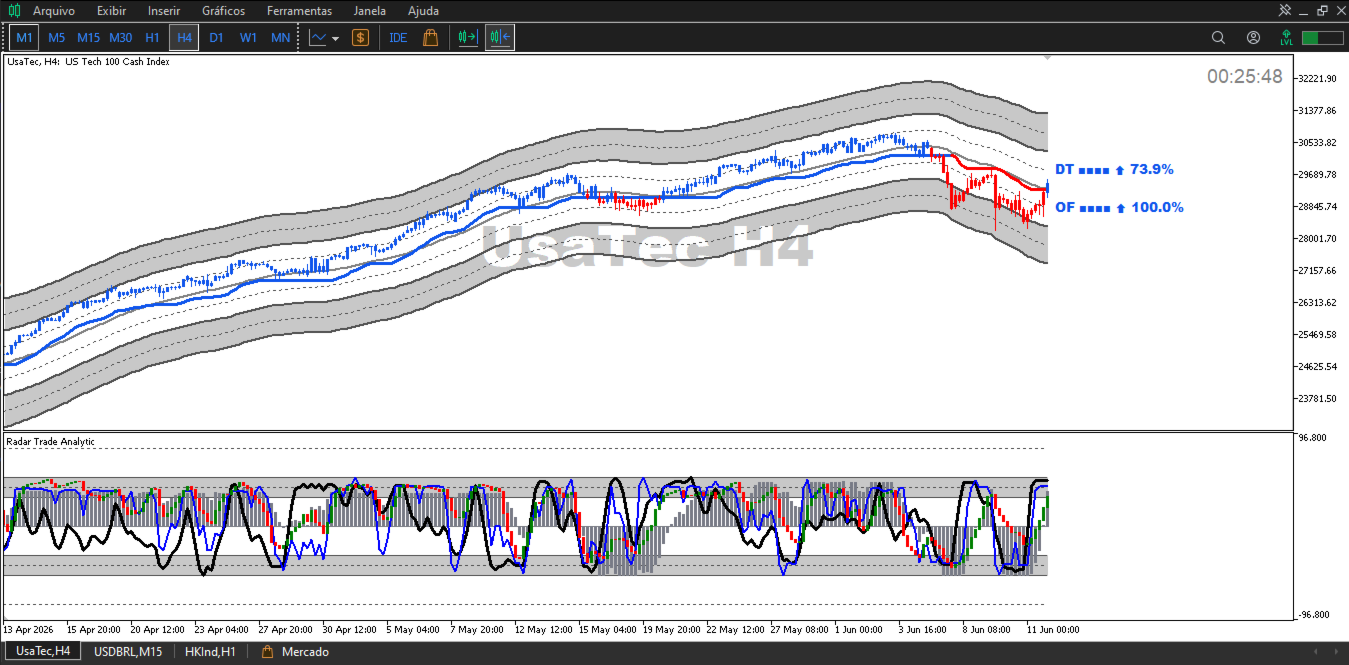
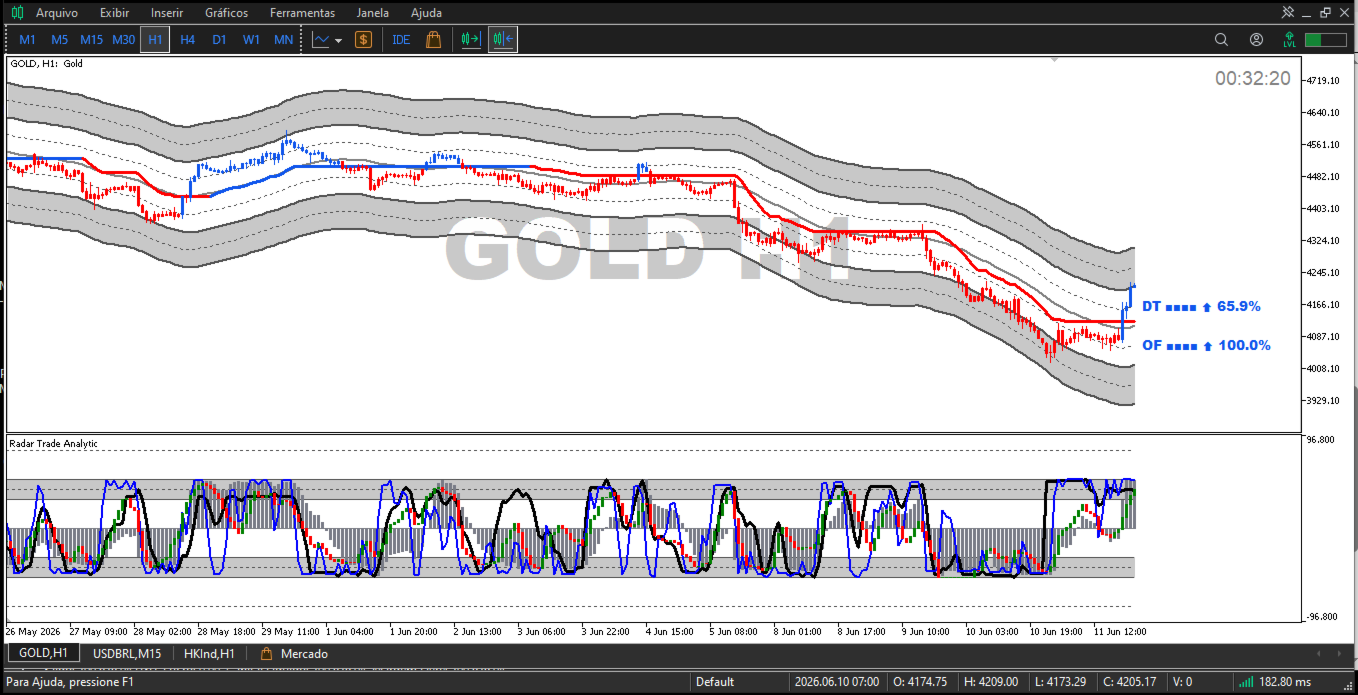
Radar Trade Analytic is the quantitative module of the Radar Trade Ecosystem. It opens in a separate window below the main chart and displays four synchronized layers, all built with the same proprietary Sigma engine, ensuring a direct correspondence between what you see on the chart and what you read in the panel.
No buy or sell signals. No targets. No alerts. Radar Trade Analytic organizes the data that truly matters so you can decide with clarity.
🆕 What changed in version 2.0?
| # | Improvement | Previous Version (1.00) | Version 2.0 |
| 1 | Delta Flow (CVD) | Calculated using only M1 candles (lower timeframe estimation) | Real aggression delta via ticks with TICK_FLAG_BUY/SELL flags, the exact same data used by professional platforms |
| 2 | Automatic Fallback | If M1 was unavailable, it used candle direction (geometric estimation) | If ticks are unavailable, it attempts M1 candles; if that fails, it falls back to the candle itself. Three fallback levels |
| 3 | Control Parameter | No option available | New UsarDeltaReal input (default true) lets you toggle between real delta and traditional methods |
| 4 | Daily Accumulation | Reset only at midnight | Keeps daily reset, but now intra-bar delta is real (tick-by-tick) |
🚀 How it Works
The indicator uses a proprietary smoothing engine (Sigma) that automatically adapts to the volatility of any asset and timeframe. No manual adjustment of periods or parameters is required.
Panel Layers:
| Layer | Type | Description |
| Sigma | Volatility | Volatility speed histogram. Columns moving away from zero = increasing intensity. Columns contracting = loss of intensity and potential transition. |
| Delta Flow (CVD) | Order Flow | Line representing the real executed order balance (now based on real aggression ticks). Rising and positive = active buying flow. Falling and negative = active selling flow. Built with tick-by-tick precision on the current bar. |
| Volume Index | Validation | On-balance volume processed by the same Sigma engine. When aligned with Sigma and Delta, volume validates the move. When moving in opposite directions, use caution regarding sustainability. |
| Momentum HiLo | Acceleration | Overbought/oversold oscillator based on candlestick highs and lows. Green = increasing acceleration (rising momentum). Red = decreasing acceleration (falling momentum). |
✅ Key Advantages & Differentiators
| Differentiator | Description |
| No Repainting | All signals are calculated in real-time and never change retroactively. |
| Automatic Adaptation | Works on any asset and timeframe without manual adjustments. |
| Zero Configuration | Requires no period adjustments. Simply drag and drop onto the chart. |
| Real Aggression Delta | The Delta Flow line now utilizes real ticks with aggression flags — the most granular data available in MT5. No longer a geometric or M1-only estimate. |
| 3-Level Fallback | 1) Real ticks → 2) M1 candles → 3) Individual candle. The indicator always finds a way to compute delta. |
| Unified Sigma Engine | Compatible with the Radar Trade Graphic module — when used together, there is zero lag discrepancy. Both now share the same real delta base. |
| Dark and Light Themes | Choose the theme that best suits your style. |
| Educational by Nature | Designed to help you evolve your quantitative market reading skills. |
🎓 Who is this indicator for?
- Day traders and swing traders trading Indices, Forex, Gold, Bitcoin, and Stocks.
- Professionals looking to measure volatility speed, order flow, and acceleration.
- Quantitative traders seeking to validate price action with volume.
- Anyone tired of cluttered, subjective indicators.
⚙️ Input Parameters
| Parameter | Type | Default | Description |
| Theme | Enum | Light | Dark or Light |
| MostrarSigma | bool | true | Displays the Sigma histogram |
| SigmaColorir | bool | false | true = color positive/negative; false = neutral |
| CorPositiva | color | clrBlue | Color for positive columns |
| CorNegativa | color | clrPurple | Color for negative columns |
| CorNeutra | color | C'120,123,134' | Default column color |
| MostrarDelta | bool | true | Displays the Delta (CVD) line |
| CorDelta | color | clrBlack | Color for the Delta line |
| UsarDeltaReal | bool | true | 🆕 Enables real tick aggression delta |
| MostrarVolumeIndex | bool | true | Displays the Volume Index line |
| CorVolumeIndex | color | clrBlue | Color for the Volume Index line |
| MostrarMomentum | bool | true | Displays Momentum candles |
| CorMomentumAlta | color | clrGreen | Color for increasing acceleration candles |
| CorMomentumBaixa | color | clrRed | Color for decreasing acceleration candles |
📈 Scenario Analysis Examples
🟢 Strong Bullish Scenario
- Sigma: positive columns expanding away from zero
- Delta Flow: rising and positive (based on real buy ticks)
- Volume Index: tracking along with Sigma and Delta
- Momentum: consecutive green candles
🔴 Strong Bearish Scenario
- Sigma: negative columns expanding away from zero
- Delta Flow: declining and negative (based on real sell ticks)
- Volume Index: tracking along with Sigma and Delta
- Momentum: consecutive red candles
🟡 Consolidation Scenario
- Sigma: columns contracting close to zero
- Delta Flow: hovering near the zero line, lacking direction
- Volume Index: misaligned or flat
- Momentum: candles alternating colors
The indicator displays market conditions, not buy/sell signals. The final decision is always yours.
🧭 Complement with Radar Trade Graphic
👉 To visualize market structure on the main chart, use the Radar Trade Graphic 2.0 module (sold separately). It adds:
- Dynamic central moving average
- Fast and slow color-coded lines
- Volatility clouds (support/resistance)
- Auxiliary lines
- Dynamic candlestick coloring
- Delta (DT) and Order Flow (OF) panels with real tick aggression and DOM
Both indicators share the same Sigma engine and real delta foundation, guaranteeing full synchronization between what you see on the main chart and the quantitative panel.
📌 Technical Information
| Item | Description |
| Version | 2.0 |
| Compatibility | MetaTrader 5 (separate sub-window) |
| Recommended Assets | Indices, Forex, Gold, Bitcoin, Stocks |
| Timeframes | Any timeframe (recommended: M5, M15, H1, H4) |
| No Repainting | ✅ Yes |
| Real Delta | ✅ Yes (via ticks) |
| Automatic Fallback | ✅ Yes (3 levels) |
| Themes | Dark / Light |
💬 Educational Note
Radar Trade Analytic 2.0 was engineered as a practical learning platform.
Every layer — Sigma, Delta Flow, Volume Index, Momentum — exists to build your quantitative intuition: understand volatility speed, real order flow balance (now tick-by-tick), volume validation, and price acceleration — all free of market noise.
Treat it as your daily laboratory. Over time, you won't just trade better — you'll understand why the market moves.
That is the true evolution of a trader.