
Available on the MQL5 Market: JET Market Monitor B3 Free · JET Market Monitor B3 PRO
Video: https://youtu.be/mbOCqqgxn18
Version 1.00 · Panel for MetaTrader 5 · B3 stocks
JET Market Monitor B3 is a monitoring panel. It never opens, closes or changes orders. Trading involves risk of loss; the panel shows the current state of the stocks, does not predict prices and does not guarantee results.
1. What it is
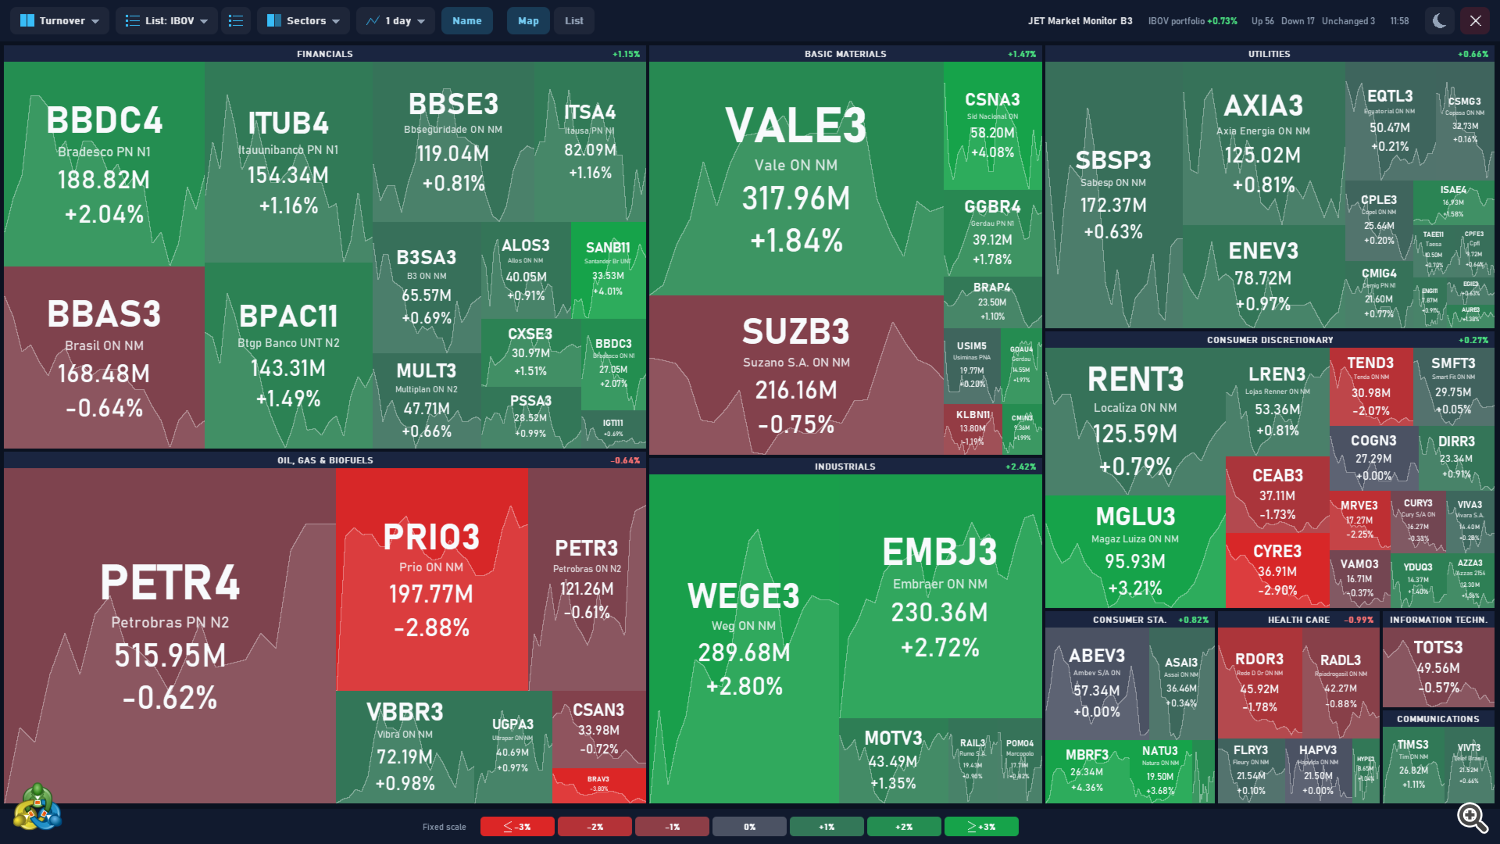
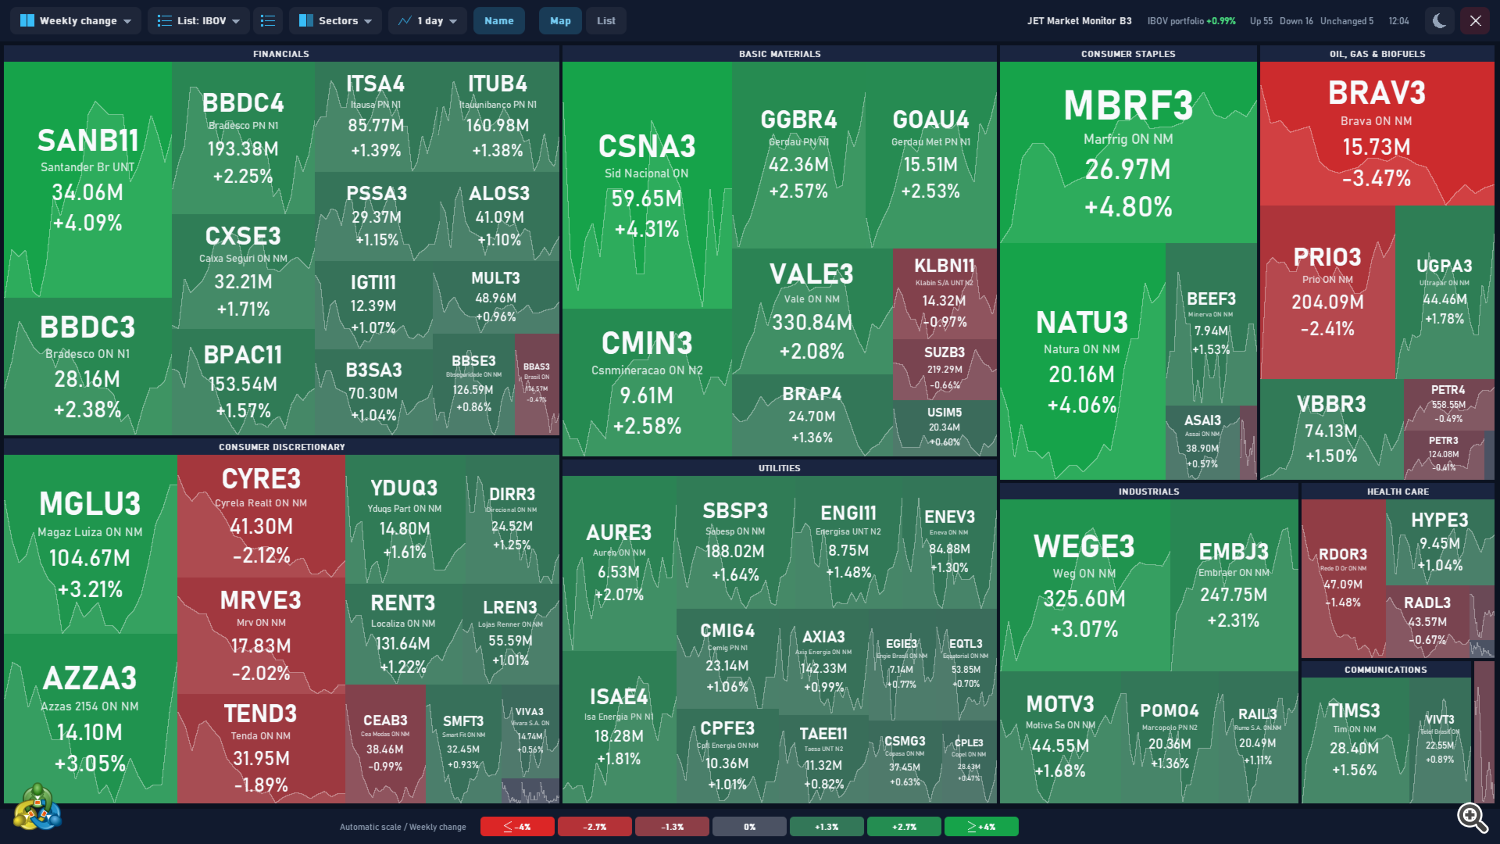
JET Market Monitor B3 shows Brazilian stocks in a heat map (or a list, in PRO) inside the MetaTrader 5 chart. Each stock is a box: its size follows the option chosen in Sort by and its color shows the change (green = up, red = down, gray = 0.00%).
There are two versions:
| Feature | Free | PRO |
|---|---|---|
| Stocks | Full IBOV portfolio | IBOV + your own lists |
| Sort by / Group | Locked to Turnover + Sectors | All options |
| Company name | ✓ | ✓ |
| Price line inside the boxes | — | ✓ |
| List mode (with sorting and A−/A+) | — | ✓ |
| Details box on hover | — | ✓ |
| Click opens the stock's chart | — | ✓ |
| Color scale | Fixed at 3% | Fixed (adjustable) or automatic |
| Themes, 11 languages, X button | ✓ | ✓ |
| Update | 2 s | Adjustable (from 200 ms) |
2. Requirements
- MetaTrader 5 with a broker that offers B3 stocks (an account with the Brazilian stock symbols).
- Demo or real account: the panel sends no orders, so it works the same on both.
- On accounts without B3 stocks, the panel opens and shows "B3 symbols not found".
- Strategy Tester: the panel is visual only. Use visual mode, with B3 symbols. In the tester, menus, the details box and the list editor do not work; the state comes from the inputs (section 7).
- Turnover: the value shown is the sum of the trades that the broker sends to MetaTrader 5. If the broker does not send all the trades of a symbol, the turnover shown may be lower than the B3 figure.
3. Installation
- Download the Free version, or rent (1 month) or buy the lifetime license of PRO in the Market, and install it from MetaTrader 5 itself (Market tab → Purchased).
- Open a chart of any B3 symbol (a stock, for example). The timeframe does not matter.
- In the Navigator, under Indicators → Market, drag JET Market Monitor B3 onto the chart.
- Click OK. The panel fills the chart area; the first time, it takes a few seconds to receive data for all the stocks.
Tip: keep the panel on a chart of its own. When you click a stock (PRO), it can open a new chart of it without taking the panel off the screen.
4. Reading the panel
4.1 Top bar

| Button | What it does |
|---|---|
| Sort by | Sets the box size: Turnover, Daily change, Weekly change, Monthly change, Yearly change or Trades. The button shows the current option |
| List: NAME | Chooses the list shown: IBOV or one of your lists (PRO). The icon next to it opens the list editor |
| Group | Group by sector or Group by change. The button shows "Sectors" or "Change" |
| Chart | Period of the price line inside the boxes: None, 1 day, 2 days, 1 week, 1 month, 3 months, 6 months, 1 year, This year (PRO) |
| Name | Turns the company name on and off in the boxes and the list |
| Map / List | Switches between heat map and list (PRO). In list mode, A− / A+ appear |
| Theme | Switches between dark and light |
| X | Removes the panel and restores the chart's original colors and settings |
Menus open under the button, with a mark on the current option; click outside to close. In the Free version, Sort by and Group are visible and locked to Turnover + Sectors.
Summary (on the same line, or on a second line if it does not fit): panel name, IBOV portfolio with its change (only with the IBOV list), Up, Down and Unchanged counts, and the session status (section 4.5).
The 1st button (sorting) and the grouping button have no fixed title: each one shows the current option.
4.2 Heat map
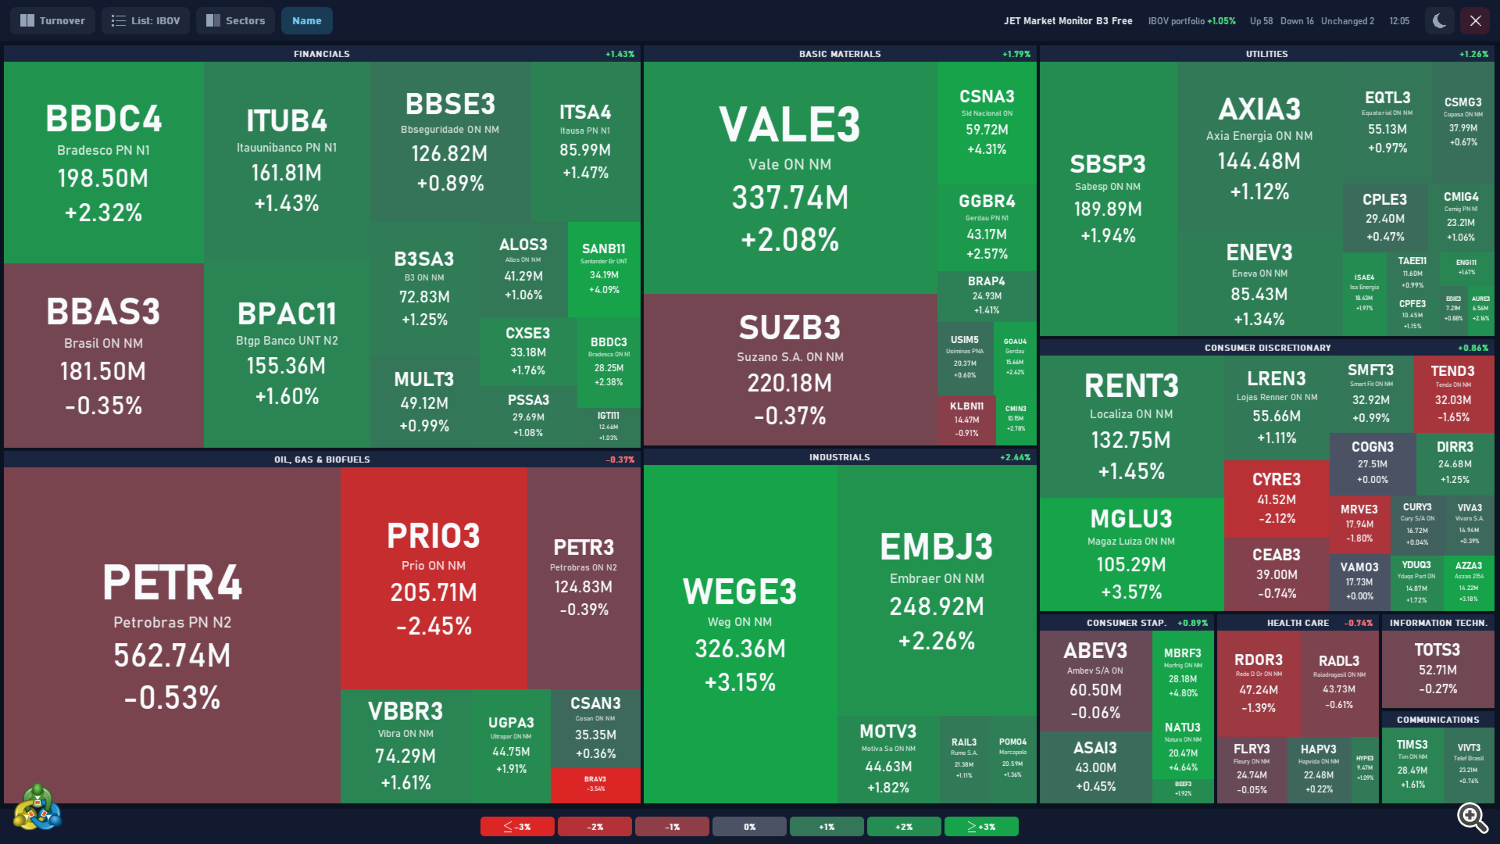
Box. From top to bottom: ticker; company name (if on and if it fits); traded value (or number of trades, with "Trades"); change. Smaller boxes show fewer lines, down to the ticker only.
Sort by:
| Option | Box size | Change shown and color |
|---|---|---|
| Turnover | Day's traded value | Day |
| Daily change | Size of the day's change (bigger gains and losses = bigger boxes) | Day |
| Weekly / monthly / yearly change | Size of the period's change | Period: week, month or year to date |
| Trades | Day's number of trades | Day |
Group:
- By sector: 11 sectors of the B3 sector classification (Financials; Oil, gas & biofuels; Basic materials; Utilities; Consumer staples; Consumer discretionary; Health care; Industrials; Communications; Information technology; Other). The title bar shows the sector name and, with daily change, the sector's change.
- By change: two blocks, POSITIVE (green bar) and NEGATIVE (red bar). The side with more stocks is on the left. Stocks at 0.00% are gray, in the NEGATIVE block.
Both choices combine: for example, Weekly change + Sectors, or Trades + Change.
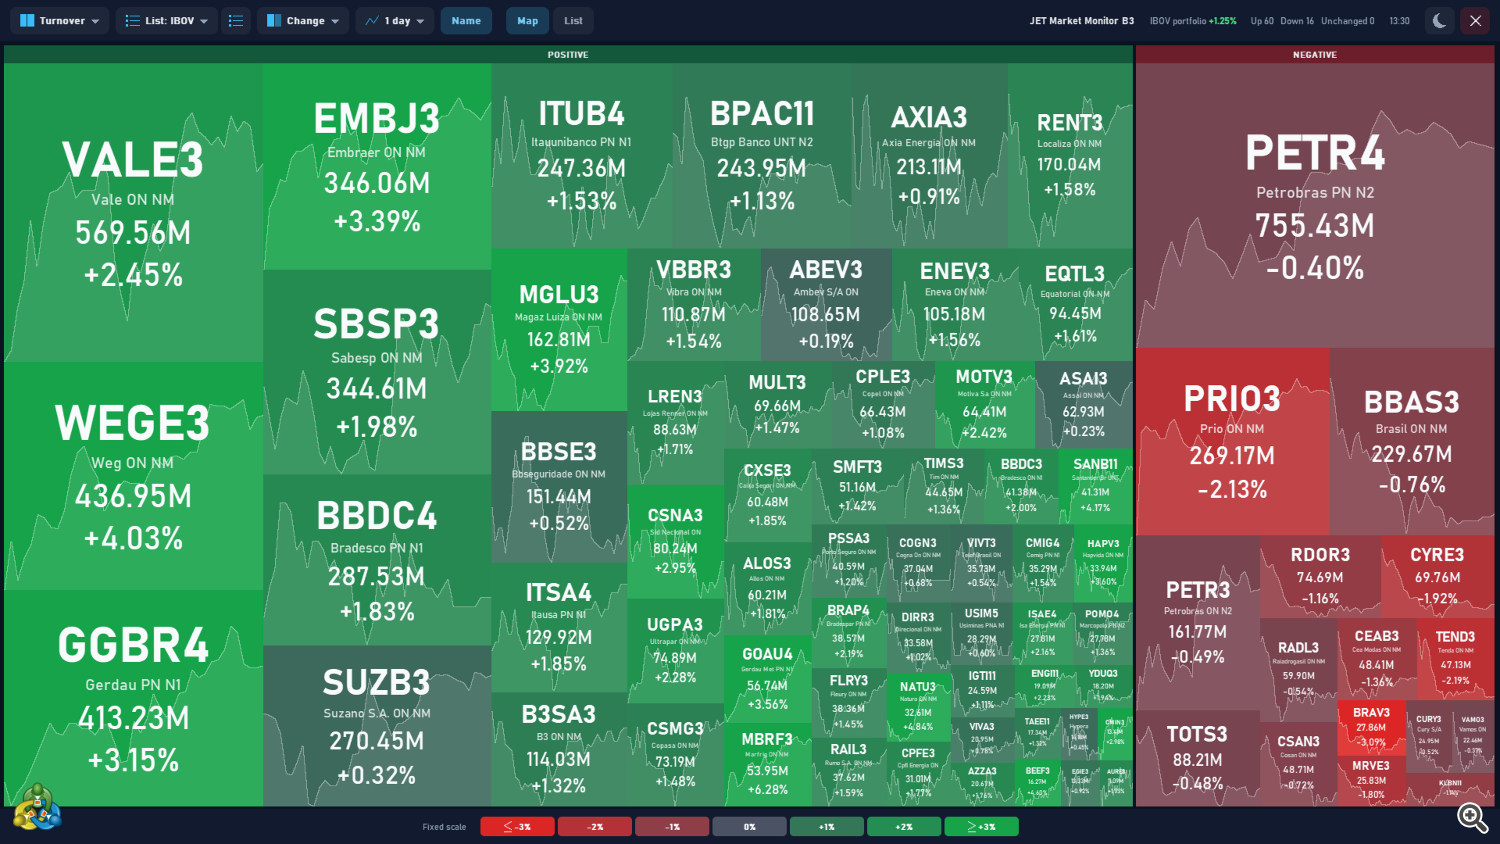
Price line (PRO). With a period chosen in Chart, each box shows in the background an area with the stock's price path over that period, in a lighter tone than the box. While a stock's history is still arriving from the broker, the box shows three small dots in the lower-right corner; the line appears by itself when the data arrives.

Colors and legend. Green for up, red for down and gray at 0.00%; the bigger the change, the stronger the color, up to the scale limit. The footer shows the legend in 7 blocks (with a 3% limit: ≤−3% · −2% · −1% · 0% · +1% · +2% · ≥+3%), the scale type ("Fixed scale" or "Automatic scale") and, with period changes, the period.
- Fixed scale: you set the limit (default 3% for the daily change). In Free, it is fixed at 3%.
- Automatic scale (PRO): the limit adapts by itself to the current moves, so calm days and busy days both have contrast.
4.3 List mode (PRO)
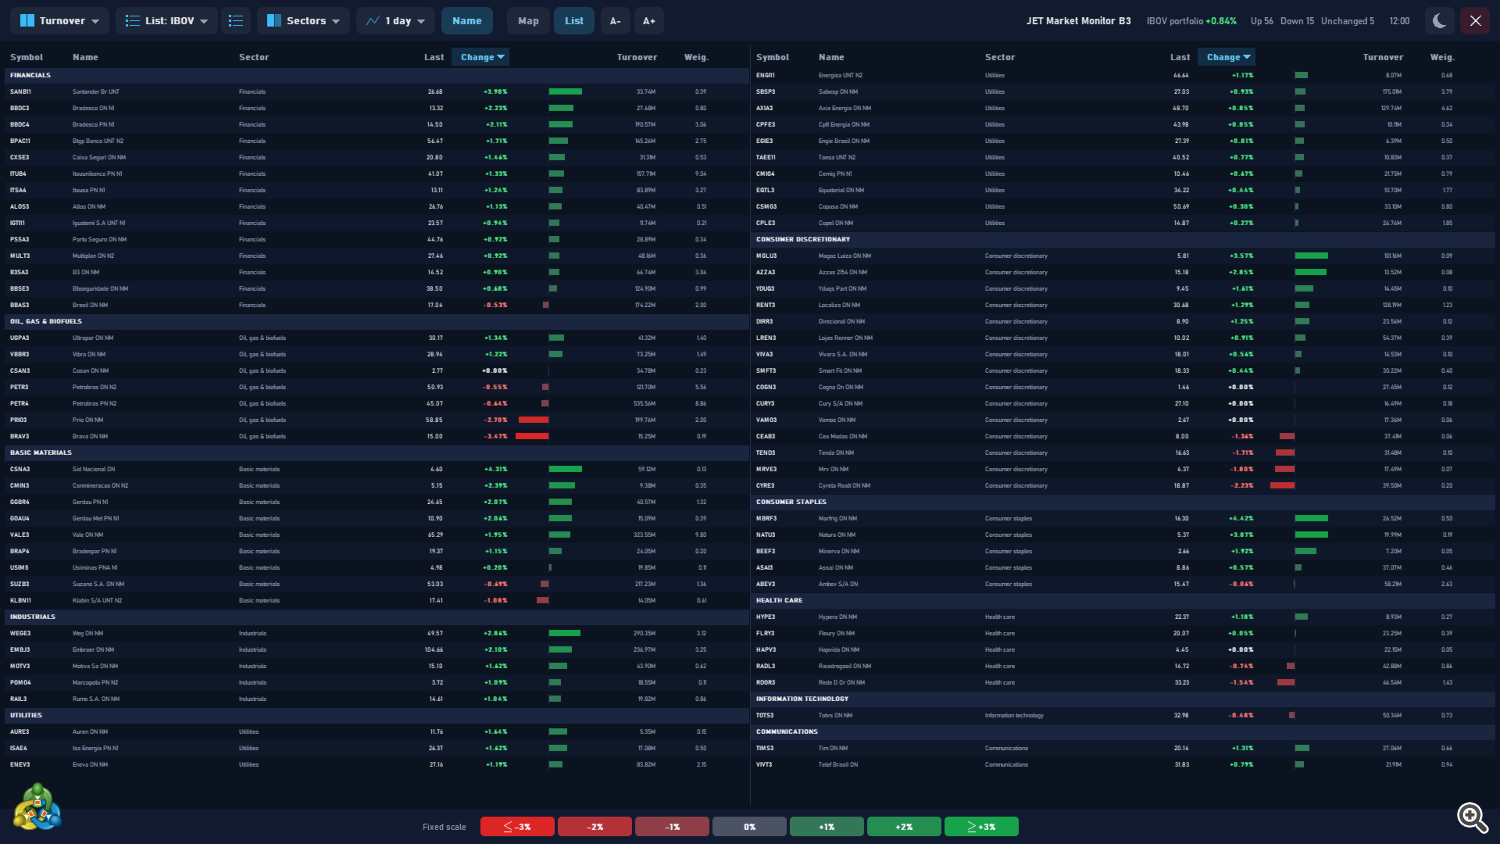
- Columns: Symbol, Name (if on), Sector, Last, Change (value and a bar above/below zero), Turnover (or Trades) and Weight (the stock's weight in the IBOV theoretical portfolio; 0 for symbols outside the IBOV).
- All stocks fit on screen: the panel uses as many stock columns as needed and, if necessary, reduces the row height. On narrow screens it shows the sort column first, then Last, Name, Turnover, Weight and Sector.
- Sort: click the header of Symbol, Name, Sector, Last, Change, Turnover or Weight. The 1st click sorts numbers from highest to lowest and text from A to Z; the 2nd click reverses. The active column is highlighted, with ▲ or ▼. Choosing an option in Sort by moves the sorting to the matching column (Turnover or Change), highest first.
- Grouping: with Sectors, each sector starts with a title row; with Change, POSITIVE and NEGATIVE. Sorting applies within each group.
- A− / A+: font and row height from 70% to 200%.
4.4 Details box (PRO)
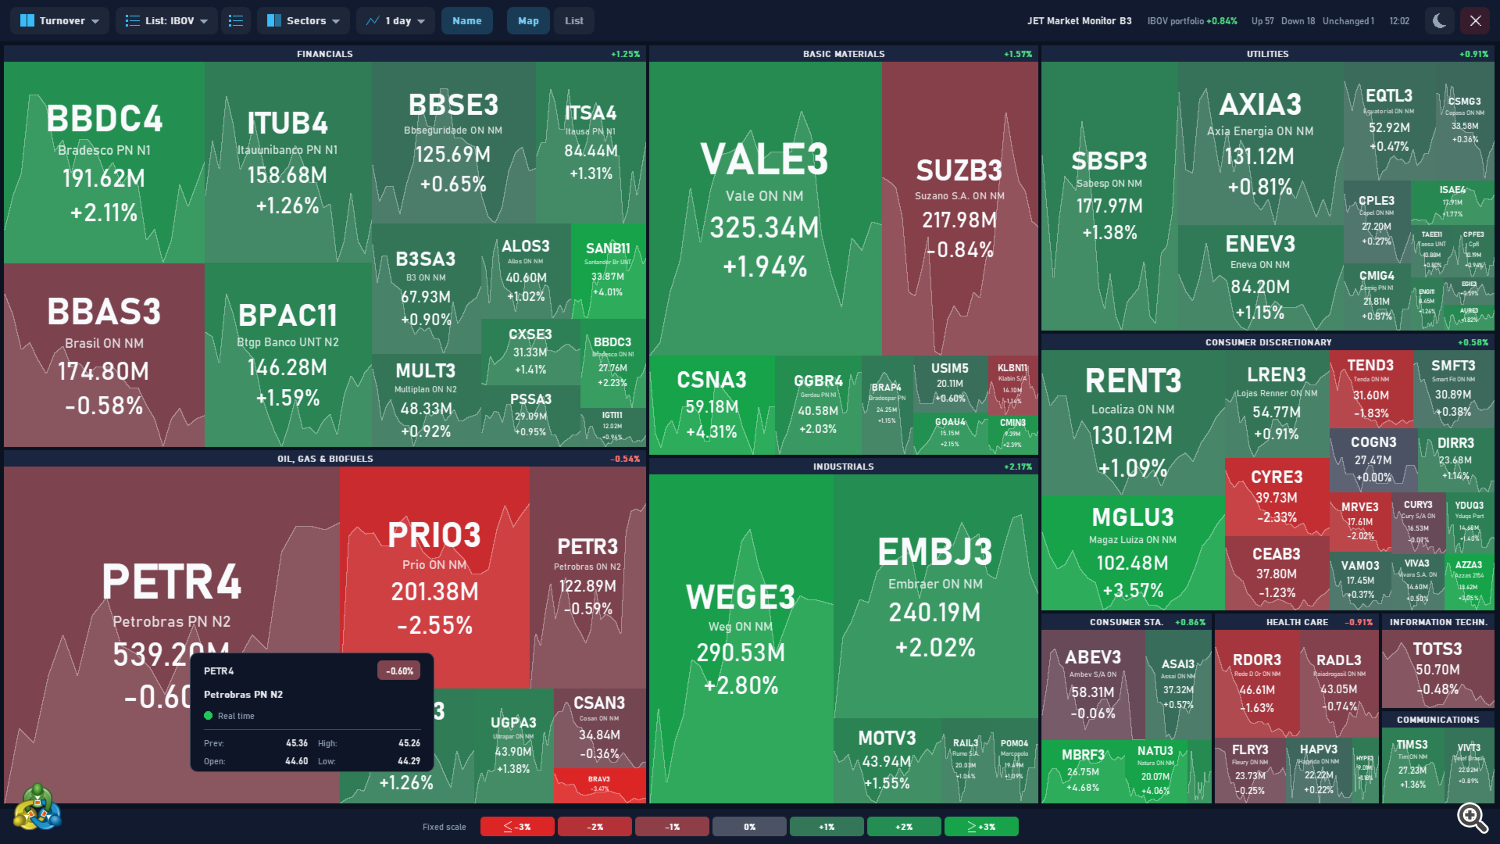
Rest the mouse for 1 second over a box or row. The box opens next to the cursor and updates live:
- ticker and day's change;
- full name (e.g., "Petrobras PN N2");
- status: Real time (the stock has traded today and is in session), Pre-opening (in session, no trade yet) or Market closed;
- Prev (previous close), Open, High, Low.
It disappears when you move to another box, leave the map, open a menu or click.
4.5 Session and times
- Before the day's first trade (from midnight until the stock market opens, including the auction), each stock shows how it closed the previous session. It switches to the current day as soon as it trades for the first time.
- The status in the summary can be:
| Label | When it appears |
|---|---|
| Close dd/mm | Business day, before any stock has traded: the map shows the close of dd/mm |
| Opening x/n | Opening in progress: x of n stocks have traded today |
| HH:MM | All stocks have traded: time of the last update |
| Last session dd/mm | Weekend or holiday |
4.6 Clicking a stock (PRO)
Click a box or row to open a new chart of the stock or switch the symbol of this chart, according to the click input (the timeframe is also chosen there; default M5). The click can also be turned off.
The click is set in the Click on a stock group: Action and Timeframe of the opened chart.
5. Your own lists (PRO)
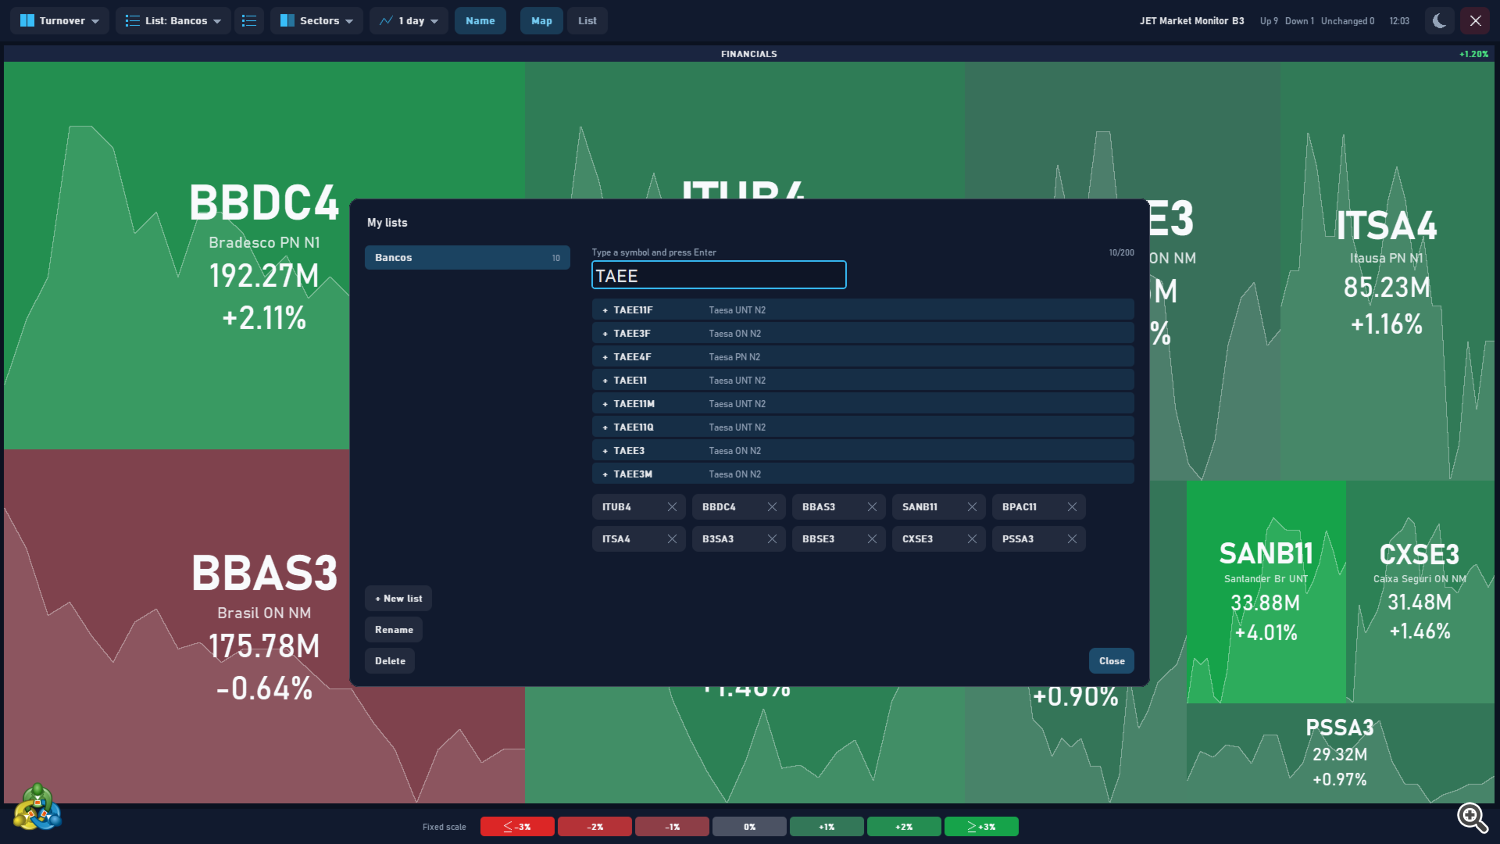
- Open the editor with the icon next to List or with Edit lists in the menu. New list creates an empty list.
- In the editor (My lists), on the left, the lists with their number of symbols and the + New list, Rename and Delete buttons.
- On the right, type the code and press Enter: if a symbol with that exact name exists, it is added; otherwise up to 8 results from your broker appear (starting with or containing the text), with their description. Click a result to add it.
- The list's symbols appear as tags; click a tag to remove it.
- Close returns to the map with the updated list.
- Limits: up to 30 lists, up to 200 symbols per list.
- Symbols outside the IBOV get their sector from the B3 classification when known (otherwise "Other") and weight 0.
- Lists are saved in the MetaTrader common folder ( Common\Files\JetMarketMonitorB3\lists.txt ): they work in every MetaTrader 5 terminal on the computer and survive restarting the terminal or changing charts. Copy this file to back up your lists or move them to another computer.
6. Settings (Inputs tab)
Group and input names appear in English in the Inputs tab, in every language.
| Group | Input | What it does | PRO default | Free |
|---|---|---|---|---|
| Display | View | Map or List | Map | fixed: Map |
| Display | Organize by (box size) | Box size (options of the 1st button) | Turnover | fixed: Turnover |
| Display | Group | Group by sector or by change | Sector | fixed: Sector |
| Display | Price line inside the boxes | Period of the price line in the boxes | 1 day | fixed: no line |
| Display | Company name under the symbol | Shows the company name | true | ✓ |
| Display | List at start (name of one of your lists; empty = IBOV) | Name of one of your lists to open at start; empty = IBOV | empty (IBOV) | fixed: IBOV |
| Display | Color scale | Fixed or automatic color scale | Fixed | fixed: Fixed |
| Display | Limit of the fixed scale (daily change, %) | Limit of the fixed scale, on the daily change | 3.0 | fixed: 3.0 |
| Price chart | Show the price chart behind the panel | Shows the price chart behind the panel | false | ✓ |
| Price chart | Panel opacity over the chart (%) | Opacity of the panel over the chart | 85 | ✓ |
| Click on a stock | Action | When you click a stock: nothing, open a new chart or switch this chart's symbol | Open a new chart | no click |
| Click on a stock | Timeframe of the opened chart | Timeframe of the opened chart | M5 | — |
| Panel | Theme | Dark or light | Dark | ✓ |
| Panel | Language | Terminal language or one of the 11 languages | Terminal language | ✓ |
| Panel | Size (%) | Panel size | 100 | ✓ |
| Panel | Refresh interval (ms, 200 or more) | Update interval | 500 | fixed: 2 s |
In Free, the Inputs tab only shows Company name under the symbol, Show the price chart behind the panel, Panel opacity over the chart (%), Theme, Language and Size (%). The others are fixed (Free column).
The choices made in the top bar (mode, sorting, grouping, price line period, name, list zoom, list and theme) are saved per chart and come back when the panel is reloaded.
7. Strategy Tester (demo)
- Use visual mode. Outside it the panel draws nothing, since it is a visual-only product.
- While the tester prepares the stocks' history, the panel shows the notice "Loading stock data (x/76)".
- In the tester the panel receives no clicks: menus, details box and list editor do not open. Choose the mode, sorting, grouping, price line period and list (by name) in the inputs before starting.
- On accounts without B3 stocks, the panel shows "B3 symbols not found" and "The panel stays idle on this symbol."
8. FAQ
The panel opened with "B3 symbols not found". The account does not have B3 stocks. Use a broker that offers Brazilian stocks in MetaTrader 5.
Before the open, the map shows the previous day. That is expected: until the day's first trade, each stock shows how it closed the previous session (section 4.5).
The Sort by and Group buttons do not open. In the Free version they are locked to Turnover + Sectors. The other options are in PRO.
A box has three dots in the corner. That stock's history is still arriving from the broker. The price line appears by itself. If the broker has no history for the chosen period, the box stays without a line.
The company name does not appear. Check the Name button. In small boxes, the name only appears if it fits.
A stock in my list shows "Other" and weight 0. That is expected for symbols outside the IBOV whose sector is not in the classification used by the panel.
The IBOV composition changed. The portfolio, sectors and names are updated in new versions of the panel at each review of the index portfolio.
Does the panel slow down the terminal? It only updates the stocks that changed. If needed, increase the update interval (PRO) or turn off the price line in the boxes.
How do I remove the panel? Click the X in the top bar. The chart returns to its original settings.
9. Support
Send your questions through the product page on MQL5 or the jetinvest.com.br website. To speed things up, include the panel version (Free or PRO), your broker and a screenshot of the panel (without your account data).
Trading involves risk of loss. JET Market Monitor B3 shows the current state of the stocks; it does not predict prices and does not guarantee results. Past behaviour does not guarantee future results.