Ribbon Pilot MT5
- Indicators
-
Evgeniy Zhdan
 🚀 Products for MT4 & MT5. Only the best and truly useful tools for traders: https://www.mql5.com/en/users/trendhunter/seller
➖➖➖➖➖➖➖➖➖➖➖➖➖➖➖➖➖➖➖➖➖➖ - Version: 1.1
- Updated: 17 October 2026
- Activations: 20
Ribbon Pilot — Trend Ribbon with Trade Zones, Signal History and Watchlist
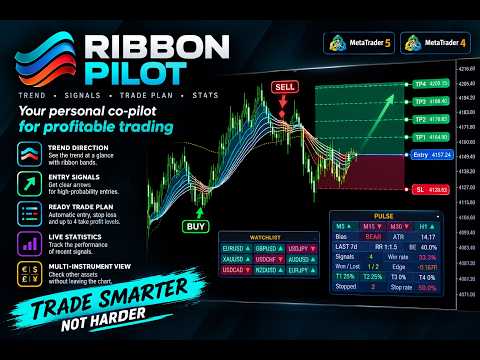
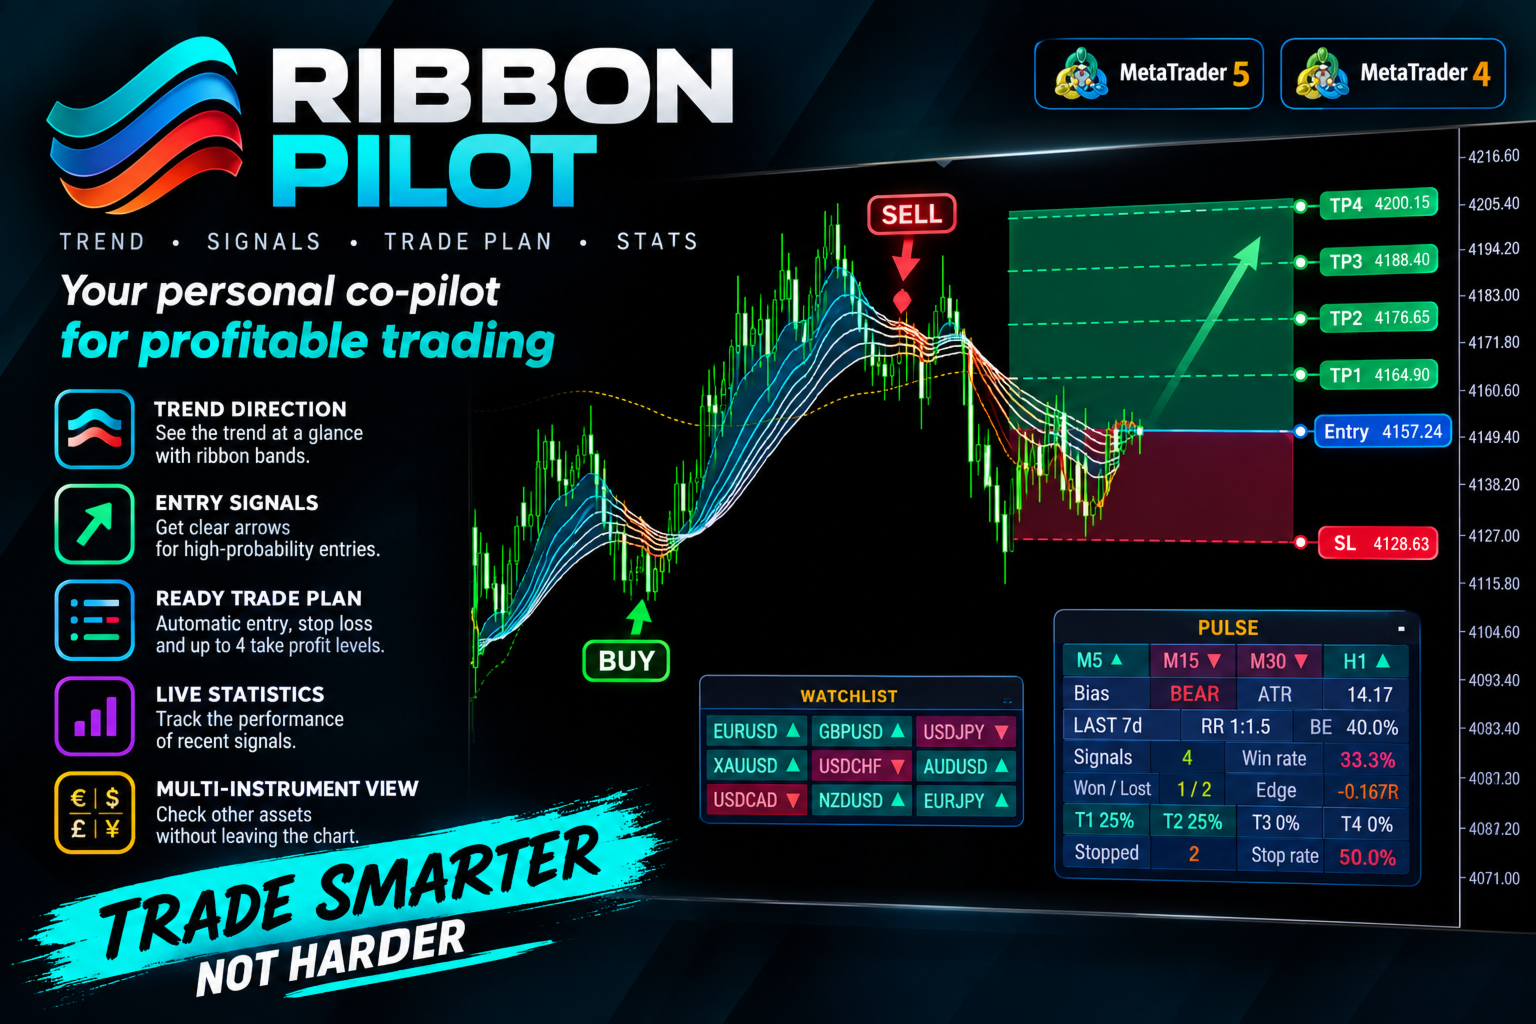
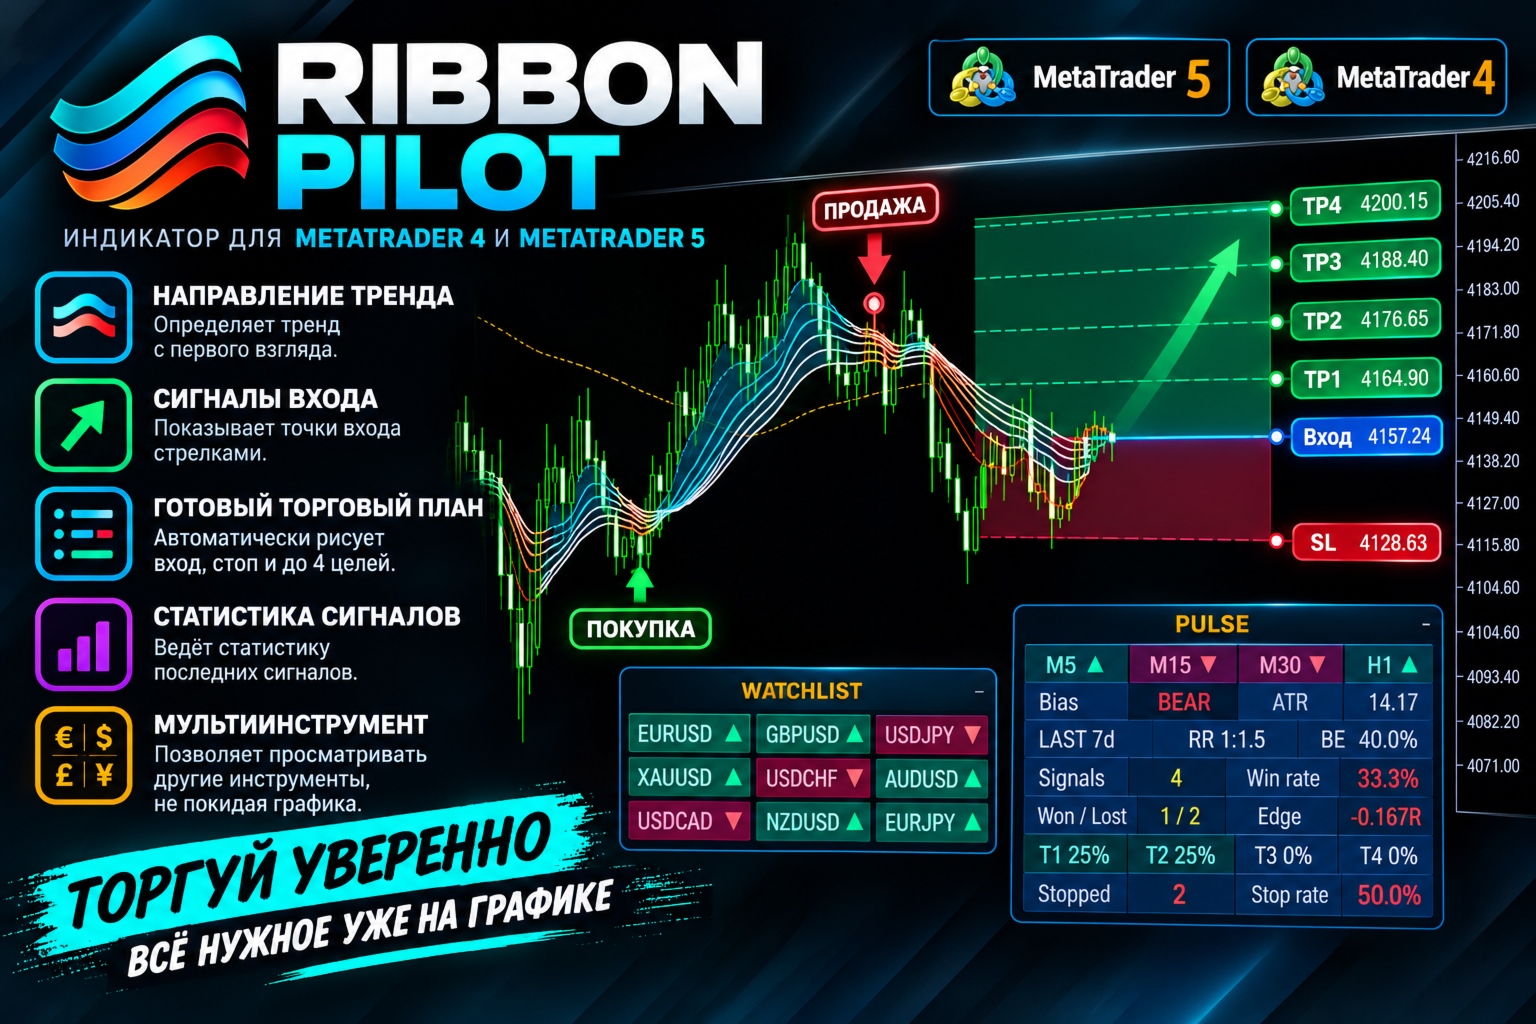
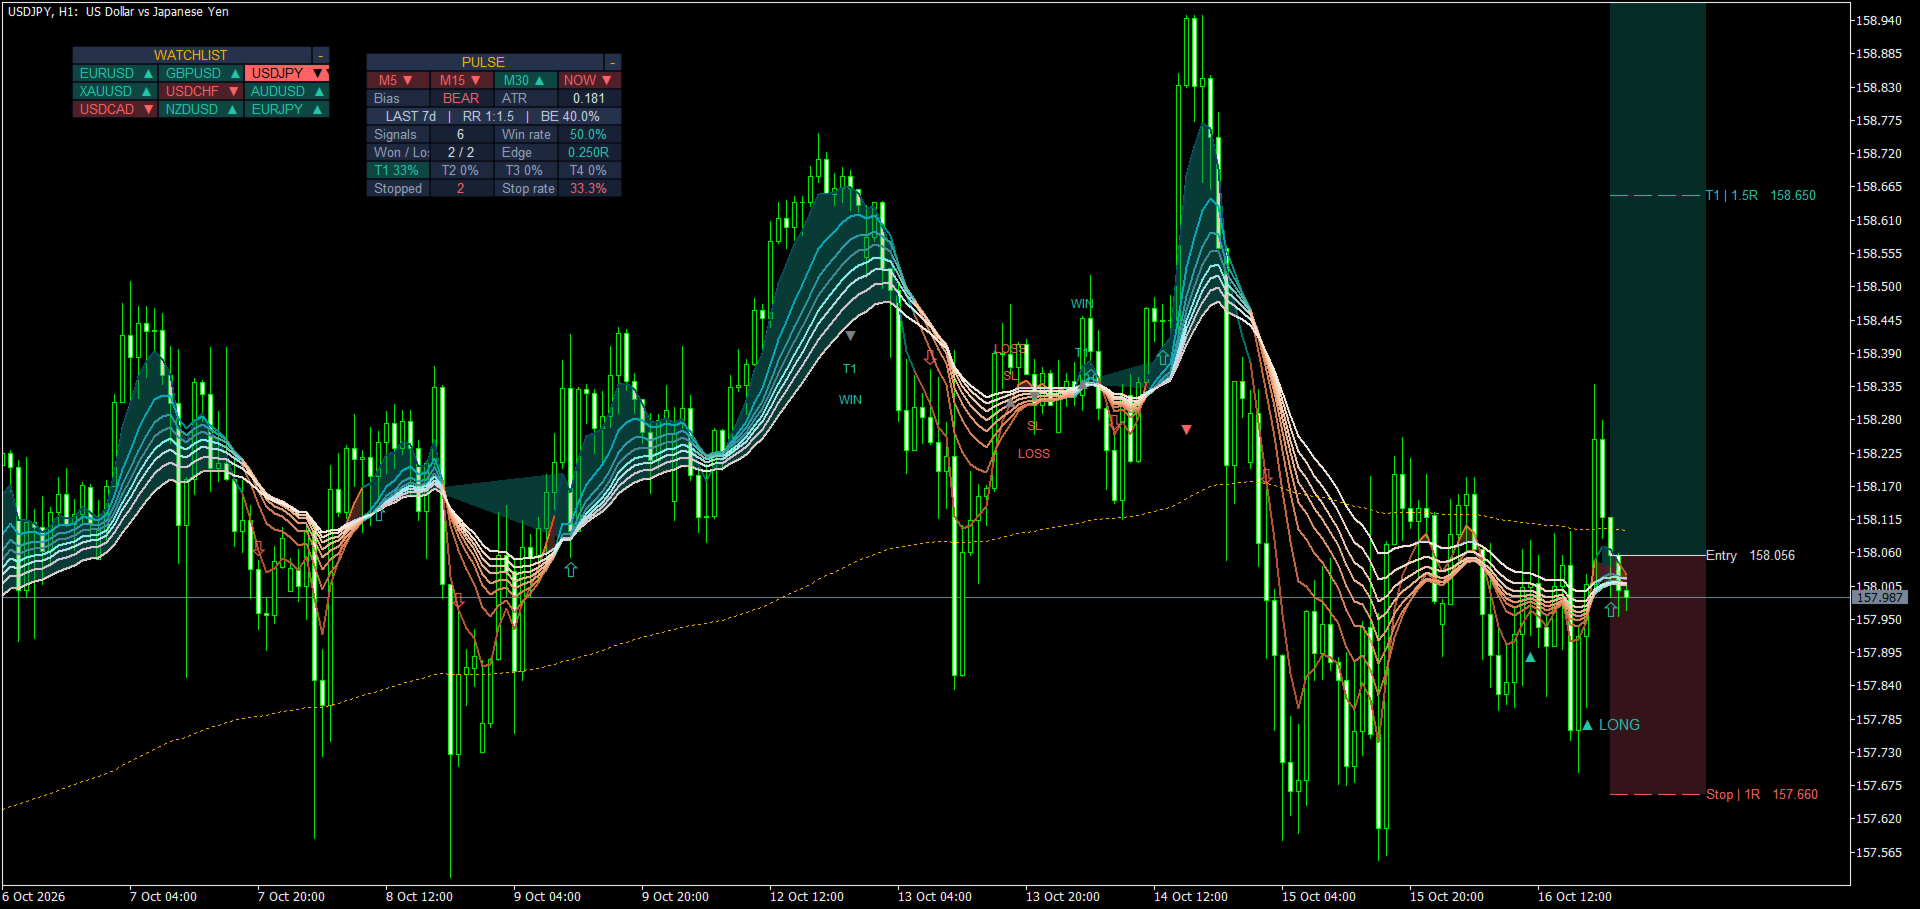
What it is for Ribbon Pilot is a MetaTrader 5 chart indicator that shows the trend direction at a glance, marks entry signals with arrows and draws a ready trade plan at once: entry, stop and up to four profit targets. It also keeps statistics on recent signals and lets you scan other instruments without leaving the chart.
MT4-version: https://www.mql5.com/en/market/product/201908
How it works
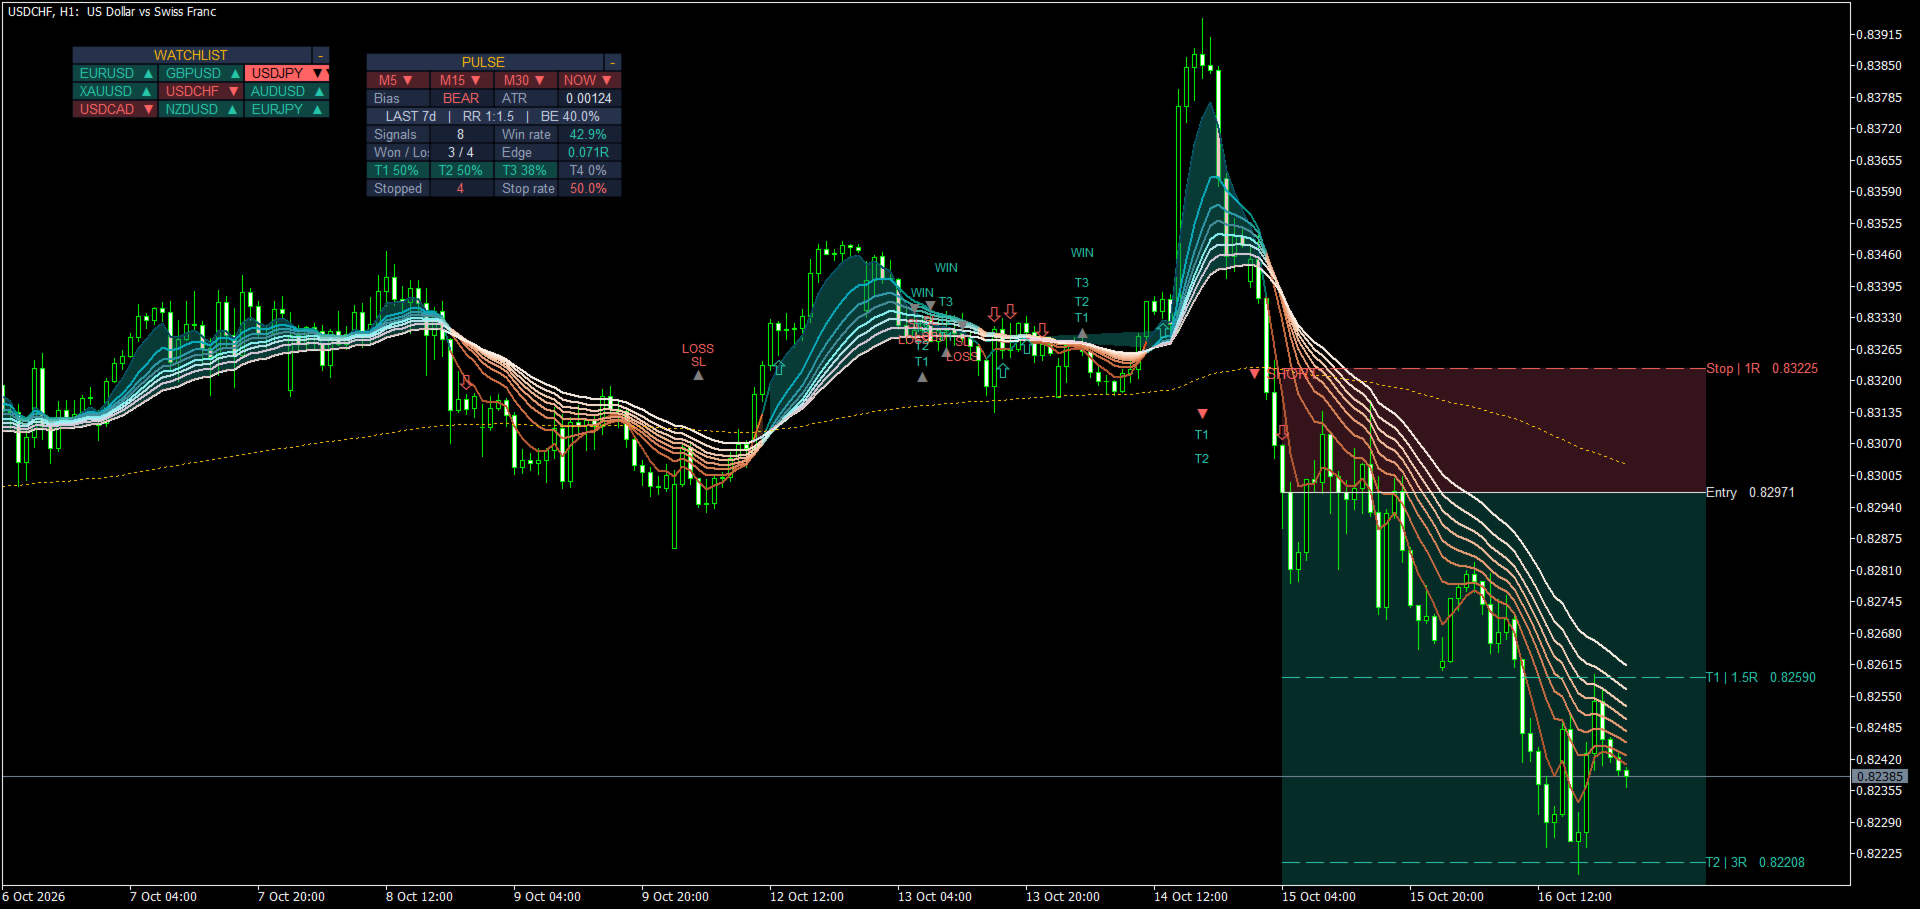
- A ribbon of eight smooth lines follows the price. Teal means uptrend, orange means downtrend. The shading between the lines makes direction and strength easy to read. A dotted golden baseline gives long-term context (visual reference only, not used for signals).
- When the ribbon turns, a ▲ (buy) or ▼ (sell) arrow appears after the bar closes. Signals are never repainted or removed.
- Every signal immediately draws a trade zone: an Entry line, a Stop line and targets T1–T4, expressed as multiples (R) of the stop distance. The zone stays until the stop is hit or all targets are reached.
- Past signals of the last N days are marked on the chart with the targets reached (T1…T4), SL and the final WIN / LOSS result. These feed the statistics in the Pulse block.
How to use
- Attach the indicator to a chart of any instrument and timeframe.
- Wait for an arrow on a closed bar and use the zone levels: entry, stop and targets.
- Check the trend strip in the Pulse block to see whether higher timeframes agree.
- Use the Watchlist to look through other instruments and find fresh signals.
- Turn on alerts so you do not have to watch the chart all the time.
- Adjust periods, stop and targets to your instrument and trading style.
What the panel data means
WATCHLIST — tiles of instruments on the current timeframe
- ▲ on a dark teal tile — bullish ribbon; ▼ on a dark red tile — bearish ribbon.
- ▲▲ on a bright teal tile — the ribbon has just turned up (fresh buy signal); ▼▼ on a bright red tile — fresh sell signal.
- "?" — no data yet (the symbol is missing at your broker or its history is still loading).
- Clicking a tile changes the current trading instrument: the chart switches to the selected symbol on the same timeframe. You can choose to open it in a new window instead. The indicator stays on the chart and block positions are kept.
PULSE — combined block
- The top row of chips M5 / M15 / M30 / NOW shows the ribbon direction on the three chosen timeframes and on the current one: ▲ up, ▼ down.
- Bias — overall lean of the three strip timeframes: BULL or BEAR.
- ATR — current volatility in price units.
- LAST 7d | RR 1:1.5 | BE 40.0% — statistics window in days, risk/reward of the first target, and the win rate needed to break even at that ratio.
- Signals — number of signals in the window.
- Win rate — share of finished signals that reached at least the first target before being stopped. Green means above the break-even level (BE).
- Won / Lost — number of winning / losing signals.
- Edge — average expected result per signal in risk units (R) based on the window; green means positive.
- T1–T4 — share of all signals that reached each target.
- Stopped and Stop rate — number and share of signals stopped out before reaching any target.
- Each block can be dragged by its header and collapsed with the "-" / "+" button. The position is remembered.
Settings
- MQL5.com account — link to the author's profile, no need to change it.
- Ribbon: Show Ribbon Lines, Show Ribbon Shading — turn lines and shading on or off; Ribbon Line 1–8 Period — periods of the eight lines (defaults 5, 11, 15, 18, 21, 24, 28, 34): they set how fast the ribbon reacts and how often signals appear; Baseline Period — period of the golden baseline (visual reference only).
- Trade Levels: Profit Targets (1-4) — how many targets are drawn and tracked; Stop Distance (x ATR) — stop distance in multiples of ATR (default 2.0); Target Step (R multiple per target) — target step: T1 = this value × stop distance (1.5), T2 = ×2, T3 = ×3, T4 = ×4; ATR Period — ATR period (14); Draw Trade Zones — show lines, labels and colored zones.
- Signal History: Show Past Signal Markers, Show Past Target / Stop Tags, Show WIN / LOSS Tags — what to display for past signals; Marker Offset (bars) — how far left of the signal bar the tags are placed; Tag Spacing (x ATR) — spacing between stacked tags; History Window (days) — how many days are shown and counted in statistics (7).
- Pulse Block: Show Trend Strip, Show Performance Stats — which parts to show; Pulse Block Position — chart corner; Strip Timeframe 1 / 2 / 3 — timeframes of the trend strip (M5, M15, M30); Block Border Color — border color of the blocks.
- Watchlist: Show Watchlist, Watchlist Position, Watchlist Size (1-9) — number of tiles; Watchlist Click Action — Switch This Chart (change the instrument on the current chart) or Open New Chart (open in a new window); Watchlist Symbol 1–9 — instrument names, which must match your broker's names (including suffixes).
- Colors: Entry Line Color, Target Color, Stop Color, Target Zone Color, Stop Zone Color.
- Alerts: Alert: Popup, Alert: Sound, Alert: Push Notification, Alert: Email. The alert text contains symbol, timeframe, direction, entry, stop and T1.
For Expert Advisors (iCustom) Buffer numbers: 21 — Buy arrow, 22 — Sell arrow, 23 — Signal (1 buy, −1 sell, 0 none), 24 — Entry, 25 — SL, 26–29 — TP1–TP4, 30 — Trade State (1 / −1 while a trade is active, otherwise 0). Read the signal on the bar with shift 1.