MTF Trend Scanner
- Indicators
-
Vincent Jose Proenca
 I’ve been a trader for over ten years, mainly specializing in CFDs. What I love about trading is the logic, the discipline, and the process of creating tools that simplify decision-making. Since I couldn’t find indicators that fit my approach, I started coding them myself, first out of necessity
 - Version: 1.0
- Activations: 5
MTF Trend Scanner is a professional multi-timeframe analysis tool that helps you identify trend alignment across multiple timeframes at a glance.
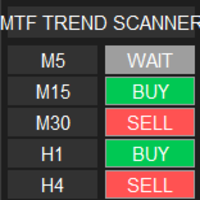
The indicator displays a compact dashboard showing real-time trend status for M5, M15, M30, H1, and H4 timeframes simultaneously. No need to switch charts - all the information you need is on one panel.
HOW IT WORKS
The indicator combines two proven technical analysis methods:
- Moving Average Crossover (Fast EMA vs Slow EMA)
- RSI Filter (above/below 50 level)
Signal Logic:
- BUY: Fast MA > Slow MA AND RSI > 50
- SELL: Fast MA < Slow MA AND RSI < 50
- WAIT: Mixed conditions (no clear trend)
KEY FEATURES
- Real-time updates (500ms refresh + tick-by-tick)
- Clean, modern dark-themed interface
- Color-coded cells for instant visual recognition
- Fully customizable parameters
- Lightweight - minimal CPU usage
- Works on any symbol and timeframe
- No repainting - signals are calculated on current bar close values
PARAMETERS
Indicator Settings:
- Fast MA Period (default: 9)
- Slow MA Period (default: 21)
- MA Method (EMA/SMA)
- RSI Period (default: 14)
Visual Settings:
- Buy/Sell/Neutral colors
- Background and border colors
- Panel position (X/Y coordinates)
- Corner selection (0-3)
- Scale percentage (resize panel)
RECOMMENDED USE
- Use for trend confirmation before entering trades
- Look for timeframe alignment (all green = strong uptrend)
- Combine with your existing strategy as a filter
- Ideal for swing trading and intraday trading
The indicator displays a compact dashboard showing real-time trend status for M5, M15, M30, H1, and H4 timeframes simultaneously. No need to switch charts - all the information you need is on one panel.
HOW IT WORKS
The indicator combines two proven technical analysis methods:
- Moving Average Crossover (Fast EMA vs Slow EMA)
- RSI Filter (above/below 50 level)
Signal Logic:
- BUY: Fast MA > Slow MA AND RSI > 50
- SELL: Fast MA < Slow MA AND RSI < 50
- WAIT: Mixed conditions (no clear trend)
KEY FEATURES
- Real-time updates (500ms refresh + tick-by-tick)
- Clean, modern dark-themed interface
- Color-coded cells for instant visual recognition
- Fully customizable parameters
- Lightweight - minimal CPU usage
- Works on any symbol and timeframe
- No repainting - signals are calculated on current bar close values
PARAMETERS
Indicator Settings:
- Fast MA Period (default: 9)
- Slow MA Period (default: 21)
- MA Method (EMA/SMA)
- RSI Period (default: 14)
Visual Settings:
- Buy/Sell/Neutral colors
- Background and border colors
- Panel position (X/Y coordinates)
- Corner selection (0-3)
- Scale percentage (resize panel)
RECOMMENDED USE
- Use for trend confirmation before entering trades
- Look for timeframe alignment (all green = strong uptrend)
- Combine with your existing strategy as a filter
- Ideal for swing trading and intraday trading

















































































