Volume Profile Density v2
- Indicators
-
Vincent Jose Proenca
 I’ve been a trader for over ten years, mainly specializing in CFDs. What I love about trading is the logic, the discipline, and the process of creating tools that simplify decision-making. Since I couldn’t find indicators that fit my approach, I started coding them myself, first out of necessity
- Version: 3.1
- Updated: 11 December 2025
Volume Profile Density V2.40
Displays the distribution of traded volume by price level, showing where institutional activity occurs.
Unlike standard volume (over time), it reveals where volume actually concentrated.
Key points:
-
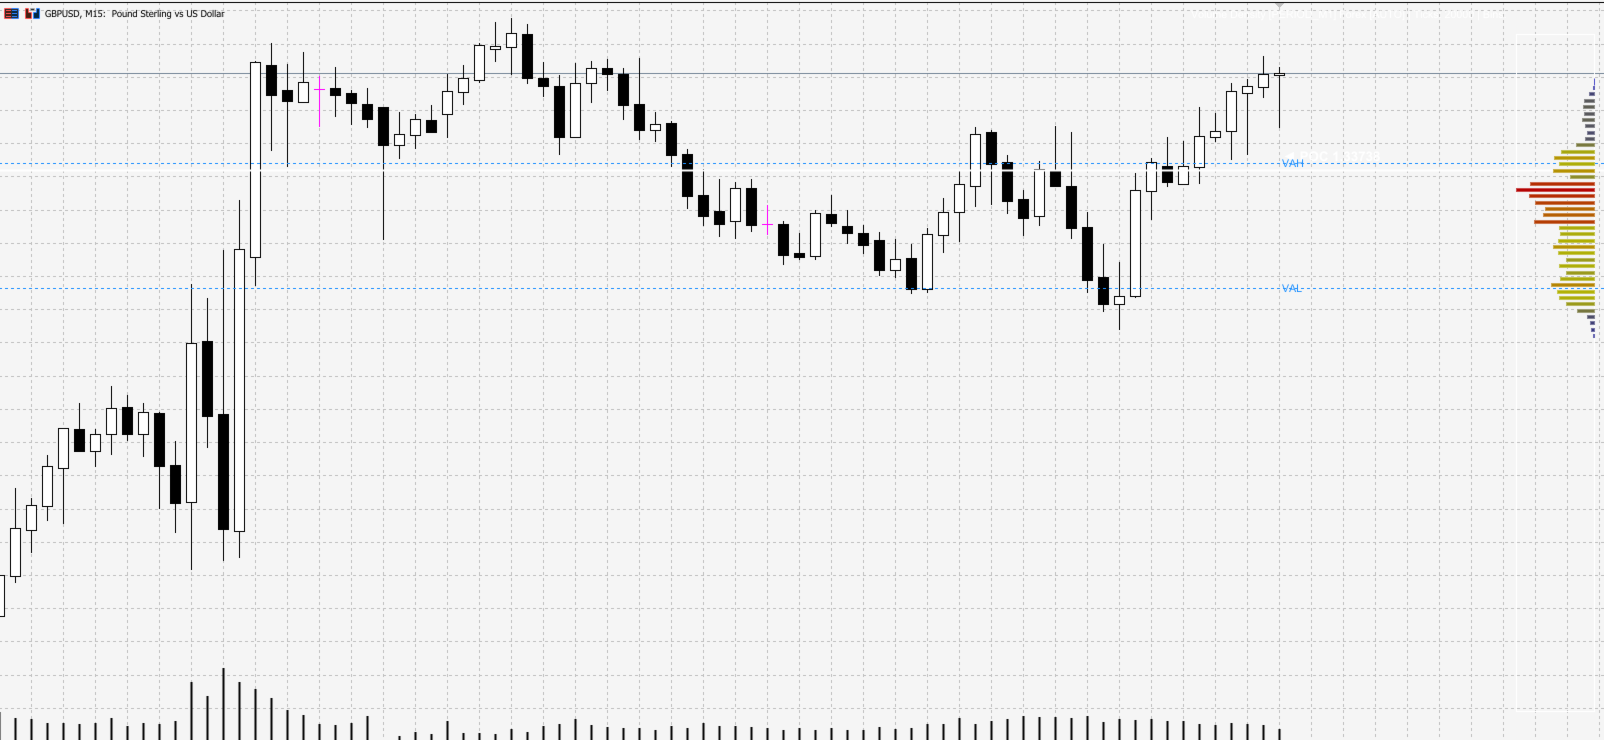
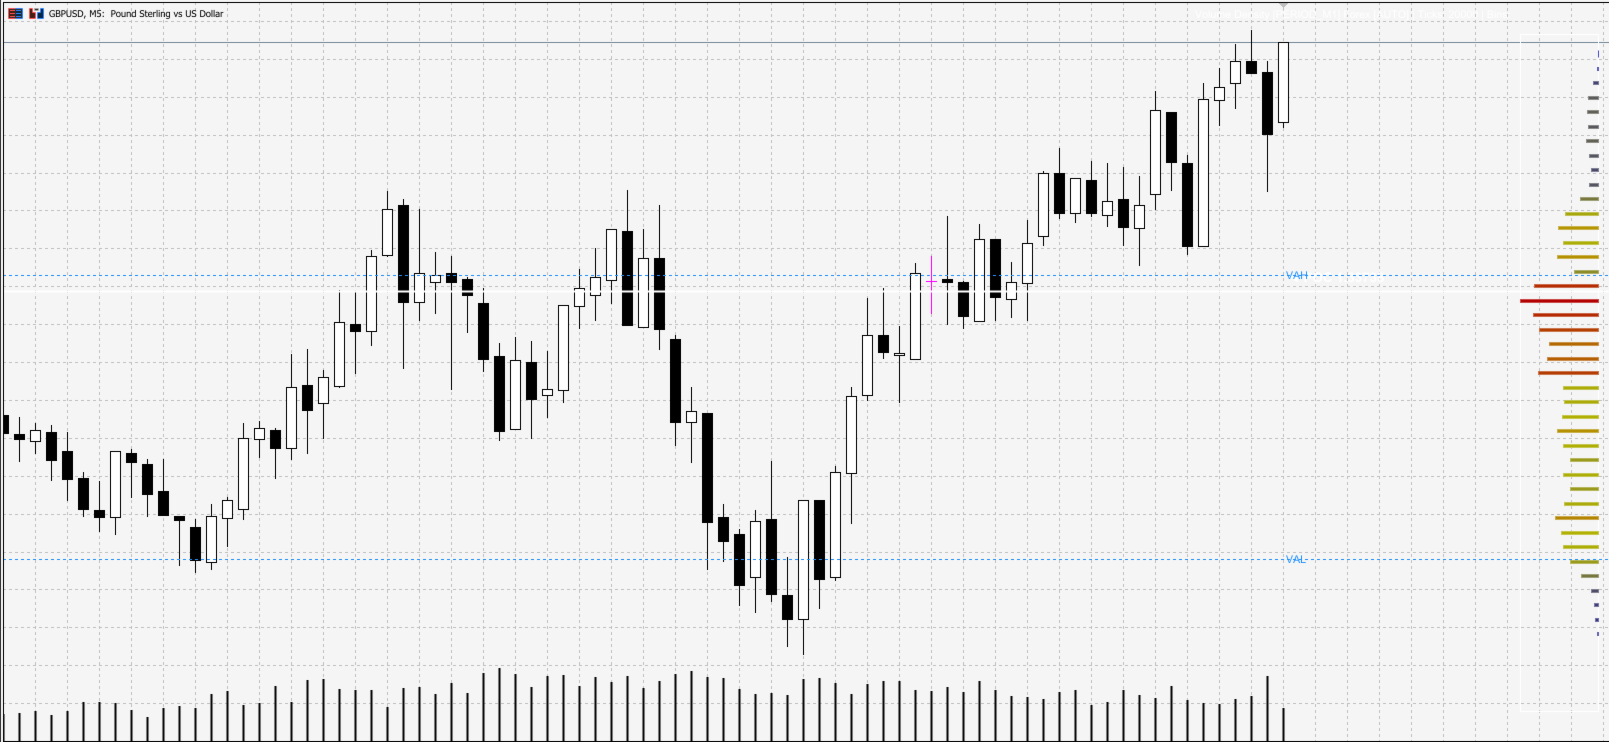
Horizontal bars = volume at each price
-
Longer bar → higher volume
-
Red zones = major support/resistance
Main uses:
-
Identify true support/resistance zones
-
Locate POC (Point of Control)
-
Define Value Area (70% of total volume)
-
Use low-volume zones for stops and targets
Color guide:
-
Blue = low volume (fast zones)
-
Yellow = medium volume (balance)
-
Red = high volume (institutional)
Strategies:
-
Buy rebound on red zone (support)
-
Sell rejection at red zone or VAH
-
Trade POC breakouts with volume
-
Enter on return to POC
-
Target blue zones
Settings:
-
Beginner: 1.0 / 100% / 1.0
-
Scalping: 0.5 / 200% / 0.5
-
Swing: 2.0 / 50% / 1.5
Technical info:
-
Version: 2.40
-
Platform: MT5
-
Assets: Forex, CFD, Metals, Crypto
-
Timeframes: M1–M15
-
Type: Real-time adaptive indicator
Summary:
Trade with volume zones — not against them.












































User didn't leave any comment to the rating