Volume indicator

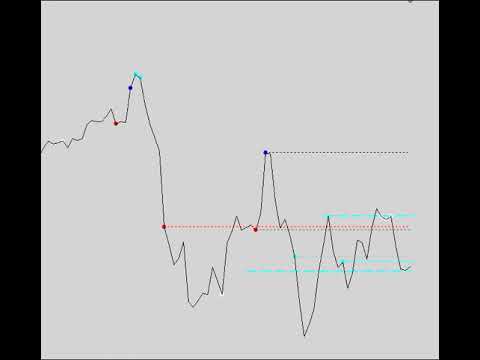
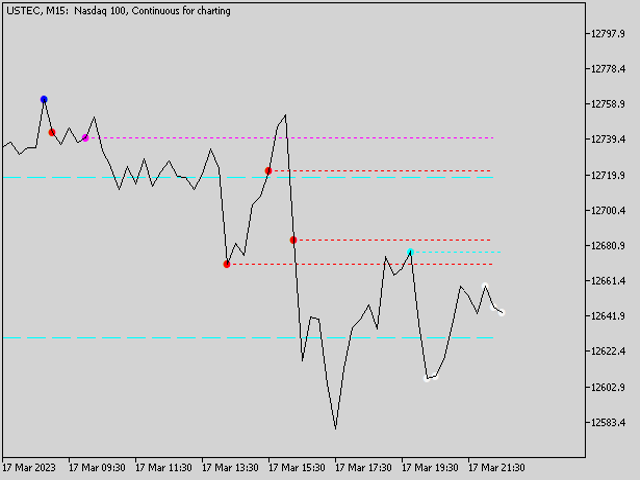
The indicator works with two time periods, has a visual display of events directly on the working chart and is able to display horizontal levels that serve as support / resistance levels.

Different values of formed volumes are displayed as a colored mark on the corresponding bar, from which levels are built, directed to the right side of the chart. On the working chart, the levels received from the older time period are also displayed. The display of levels and their properties are set in the indicator settings. The levels of the time period that has become, usually have a higher priority. Each level has a tooltip containing the necessary information about the level. The average range value (ATR) is used to obtain actual levels. It is possible to use both tick and real (if available) volume values.

The volume indicator is based on the idea implemented in the indicator “The Better Volume Indicator”.

The indicator algorithm is adapted to work at the current moment and is not intended for the analysis of historical data.


Displayed events

  • VCU - climax of volume up on a large bar range
  • VCN - volume climax neutral on a large bar range
  • VCD - volume down climax on a large bar range
  • HVC - high volume on low bar range
  • VCHVC - Combination of VCU, VCN, VCD
  • LV - low bar volume

*a more detailed description of the events displayed by the indicator is in the public domain under the original name.


Input parameters

  • Volume mode: Tick / Real - selection of the volume data acquisition mode
  • Range for calculate, pcs - number of bars to calculate
  • Dot size multiplier - multiplier for changing the label size
  • Displayed of levels for current period - display of levels for the current period
  • Displayed of levels for high period - displaying levels for a high period
  • High period for plotting - high period for plotting levels
  • Number of displayed levels, pcs - number of displayed levels
  • Style of Current period lines - style of current period levels
  • Style of High period lines - style of high period levels
  • Line for VCU, VCN, VCD, HVC, VCHVC, LV true:ON / false:OFF - display levels
  • Color of VCU, VCN, VCD, HVC, VCHVC, LV mark - color of the mark
  • Period for ATR calculate - period for calculating the average range (ATR)
  • Bars for ATR calculate - number of bars to calculate the average range (ATR)

Recommended products
Beholder
Joao Marcilio
BEHOLDER – THE INDICATOR THAT REVEALS HIDDEN PATTERNS IN TIME THE REAL TRADER’S PROBLEM: TEMPORAL BLINDNESS Every week, thousands of traders face the same dilemma: A flood of economic events (NFP, CPI, Interest Rates, Retail Sales…) Very little time to analyze correlations Decisions made on “gut feeling,” without reliable historical context Trying to do this manually is insane: Scrolling back through dozens of weeks on the calendar Comparing event by event Trying to calculate patt
Candle Timer is a lightweight indicator that shows the remaining time until the current candle closes. It is designed to be minimal and configurable, allowing traders to keep focus on price action while still monitoring candle closing time. The indicator can be displayed as a fixed label on the chart or follow the current market price. Features • Displays remaining candle time • Option to show only the time or include label text • Optional price-following mode • Automatic neutral color base
CandleTimer Countdown MT5
Robby Suhendrawan
4 (1)
Candle Timer Countdown (CTC) – Minimalist & Precise Candle Timer Candle Timer Countdown (CTC) is a lightweight and non-intrusive MetaTrader indicator that displays the remaining time of the current candlestick on your chart. Designed with simplicity and clarity in mind, this tool helps traders stay aware of candle closures without cluttering the chart. Key Features: Real-Time Candle Countdown Always know how many seconds are left before the current candle closes – works on all timeframes. Minima
FREE
iVolX indicator horizontal volumes for all time periods Main settings of the indicator: VolumeSource - select data for volumes (tick or real) PeriodMinutes - selection period for rendering of volumes PeriodsNumber - number of periods to show on the chart StartDate - the start date of the calculations ClusterPoints - cluster width Color - color MaxVolColor - maximum volume color ValueArea - the value of the zone of balance ValueAreaColor - color of the balance zone MaxVolFontSize - font size Mav
Smart Wave Trend Analyzer An advanced trend detection system that automatically identifies and draws high-quality trend lines based on wave analysis and fractal patterns. MT4-version:  https://www.mql5.com/en/market/product/164395 Main Components: 1. MAJOR LINES (Blue/Red, Thick) —   Long-term trend based on SMA(70) and LWMA(10) crossover Identifies main peaks and troughs in price movement Blue line = Resistance (connecting highs) Red line = Support (connecting lows) Suitable for swing trading
In the fast-paced world of cryptocurrency trading, understanding market dynamics is crucial for making informed decisions. One of the key indicators that traders use to analyze market behavior is Volume Delta, which offers insights into the balance between buying and selling pressure. This article explores the concept of Volume Delta, its significance in order flow analysis, and how it can be used effectively in trading strategies. By providing a clear understanding of this indicator, traders ca
Einstein Pivot Point
Luis Cesar Nunes Dos Santos
Einstein Pivot Point indicator shows you hourly, weekly or monthly pivot points and support and resistance levels. You can choose 3 different formula for the support and resistance levels (Classic Formula, Woodie Pivot Points and Fibonacci Pivot Points). Einstein Pivot Point   will automatically calculate the p ivot point   and   support  and  resistance levels  on the basis of market data. Trading requires reference points (support and resistance), which are used to determine when to enter the
LevelPAttern MT5 is a technical indicator based on the daily levels and Price Action patterns. The indicator is based on the standard ZigZag indicator + reversal candlestick pattens, such as Star, Hammer (also knows as Pin bar), Engulfing and others. The indicator generates audio and text notifications when a pattern is formed and a level is touched. It also supports sending email and push notifications. Indicator operation features It is suitable for working with any CFD and FOREX trading inst
A Renko Tick chart based on continuously adjusting percentage. Live Renko bricks formed by tick data Adjustable brick width expert for indicator attached Scalp with a Renko, get weird. The settings can and will break the script if you turn them up too high. Turning off outline mode will not look as nice, but can potentially allow for a larger number of bricks.
FREE
Japanese Candlestick Indicator
Alexander Denisovich Jegorov
Simple Japanese candlestick indicator Contains 3 patterns: - bearish engulfing - bullish engulfing - doji Only contains these 3 because after rigorous testing and trading (data) these seem to be the most efficient. Also contains: - alerts if enabled  When japanese candlestick is detected it is colored with relevant color depending on bias, and also shows label next to it. Labels: - BEG = Bearish engulfing - BE = Bullish engulfing - DO = Doji
Price Statistics MT5
Miguel Antonio Rojas Martinez
This indicator works only 5 digits Brokers. It is impossible to talk about the study of the Forex market or any market without considering of that market statistics. In this case, our indicator "price statistics" we have a new way to study our chart, giving information of the price in a range of pips you want to study for example, can we know how many times the price closes or opens into spaces 10, 20, 30, 50, 100 pips or more; and know them not only in numbers but also draws this relationship a
This MT5 indicator is a custom implementation of the popular ICT Killzones + Pivots concept ( Inspired By SMC ICT Concept ). Make Sure Your Push Notification Mt5 Enable    You will get all notification on your mobile Session Break , Day Week etc. IC Market Or 2 GMT Broker Use  -7 Time Input / Exness or 0 timezone broker Use -5 Time   Broker Timing will impact for Session Trading It is designed for intraday / smart money concept (SMC) traders who follow Inner Circle Trader (ICT) methodology and
Crypto_Forex Indicator "Hammer and Shooting Star pattern" for MT5, No repaint, No delay. - Indicator "Hammer and Shooting Star pattern" is very powerful indicator for Price Action trading. - Indicator detects bullish Hammer and bearish Shooting Star patterns on chart: - Bullish Hammer - Blue arrow signal on chart (see pictures). - Bearish Shooting Star - Red arrow signal on chart (see pictures). - With PC, Mobile & Email alerts. - Indicator "Hammer and Shooting Star pattern" is excellent to co
Donchian Breakout And Rsi
Mattia Impicciatore
5 (1)
General Description This indicator is an enhanced version of the classic Donchian Channel , upgraded with practical trading functions. In addition to the standard three lines (high, low, and middle), the system detects breakouts and displays them visually with arrows on the chart, showing only the line opposite to the current trend direction for a cleaner view. The indicator includes: Visual signals : colored arrows on breakout Automatic notifications : popup, push, and email RSI filter : to val
FREE
FVGs + Alerts is a Fair Value Gap detector and visualizer designed specifically for MetaTrader 5.  It helps traders identify and track price imbalances (Fair Value Gaps) that often act as key support/resistance or reaction zones in Smart Money Concepts (SMC) and ICT trading approaches. What is a Fair Value Gap (FVG)? A classic 3-candle Fair Value Gap forms when there is a strong imbalance between consecutive candles: Bullish FVG (potential support zone): High of candle [n-2] < Low of candle [n]
FREE
LT Rainbow Trend
Thiago Duarte
5 (1)
Do you, like me, like to trade with the trend? Then this indicator will help you! Rainbow Trend is a trend indicator, which uses several Moving Averages on the chart. It measures different trend strenght zones for different periods: very long term, long term, mid term, short term and very short term. Each zone has its color, and it is possible to have sound alert when the prices leaves a zone and enters another. Its configuration is very simple. If you find any bug or have any suggestions, conta
This indicator plots in the candles the divergence found in the selected indicator and can also send a notification by email and / or to the cell phone. Works on all TIMEFRAMES. Meet Our Products   He identifies the divergences in the indicators: Relative Strength Index (RSI); Moving Average Convergence and Divergence (MACD); Volume Balance (OBV) and;. iStochastic Stochastic Oscillator  (STOCHASTIC). It is possible to choose the amplitude for checking the divergence and the indicator has to b
MT5 Rectangle Extender Indicator
Muhammad Shamsuddeen Muhammad
MT5 Rectangle Extender Indicator is a simple and easy tool that automatically extends any box/rectangle drawn on the chart to the right edge of the screen.  This tool can be used for easy drawing of zones and can help with determining future areas of interest on the chart once price trades back to those levels. Very suitable for supply and demand, order blocks, POI's (Points of Interest) mapping on charts. Sometimes its better to have a zone than a single price level as price can shoot above or
Support & Resistance indicator is a modification of the standard Bill Williams' Fractals indicator. The indicator works on any timeframes. It displays support and resistance levels on the chart and allows setting stop loss and take profit levels (you can check the exact value by putting the mouse cursor over the level). Blue dashed lines are support level. Red dashed lines are resistance levels. If you want, you can change the style and color of these lines. If the price approaches a support lev
Nine Five Count
Alfred Mirzasalikhov
The 9-5 Count is designed to track a very powerful cycle that runs through all freely traded markets. This is not a time cycle but a price cycle. The time spent between two points is not as important as the price traveled between them. The 9-5 Count is called that because one complete upward cycle consists of measurement of 9 units plus 5 units of cycle time.   This tool takes into account price and pattern together, so it’s more than just a simple cycle. The 9-5 theory classifies market movemen
Vortex 5
Ivan Simonika
Vortex Indicator — Multi-Timeframe Trend Reversal Tool Vortex is a professional technical analysis solution designed to detect potential trend reversals and key intraday support/resistance levels. The indicator applies a proprietary algorithm that processes price extremes (High/Low) over a defined period to construct dynamic price channels. Core Logic The indicator segments price data according to selected time intervals (H4, Daily, or custom sessions) and calculates averaged levels of price
The indicator displays support and resistance levels based on fibonacci level in multi period Creates lines indicating the latest support and resistance levels. These lines are updated whenever there is a change in support or resistance levels. Labels are removed if the corresponding conditions are not met. the period is availble in setting and level fibonacci
FREE
Dynamic Pivot Zones
Vincent Jose Proenca
Dynamic Pivot Zones – Your Level Assistant on the Chart This indicator is a bit like a GPS for your trading . It shows you where the price likes to hang out, where it gets nervous, and where it flies through. No more calculating pivots by hand or guessing support and resistance levels. What it does: Automatically plots H1, H4, and D1 pivots . Shows support and resistance zones : R1, R2, S1, S2. Lines are colored and easy to read , so you can instantly see what’s hot or cold. Why you’ll love it:
FREE
Crypto_Forex Indicator "Double Shooting Star pattern" for MT5, No repaint, No delay. - Indicator "Double Shooting Star pattern" is very powerful indicator for Price Action trading. - Indicator detects rare but efficient pattern: bearish Double Shooting Star on chart: - Bearish Double Shooting Star pattern - Red arrow signal on chart (see pictures). - It has built-in PC and Mobile alerts. - Indicator "Double Shooting Star pattern" is excellent to combine with Support/Resistance Levels. Click h
LZ Multi Candle Timer
Lukasz Tomasz Zychal
LZ Multi-Timeframe Candle Timer displays the remaining time before the current bar closes for multiple timeframes simultaneously on a single dashboard. Monitor up to 9 timeframes (M1, M5, M15, M30, H1, H4, D1, W1, MN1) without switching charts. The indicator uses server time, updates every second, and is optimized for smooth display with minimal CPU use. Feature highlights - Multi-timeframe display: select which timeframes to show (M1 through MN1) via boolean inputs. Display only the interval
FREE
Day Trader WorkTime
Aurthur Musendame
4.75 (16)
The worktime indicator helps you identify the most important times to day to trade the currency pairs. It was created based on the ICT day trading free tutorials that are freely vailable on his youtube channel.  You can use this indicator together with my other indicators that i have shared freely with you like the true day, custom periods, daily month, weekly open lines - they together complement each other very well. Nuggets from this indicator: 1. Draws the asian session box showinng you the
FREE
PZ Chart Overlay MT5
PZ TRADING SLU
4 (1)
Master the market: harness the power of statistical arbitrage This indicator showcases the price action of multiple instruments on a single chart, enabling you to compare the fluctuations of different assets and seamlessly implement statistical arbitrage strategies. Its main usage is to find correlated symbols which are temporarily out of whack. [ Installation Guide | Update Guide | Troubleshooting | FAQ | All Products ] Find overbought or oversold currency pairs easily Plot up to six currency
FREE
Little useful tool - you manually select range on chart by dragging vertical blue lines and indicator shows support and resistance zones for this range and extends them outside of selected range.  Useful for: * Range trading * Range breakout * Range breakout & retest * Good entry during pullback in trend phase when previous high is retested * Good for scalping on short timeframes * Good for trades on longer timeframes around selected important zones like daily high or low
FREE
FVG Indicator Osw MT5
William Oswaldo Mayorga Urduy
FVG Pro Institutional Scanner Advanced Fair Value Gap (FVG) detector for Smart Money traders. Automatically scans and highlights critical liquidity imbalances on the chart, allowing for the anticipation of price reactions, trading of high-probability continuations, and refinement of institutional entries. Parameter Guide CandlesScan: Historical candle limit analyzed to optimize platform performance. FVGPointsMin: Minimum gap size (in points) required to filter out noise and minor market moveme
Balance of Power (BOP) indicator with multi-timeframe support, customizable visual signals, and configurable alert system. Freelance programming services, updates, and other TrueTL products are available on my MQL5 profile . Feedback and reviews are highly appreciated! What is BOP? Balance of Power (BOP) is an oscillator that measures the strength of buyers versus sellers by comparing the change in price to the range of the bar. The indicator is calculated as (Close - Open) / (High - Low), th
FREE
Buyers of this product also purchase
SuperScalp Pro
Van Minh Nguyen
5 (14)
SuperScalp Pro – Advanced Multi-Filter Scalping Indicator System SuperScalp Pro is an advanced scalping indicator system that combines the classic Supertrend with multiple intelligent confirmation filters. The indicator performs efficiently across all timeframes from M1 to H4 and is especially suitable for XAUUSD, BTCUSD and major Forex pairs. It can be used as a standalone system or flexibly integrated into existing trading strategies. The indicator integrates more than 11 filters, including fa
Azimuth Pro
Ottaviano De Cicco
5 (6)
LAUNCH PROMO Azimuth Pro price is initially set at 299$ for the first 100 buyers. Final price will be 499$ . THE DIFFERENCE BETWEEN RETAIL AND INSTITUTIONAL ENTRIES ISN'T THE INDICATOR — IT'S THE LOCATION. Most traders enter at arbitrary price levels, chasing momentum or reacting to lagging signals. Institutions wait for price to reach structured levels where supply and demand actually shift. Azimuth Pro maps these levels automatically: swing-anchored VWAP, multi-timeframe structure lines, an
Divergence Bomber
Ihor Otkydach
4.9 (86)
Each buyer of this indicator also receives the following for free: The custom utility "Bomber Utility", which automatically manages every trade, sets Stop Loss and Take Profit levels, and closes trades according to the rules of this strategy Set files for configuring the indicator for various assets Set files for configuring Bomber Utility in the following modes: "Minimum Risk", "Balanced Risk", and "Wait-and-See Strategy" A step-by-step video manual to help you quickly install, configure, and s
Entry In The Zone and SMC Multi Timeframe is a real-time market analysis tool developed based on Smart Money Concepts (SMC). It is designed to analyze market structure, price direction, reversal points, and key zones across multiple timeframes in a systematic way. The system displays Points of Interest (POI) and real-time No Repaint signals, with instant alerts when price reaches key zones or when signals occur within those zones. It functions as both an Indicator and a Signal System (2-in-1), c
RelicusRoad Pro: Quantitative Market Operating System 70% OFF LIFETIME ACCESS (LIMITED TIME) - JOIN 2,000+ TRADERS Why do most traders fail even with "perfect" indicators? Because they trade Single Concepts in a vacuum. A signal without context is a gamble. To win consistently, you need CONFLUENCE . RelicusRoad Pro is not a simple arrow indicator. It is a complete Quantitative Market Ecosystem . It maps the "Fair Value Road" price travels on, distinguishing between random noise and true structur
CGE Trading Suite
Carl Gustav Johan Ekstrom
5 (1)
CGE Trading Suite delivers the analytical edge typically reserved for professional trading desks. The platform integrates a full suite of analytical tools into one seamless workflow: dynamic grid mapping, liquidity behavior analysis, ECM, trend lines, MIDAS, trade cycles, and directional channel projections. Together, these provide a unified view of market structure and momentum. Directional clarity is further enhanced by the capital flow index, which measures currency basket strength to identif
New Update of   Smart Trend Trading System MT5 For  2026 Market: If You Buy this Indicator you will Get my Professional Trade Manager + EA  for FREE . First of all Its worth emphasizing here that this Trading System is Non-Repainting   , Non Redrawing and Non Lagging Indicator Which makes it ideal from both manual and robot trading .  [Online course] , [manual] and [download presets] . The Smart Trend Trading System MT5 is a comprehensive trading solution tailored for new and experienced traders
FX Trend MT5 NG
Daniel Stein
5 (4)
FX Trend NG: The Next Generation Multi-Market Trend Intelligence Overview FX Trend NG is a professional multi-timeframe trend and market monitoring tool designed to give you a complete structural overview of the market in seconds. Instead of switching between dozens of charts, you instantly see which symbols are trending, where momentum is fading, and where strong alignment exists across timeframes. Launch Offer – Get FX Trend NG for $30 (6 Months) or $80 Lifetime . Already part of the Stein I
Power Candles MT5
Daniel Stein
5 (6)
Power Candles – Strength-Based Entry Signals for Any Market Power Candles brings Stein Investments’ proven strength analysis directly onto your price chart. Instead of reacting to price alone, each candle is colored based on real market strength, allowing you to instantly identify momentum build-ups, strength acceleration, and clean trend transitions. One Logic for All Markets Power Candles works automatically on all trading symbols . The indicator detects whether the current symbol is a Forex p
Meridian Pro
Ottaviano De Cicco
5 (1)
Meridian Pro: Professional Multi-Timeframe Trend Matrix for MT5 Overview Meridian Pro is a multi-timeframe trend matrix by Merkava Labs that compresses directional state, strength, momentum condition and matrix agreement into one compact panel. One adaptive engine, applied consistently from M1 to W1. No per-symbol tuning. No indicator stacking. One structured readout across every asset and every timeframe. Launch Offer — Get Meridian Pro for USD 99 (introductory). Regular price: USD 149. 1. Why
Trend Screener Pro MT5
STE S.S.COMPANY
4.84 (103)
Trend Screener Indicator --Professional Trend Trading & Market Scanning System for MetaTrader Unlock the true power of trend trading with Trend Screener Indicator — a complete multi-currency, multi-timeframe trend analysis solution powered by Fuzzy Logic,Trend Pulse Technology  and advanced market structure algorithms.   Trend Screener transforms your MetaTrader platform into a professional-grade Trend Analyzer and Market Scanner, helping you identify high-probability trend opportunities, early
[ My Products ] , [ My Channel ]  , [ LIVE SIGNAL ] HFT Spike Detector HFT Spike Detector is a professional tick monitoring tool designed to analyze and measure high-frequency price movements (sudden spikes caused by HFT) in real time. Its purpose is to enable you to detect abnormal slippage, liquidity gaps, and millisecond-level price spikes caused by the broker using numerical data. Because it analyzes real-time tick flow and execution conditions, it cannot be accurately evaluated in backt
Atomic Analyst MT5
Issam Kassas
3.94 (31)
New Update of   Atomic Analyst MT5 For  2026 Market: If You Buy this Indicator you will Get my Professional   Trade Manager + EA  for   FREE . First of all Its worth emphasizing here that this Trading Indicator is   Non-Repainting   , Non Redrawing and Non Lagging Indicator   Indicator, Which makes it ideal from both manual and robot trading.  User manual: settings, inputs and strategy . The Atomic Analyst  is a PA Price Action Indicator that uses Strength and Momentum of the price to find a bet
Market makers' tool. Meravith will: Analyze all timeframes and display the current trend in force. Highlight liquidity zones (volume equilibrium) where bullish and bearish volumes are equal. Display all liquidity levels across different timeframes directly on your chart. Generate and present text-based market analysis for your reference. Calculate targets, support levels, and stop-loss points based on the current trend. Compute the risk/reward ratio for your trades. Determine position size accor
OmniSync Projection
Antonio-alin Teculescu
5 (1)
Chronos Fractal Engine is an innovative price projection indicator for MetaTrader 5, designed to transform your technical analysis by intelligently identifying and projecting historical price patterns. Built upon an advanced correlation algorithm and the fractal principles of the market, this powerful tool visualizes potential future price movements, giving you a unique edge in your trading decisions. What is Chronos Fractal Engine? At its core, the Chronos Fractal Engine employs a sophisticat
ARICoins
Temirlan Kdyrkhan
ARICoin is a powerful trading companion designed to generate high-probability entry signals with dynamic TP/SL/DP levels based on volatility. Built-in performance tracking shows win/loss stats, PP1/PP2 hits, and success rates all updated live. Key Features: Buy/Sell signals with adaptive volatility bands Real-time TP/SL/DP levels based on ATR Built-in MA Filter with optional ATR/StdDev volatility Performance stats panel (Success, Profit/Loss, PP1/PP2) Alerts via popup, sound, push, or email Cust
Quantum TrendPulse
Bogdan Ion Puscasu
5 (22)
Introducing Quantum TrendPulse , the ultimate trading tool that combines the power of SuperTrend , RSI , and Stochastic into one comprehensive indicator to maximize your trading potential. Designed for traders who seek precision and efficiency, this indicator helps you identify market trends, momentum shifts, and optimal entry and exit points with confidence. Key Features: SuperTrend Integration: Easily follow the prevailing market trend and ride the wave of profitability. RSI Precision: Detect
Currency Strength Dashboard Pro Professional real-time currency strength analysis dashboard for MetaTrader 5 . The indicator calculates and displays the strength of 8 major currencies (EUR, USD, GBP, JPY, CHF, AUD, CAD, NZD) across 28 currency pairs simultaneously on multiple timeframes. The dashboard gives traders a complete market overview at a glance — without unnecessary calculations or switching between charts. Calculation Method The indicator is based on an advanced mathematical currency s
Grabber System MT5
Ihor Otkydach
4.83 (23)
Let me introduce you to an excellent technical indicator – Grabber, which works as a ready-to-use "All-Inclusive" trading strategy. Within a single code, it integrates powerful tools for technical market analysis, trading signals (arrows), alert functions, and push notifications. Every buyer of this indicator also receives the following for free: Grabber Utility for automatic management of open orders Step-by-step video guide: how to install, configure, and trade with the indicator Custom set fi
Introducing   Quantum Breakout PRO , the groundbreaking MQL5 Indicator that's transforming the way you trade Breakout Zones! Developed by a team of experienced traders with trading experience of over 13 years,   Quantum Breakout PRO   is designed to propel your trading journey to new heights with its innovative and dynamic breakout zone strategy. Quantum Breakout Indicator will give you signal arrows on breakout zones with 5 profit target zones and stop loss suggestion based on the breakout b
FX Power MT5 NG
Daniel Stein
5 (31)
FX Power: Analyze Currency Strength for Smarter Trading Decisions Overview FX Power is your go-to tool for understanding the real strength of currencies and Gold in any market condition. By identifying strong currencies to buy and weak ones to sell, FX Power simplifies trading decisions and uncovers high-probability opportunities. Whether you’re looking to follow trends or anticipate reversals using extreme delta values, this tool adapts seamlessly to your trading style. Don’t just trade—trade
Bill Williams Advanced
Siarhei Vashchylka
5 (11)
Bill Williams Advanced is designed for automatic chart analysis using Bill Williams' "Profitunity" system. The indicator analyzes four timeframes at once. Manual (Be sure to read before purchasing) Advantages 1. Analyzes the chart using Bill Williams' "Profitunity" system. Signals are displayed in a table in the corner of the screen and on the price chart. 2. Finds all known AO and AC signals, as well as zone signals. Equipped with a trend filter based on the Alligator. 3. Finds "Divergence Bar
Advanced Supply Demand MT5
Bernhard Schweigert
4.53 (15)
Best Solution for any Newbie or Expert Trader! This indicator is a unique, high quality and affordable trading tool because we have incorporated a number of proprietary features and a new formula. With this update, you will be able to show double timeframe zones. You will not only be able to show a higher TF but to show both, the chart TF, PLUS the higher TF: SHOWING NESTED ZONES. All Supply Demand traders will love it. :) Important Information Revealed Maximize the potential of Advanced Supply
RFI levels PRO MT5
Roman Podpora
3.67 (3)
The indicator accurately shows the reversal points and price return zones where the   Major players . You see where new trends are forming and make decisions with maximum precision, maintaining control over every trade. VERSION MT4     -    Reveals its maximum potential when combined with the   TREND LINES PRO   indicator What the indicator shows: Reversal structures and reversal levels with activation at the beginning of a new trend. Display of   TAKE PROFIT   and   STOP LOSS   levels with min
Market Structure Order Block Dashboard MT5 is an MT5 indicator focused on Market Structure and ICT / Smart Money Concepts: HH/HL/LH/LL , BOS , ChoCH , plus Order Blocks , Fair Value Gaps (FVG) , Liquidity (EQH/EQL, sweeps), Sessions / Kill Zones , and an integrated Volume Profile with a compact confluence dashboard. Important: This is an analysis tool . It does not execute trades (not an EA). Buyer Bonus After purchase, you can receive 2 bonus indicators (your choice) from my store. How to clai
Market Structure Patterns
Samuel Manoel De Souza
4.47 (19)
Available for   MT4   and   MT5 . Join the Market Structure Patterns channel to download materials available for study and/or additional informations. Related posts: Market Structure Patterns - Introduction Beyond Fancy Order Blocks: Using True Volumetric Analysis with Market Structure Patterns & Timeless Charts Market Structure Patterns   is an indicator based on   smart money concepts   that displays   SMC/ICT   elements that can take your trading decisions to the next level. Take advantage
Crystal Heikin Ashi Signals
Muhammad Jawad Shabir
5 (1)
Crystal Heikin Ashi Signals - Professional Trend & Signal Detection Indicator Advanced Heikin Ashi Visualization with Intelligent Signal System for Manual & Automated Trading Final Price: $149 ---------> Price goes up $10 after every 10 sales . Limited slots available — act fast . Overview Crystal Heikin Ashi Signals is a professional-grade MetaTrader 5 indicator that combines pure Heikin Ashi candle visualization with an advanced momentum-shift detection system. Designed for both manual traders
See which strategy actually works on your symbol - before you risk real money. Power Bar detects extreme price bars on any symbol and any timeframe, then instantly backtests 3 different trading strategies so you can compare win rates, profit factors, and P&L side by side. All in a single interactive panel. No guessing. No curve-fitting. Just data. What makes Power Bar unique? Most indicators give you a signal and leave you guessing whether it works. Power Bar goes further: it tests every signal
Smart Stop Indicator – Intelligent Stop-Loss Precision Directly on Your Chart Overview The Smart Stop Indicator is the tailored solution for traders who want to place their stop loss clearly and methodically instead of guessing or relying on gut feeling. This tool combines classic price-action logic (higher highs, lower lows) with modern breakout recognition to identify where the next logical stop level truly is. Whether in trending markets, ranges, or fast breakout phases, the indicator displ
Gann Made Easy   is a professional and easy to use Forex trading system which is based on the best principles of trading using the theory of W.D. Gann. The indicator provides accurate BUY and SELL signals including Stop Loss and Take Profit levels. You can trade even on the go using PUSH notifications. PLEASE CONTACT ME AFTER PURCHASE TO GET TRADING  INSTRUCTIONS   AND GREAT EXTRA INDICATORS   FOR FREE! Probably you already   heard   about the Gann trading methods before. Usually the Gann theory
More from author
Zigzag indicator
Aleksandr Puchkin
The indicator works with two time periods, has a visual display of waves directly on the working chart and displays horizontal wave levels. The ZigZag indicator connects significant tops and bottoms on the price chart with visible sloping lines that make it easier to perceive the wave movement and divides the waves into ranges by levels. Extremums are calculated by High \ Low prices or by Closing prices. Wave levels are projected onto the next wave, which allows you to get support / resistance l
Deal Calculator
Aleksandr Puchkin
The trading calculator allows you to calculate the parameters of a deal before opening it and get the values of the margin, deal volume and risk, which allows you to fairly accurately evaluate the deal both in terms of possible loss and profit. It also displays the calculation method for the current instrument, profit currency, conversion rate, base currency, Equity size, position volume, risk in percent, Stop Loss and Take Profit sizes (in points, money and percentage), Stop Loss size ratio to
Filter:
No reviews
Reply to review