Supertrend MetaTrader 5

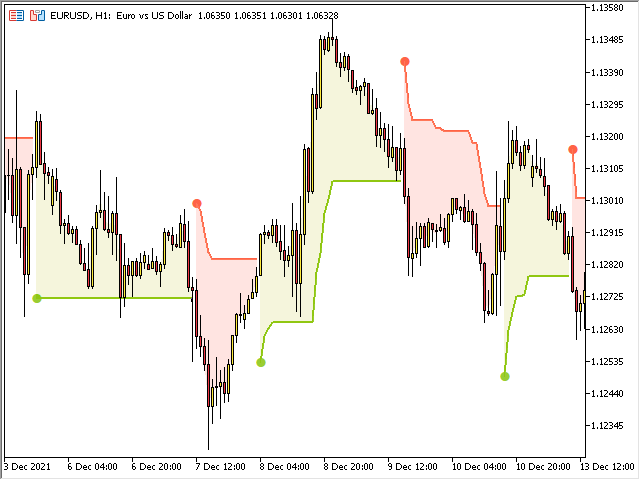
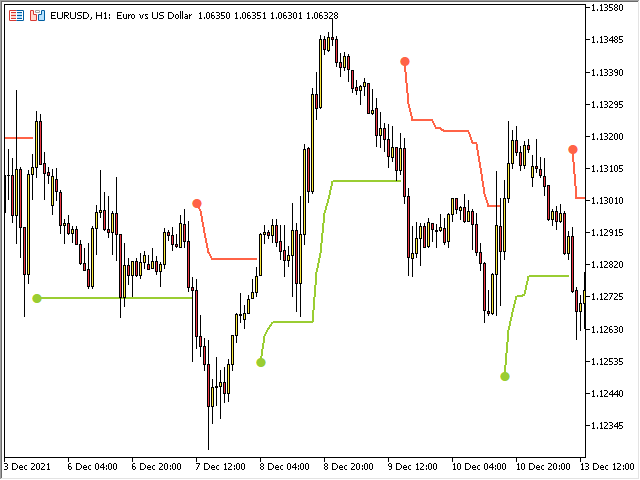
The 'Supertrend MetaTrader 5' indicator is the basis of the simplest trend trading system. And yet it remains very effective. The indicator works on any timeframe (on the timeframe of the current chart). From the name you can see that this indicator follows the trend, and when the trend changes, the indicator accurately shows the point of the trend change. The basis of 'Supertrend MetaTrader 5' is comparing price and 'Average True Range indicator' values multiplied by a multiplier (there is also an option to use 'Moving Average' calculated based on 'True Range' instead of 'ATR').

The indicator shows the best results in trending market areas and with parameters 10 and 3 ('ATR Period' is equal to 10 and 'ATR Multiplier' is equal to 3). On the D1 timeframe, it is recommended to use confirming indicators.

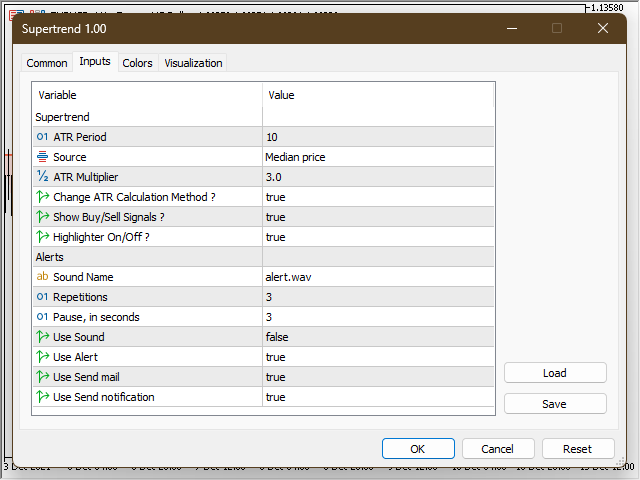
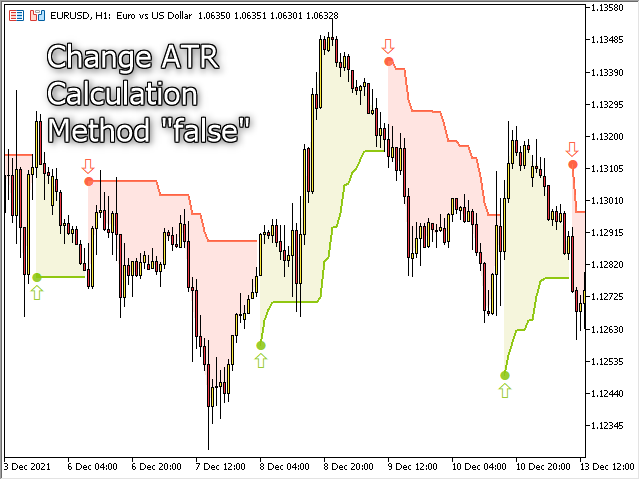
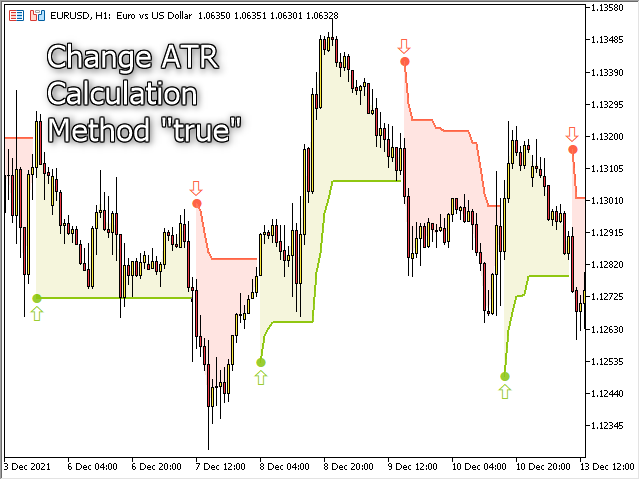
In the parameters, you can set the indicator type to 'ATR' or 'Moving Average' (the 'Change ATR Calculation Method ?' parameter is responsible for this), you can enable/disable the 'Buy' and 'Sell' signal arrows (the 'Show Buy/Sell Signals ? ') and you can enable/disable trend fill (parameter 'Highlighter On/Off ?').

Also, in the "Alerts" block, you can set up alerts about the appearance of signals (ATTENTION! the indicator is actively working on the current bar and therefore the signal on the current bar can either appear or disappear).


Recommended products
Follow The Line MT5
Oliver Gideon Amofa Appiah
4.6 (35)
This indicator obeys the popular maxim that: "THE TREND IS YOUR FRIEND" It paints a GREEN line for BUY and also paints a RED line for SELL. (you can change the colors). It gives alarms and alerts of all kinds. IT DOES NOT REPAINT and can be used for all currency pairs and timeframes. Yes, as easy and simple as that. Even a newbie can use it to make great and reliable trades. NB: For best results, get my other premium indicators for more powerful and reliable signals. Get them here: https://www.m
FREE
Important Lines
Terence Gronowski
4.88 (24)
This indicator displays Pivot-Lines, preday high and low, preday close and the minimum and maximum of the previous hour. You just have to put this single indicator to the chart to have all these important lines, no need to setup many single indicators. Why certain lines are important Preday high and low : These are watched by traders who trade in a daily chart. Very often, if price climbs over or falls under a preday low/high there is an acceleration in buying/selling. It is a breakout out of a
FREE
Donchian Breakout And Rsi
Mattia Impicciatore
4.5 (2)
General Description This indicator is an enhanced version of the classic Donchian Channel , upgraded with practical trading functions. In addition to the standard three lines (high, low, and middle), the system detects breakouts and displays them visually with arrows on the chart, showing only the line opposite to the current trend direction for a cleaner view. The indicator includes: Visual signals : colored arrows on breakout Automatic notifications : popup, push, and email RSI filter : to val
FREE
Are you tired of drawing trendlines every time you're analyzing charts? Or perhaps you would like more consistency in your technical analysis. Then this is for you. This indicator will draw trend lines automatically when dropped on a chart. How it works Works similar to standard deviation channel found on mt4 and mt5. It has 2 parameters: 1. Starting Bar 2. Number of bars for calculation The   starting bar   is the bar which drawing of the trend lines will begin, while the   number of bars for c
FREE
Magic 7 Indicator
Marek Pawel Szczesny
5 (1)
Overview Magic 7 Indicator is a comprehensive MetaTrader 5 (MQL5) indicator that identifies seven different trading scenarios based on candlestick patterns and technical analysis. The indicator combines traditional price action patterns with modern concepts like Fair Value Gaps (FVG) to provide trading signals with precise entry points and stop loss levels. Features 7 Trading Scenarios : Each scenario identifies specific market conditions and trading opportunities Visual Signals : Clear buy/sell
FREE
Rainbow MT5
Jamal El Alama
4 (1)
Description : Rainbow MT5 is a technical indicator based on Moving Average with period 34 and very easy to use. When price crosses above MA and MA changes color to green, then this is a signal to buy. When price crosses below MA and MA changes color to red, then this is a signal to sell. The Expert advisor ( Rainbow EA MT5 ) based on Rainbow MT5 indicator is now available here . MT4 version is available here .
FREE
LT Donchian Channel
Thiago Duarte
4.86 (7)
Donchian Channel is an indicator created by Richard Donchian. It is formed by taking the highest high and the lowest low of the last specified period in candles. The area between high and low is the channel for the chosen period. Its configuration is simple. It is possible to have the average between the upper and lower lines, plus you have alerts when price hits one side. If you have any questions or find any bugs, please contact me. Enjoy!
FREE
The indicator identifies when a divergence occurs between price and an indicator or oscillator. It identifies both regular and hidden divergences. Combined with your own rules and techniques, this indicator will allow you to create (or enhance) your own powerful system. For higher probability setups I can recommend you to use my Supply Demand indicator and trade only if the divergence occurs inside a zone. Supply zone for bearish div and demand zone for bullish div. The optimal scenario is if it
FREE
Stamina HUD
Michele Todesco
STAMINA HUD – Advanced Market & Trend Dashboard (MT5) STAMINA HUD   is a professional   market information panel   designed for traders who want   clarity, speed, and control   directly on the chart. It provides a   clean heads-up display (HUD)   with essential market data and   multi-timeframe trend direction , without cluttering the chart or generating trading signals. What STAMINA HUD Shows   Current Price   Spread (in real pips)   Today High–Low range (pips)   Average D
FREE
MACD Enhanced
Nikita Berdnikov
5 (3)
Introducing the MACD  Enhanced – an advanced MACD (Moving Average Convergence Divergence) indicator that provides traders with extended capabilities for trend and momentum analysis in financial markets. The indicator uses the difference between the fast and slow exponential moving averages to determine momentum, direction, and strength of the trend, creating clear visual signals for potential entry and exit points. Attention! To achieve the best results, it is recommended to adapt the indicator
FREE
Candle Countdown — Accurate Time to Close for MT5 Candle Countdown is a simple and precise tool that shows the remaining time until the current candle closes directly on the chart. When your entry depends on the candle close, even a few seconds matter. This indicator helps you see the exact time and make decisions without rushing or guessing. An indicator for precise control over candle closing time. The indicator displays: time remaining until candle close current server time spread Stop Level
FREE
This innovative indicator for measuring the strength of currencies from INFINITY is an indispensable assistant for scalpers and traders trading for a long time. The system for analyzing the Strength / weakness of currencies has long been known and used in the market by the world's leading traders. Any arbitrage trading is not complete without this analysis. Our indicator easily determines the strength of the base currencies in relation to each other. It displays line charts for all or the curre
FREE
Enhance your trading analysis with the Haiken Ashi MT5 indicator. This powerful tool transforms standard price data into smoother, trend-following candlesticks, making it easier to identify market trends and potential reversal points.    Key Features: Clear Trend Identification: Visually distinguish between uptrends and downtrends with distinct candle colors. Reduced Noise: Filter out price fluctuations, providing a clearer view of underlying market movements. Early Trend Detection: Anticipate
FREE
Statistical Arbitrage Spread Generator for Cointegration [MT5] What is Pair Trading? Pair trading is a market-neutral strategy that looks to exploit the relative price movement between two correlated assets — instead of betting on the direction of the market. The idea? When two assets that usually move together diverge beyond a statistically significant threshold, one is likely mispriced. You sell the expensive one, buy the cheap one , and profit when they converge again. It’s a statistica
FREE
This indicator is especially for the binary trading. Time frame is 1 minutes and exp time 5 or 3 minutes only. You must be use martingale 3 step. So you must put lots size is 10 % at most. You should use Mt2 trading platform to connect with my indicator to get more signal without human working. This indicator wining rate is over 80% but you may get 100% of profit by using martingale 3 step. You should use MT2 Trading Platform to connect meta trader platform and binary platform . You can get mt2
FREE
High Low Open Close
Alexandre Borela
4.98 (44)
If you like this project, leave a 5 star review. This indicator draws the open, high, low and closing prices for the specified period and it can be adjusted for a specific timezone. These are important levels looked by many institutional and professional traders and can be useful for you to know the places where they might be more active. The available periods are: Previous Day. Previous Week. Previous Month. Previous Quarter. Previous year. Or: Current Day. Current Week. Current Month. Current
FREE
HMA Color with Alerts MT5
Pavel Zamoshnikov
4.75 (57)
Hull Moving Average (HMA) is well-deservedly popular among traders because of the effective averaging of market noise and a relatively small delay. The current MetaTrader 5 version changes its color when the movement direction changes. Sound and text signals are available. It also supports sending email and push messages. It is possible to trigger a signal on the current incomplete bar, although such a signal may be canceled before completion if conditions are no longer appropriate. One of the p
FREE
Show Pips for MT5
Roman Podpora
4.54 (28)
This information indicator will be useful for those who always want to be aware of the current situation on the account. VERSION MT 4 - More useful indicators The indicator displays data such as profit in points, percentage and currency, as well as the spread for the current pair and the time until the bar closes on the current timeframe. There are several options for placing the information line on the chart: - To the right of the price (runs behind the price); - As a comment (in the upper lef
FREE
Indicator and Expert Adviser  EA Available in the comments section of this product. Download with Indicator must have indicator installed for EA to work. Mt5 indicator alerts for bollinger band and envelope extremes occurring at the same time. Buy signal alerts occur when A bullish candle has formed below both the lower bollinger band and the lower envelope  Bar must open and close below both these indicators. Sell signal occur when A bear bar is formed above the upper bollinger band and upper
FREE
Mitimom
Danil Poletavkin
The indicator is based on Robert Miner's methodology described in his book "High probability trading strategies" and displays signals along with momentum of 2 timeframes. A Stochastic oscillator is used as a momentum indicator. The settings speak for themselves period_1 is the current timeframe, 'current' period_2 is indicated - the senior timeframe is 4 or 5 times larger than the current one. For example, if the current one is 5 minutes, then the older one will be 20 minutes The rest of the s
FREE
Donchian Channel DC is the indicator of Donchian Channels, that plots maximum and minimum values of a specific period, besides mean value line. It´s possible to configure simple period for analysis and the indicator will plot all three values. You can trade with this indicator as trend or reversal, according to each strategy. Do not let to test others indicators as soon as others expert advisors.
Free automatic Fibonacci is an indicator that automatically plots a Fibonacci retracement based on the number of bars you select on the BarsToScan setting in the indicator. The Fibonacci is automatically updated in real time as new highest and lowest values appears amongst the selected bars. You can select which level values to be displayed in the indicator settings. You can also select the color of the levels thus enabling the trader to be able to attach the indicator several times with differe
FREE
The MACD indicator in MetaTrader 5 does not look like MACD as it was designed. That is because the MetaTrader 5 version of MACD displays the MACD line as a histogram when it is traditionally displayed as a line. Additionally, the MetaTrader 5 version computes the Signal line using an SMA, while according to MACD definition it is supposed to be an EMA. The MetaTrader 5 version also does not compute a true MACD Histogram (the difference between the MACD/Signal lines). This can be confusing for peo
FREE
Indicator Description 4 Hull MA Color + Envelopes is a powerful trend-following indicator for MetaTrader 5 that combines four Hull Moving Averages (HMA) with Moving Average Envelopes to clearly identify market direction, trend strength, and potential reversal or pullback zones. This indicator is designed to reduce noise, react quickly to price movement, and provide a clean visual structure for professional trading.   Key Features   4 Hull Moving Averages (20, 50, 100, 200) Automatic color change
FREE
SMMA Bands Indicator
Elie Baptiste Granger
The SMMA Bands indicator is an advanced volatility-based trading tool that creates 6 dynamic support and resistance levels around an envelope formed by two Smoothed Moving Averages (SMMA).  This indicator combines the reliability of SMMA trend identification with the precision of standard deviation-based volatility bands, making it suitable for both trend-following and mean-reversion strategies. Every band has its own buffer for use in EA. feel free to make suggestions and add reviews , i will
FREE
Reversal Candles MT5
Nguyen Thanh Cong
4.86 (7)
Introduction Reversal Candles is a cutting-edge non-repainting   forex indicator designed to predict price reversals with remarkable accuracy through a sophisticated combination of signals. Signal Buy when the last closed candle has a darker color (customizable) and an up arrow is painted below it Sell when the last closed candle has a darker color (customizable) and a down arrow is painted above it
FREE
TradeQL
Abdiel Aviles Jimenez
The TradeQL Indicator is a customizable tool that highlights specific trading patterns on candlestick charts. Users can define patterns through TradeQL queries, which the indicator then applies to the chart, visually representing matches and captured groups. Ideal for identifying complex trade setups in real-time. TradeQL queries are specified using the TradeQL Language. See https://github.com/abdielou/tradeql for more details. This language is expressed as a regular expression. The language al
FREE
The   "Haven Key Levels PDH PDL"   indicator helps traders visualize key levels on the chart. It automatically marks the following levels: DO (Daily Open)   — the daily open level. NYM (New York Midnight)   — the New York midnight level. PDH (Previous Day High)   — the previous day's high. PDL (Previous Day Low)   — the previous day's low. WO (Weekly Open)   — the weekly open level. MO (Monthly Open)   — the monthly open level. PWH (Previous Week High)   — the previous week's high. PWL (Previou
FREE
This indicator is a zero-lag indicator and displays  strength of trend change . True Trend  Oscillator Pro works best in combination with True Trend Moving Average Pro that displays exact trend as is. Oscillator value is exact price change in given direction of the trend. True Trend Moving Average Pro: https://www.mql5.com/en/market/product/103586 If you set PERIOD input parameter to 1 this indicator becomes a sharpshooter for binary options. Developers can use True Trend Oscillator in Exper
FREE
Easy Correlations Indicator The Easy Correlations Indicator is designed to help traders analyze the relationship between two correlated instruments. By monitoring the distance between their Relative Strength Index (RSI) values, the indicator highlights situations where one instrument has moved significantly further than the other. This creates potential trading opportunities: Sell the stronger instrument (overstretched RSI) Buy the weaker instrument (lagging RSI) Because the positions are opened
FREE
Buyers of this product also purchase
SuperScalp Pro
Van Minh Nguyen
4.57 (21)
SuperScalp Pro – Advanced Multi-Filter Scalping Indicator System SuperScalp Pro is an advanced scalping indicator that combines the classic Supertrend with multiple intelligent confirmation filters to help identify trading opportunities. It works efficiently across multiple timeframes from M1 to H4, with optimized performance on XAUUSD, BTCUSD, and major Forex pairs. The indicator provides clear Buy and Sell signals, along with automatically calculated entry price, stop loss, and take profit lev
Divergence Bomber
Ihor Otkydach
4.9 (86)
Each buyer of this indicator also receives the following for free: The custom utility "Bomber Utility", which automatically manages every trade, sets Stop Loss and Take Profit levels, and closes trades according to the rules of this strategy Set files for configuring the indicator for various assets Set files for configuring Bomber Utility in the following modes: "Minimum Risk", "Balanced Risk", and "Wait-and-See Strategy" A step-by-step video manual to help you quickly install, configure, and s
Entry In The Zone and SMC Multi Timeframe is a real-time 2-in-1 market analysis tool that combines market structure analysis and a No Repaint BUY / SELL signal system into a single indicator, built on Smart Money Concepts (SMC) — a widely adopted framework used by professional traders to understand market structure. This indicator helps you see the market more clearly, make decisions based on structure rather than guesswork, and focus on high-probability zones where price is more likely to react
Azimuth Pro
Ottaviano De Cicco
5 (6)
Azimuth Pro V2: Synthetic Fractal Structure and Confirmed Entries for MT5 Overview Azimuth Pro is a multi-level swing structure indicator by Merkava Labs . Four nested swing layers, swing-anchored VWAP, ABC pattern detection, three-timeframe structural filtering, and closed-bar confirmed entries — one chart, one workflow from micro-swings to macro-cycles. This is not a blind signal product. It is a structure-first workflow for traders who care about location, context, and timing. V2 Launch Offe
Quantum TrendPulse
Bogdan Ion Puscasu
5 (23)
Introducing Quantum TrendPulse , the ultimate trading tool that combines the power of SuperTrend , RSI , and Stochastic into one comprehensive indicator to maximize your trading potential. Designed for traders who seek precision and efficiency, this indicator helps you identify market trends, momentum shifts, and optimal entry and exit points with confidence. Key Features: SuperTrend Integration: Easily follow the prevailing market trend and ride the wave of profitability. RSI Precision: Detect
New Update of   Smart Trend Trading System MT5 For  2026 Market: If You Buy this Indicator you will Get my Professional Trade Manager + EA  for FREE . First of all Its worth emphasizing here that this Trading System is Non-Repainting   , Non Redrawing and Non Lagging Indicator Which makes it ideal from both manual and robot trading .  [Online course] , [manual] and [download presets] . The Smart Trend Trading System MT5 is a comprehensive trading solution tailored for new and experienced traders
Power Candles MT5
Daniel Stein
4.75 (8)
Power Candles – Strength-Based Entry Signals for Any Market Power Candles brings Stein Investments’ proven strength analysis directly onto your price chart. Instead of reacting to price alone, each candle is colored based on real market strength, allowing you to instantly identify momentum build-ups, strength acceleration, and clean trend transitions. This tool is part of the Stein Investments ecosystem.  Browse all 18 tools, get AI-powered setup recommendations,  and join the community at http
OmniSync Projection
Antonio-alin Teculescu
5 (1)
Chronos Fractal Engine is an innovative price projection indicator for MetaTrader 5, designed to transform your technical analysis by intelligently identifying and projecting historical price patterns. Built upon an advanced correlation algorithm and the fractal principles of the market, this powerful tool visualizes potential future price movements, giving you a unique edge in your trading decisions. What is Chronos Fractal Engine? At its core, the Chronos Fractal Engine employs a sophisticat
FX Trend MT5 NG
Daniel Stein
5 (4)
FX Trend NG: The Next Generation Multi-Market Trend Intelligence Overview FX Trend NG is a professional multi-timeframe trend and market monitoring tool designed to give you a complete structural overview of the market in seconds. Instead of switching between dozens of charts, you instantly see which symbols are trending, where momentum is fading, and where strong alignment exists across timeframes. This tool is part of the Stein Investments ecosystem.  Browse all 18 tools, get AI-powered set
Gann Made Easy   is a professional and easy to use Forex trading system which is based on the best principles of trading using the theory of W.D. Gann. The indicator provides accurate BUY and SELL signals including Stop Loss and Take Profit levels. You can trade even on the go using PUSH notifications. PLEASE CONTACT ME AFTER PURCHASE TO GET TRADING  INSTRUCTIONS   AND GREAT EXTRA INDICATORS   FOR FREE! Probably you already   heard   about the Gann trading methods before. Usually the Gann theory
Introducing   Quantum Breakout PRO , the groundbreaking MQL5 Indicator that's transforming the way you trade Breakout Zones! Developed by a team of experienced traders with trading experience of over 13 years,   Quantum Breakout PRO   is designed to propel your trading journey to new heights with its innovative and dynamic breakout zone strategy. Quantum Breakout Indicator will give you signal arrows on breakout zones with 5 profit target zones and stop loss suggestion based on the breakout b
CGE Trading Suite
Carl Gustav Johan Ekstrom
5 (2)
Institutional-Grade Analytics for MT5 C GE Trading Suite delivers the analytical edge typically reserved for professional trading desks. The platform integrates a full suite of analytical tools into one seamless workflow: dynamic grid mapping, liquidity behavior analysis, ECM, trend lines, MIDAS, trade cycles, and directional channel projections. Together, these provide a unified view of market structure and momentum. Directional clarity is further enhanced by the capital flow index, which meas
Let's be honest first. No indicator will make you profitable on its own. If someone tells you otherwise, they're selling you a dream. Every indicator that shows perfect buy/sell arrows can be made to look flawless — just zoom into the right window of history and screenshot the winners. We won't do that. SMC Intraday Formula is a tool. It reads the market structure for you, maps the highest-probability price zones, and tells you exactly what the smart money footprint looks like right now — in pl
See which strategy actually works on your symbol - before you risk real money. Power Bar detects extreme price bars on any symbol and any timeframe, then instantly backtests 3 different trading strategies so you can compare win rates, profit factors, and P&L side by side. All in a single interactive panel. No guessing. No curve-fitting. Just data. This tool is part of the Stein Investments ecosystem.  Browse all 18 tools, get AI-powered setup recommendations,  and join the community at https://
Grabber System MT5
Ihor Otkydach
4.83 (23)
Let me introduce you to an excellent technical indicator – Grabber, which works as a ready-to-use "All-Inclusive" trading strategy. Within a single code, it integrates powerful tools for technical market analysis, trading signals (arrows), alert functions, and push notifications. Every buyer of this indicator also receives the following for free: Grabber Utility for automatic management of open orders Step-by-step video guide: how to install, configure, and trade with the indicator Custom set fi
Atomic Analyst MT5
Issam Kassas
3.94 (31)
New Update of   Atomic Analyst MT5 For  2026 Market: If You Buy this Indicator you will Get my Professional   Trade Manager + EA  for   FREE . First of all Its worth emphasizing here that this Trading Indicator is   Non-Repainting   , Non Redrawing and Non Lagging Indicator   Indicator, Which makes it ideal from both manual and robot trading.  User manual: settings, inputs and strategy . The Atomic Analyst  is a PA Price Action Indicator that uses Strength and Momentum of the price to find a bet
FX Power MT5 NG
Daniel Stein
5 (31)
FX Power: Analyze Currency Strength for Smarter Trading Decisions Overview FX Power is your go-to tool for understanding the real strength of currencies and Gold in any market condition. By identifying strong currencies to buy and weak ones to sell, FX Power simplifies trading decisions and uncovers high-probability opportunities. Whether you’re looking to follow trends or anticipate reversals using extreme delta values, this tool adapts seamlessly to your trading style. Don’t just trade—trade
Bill Williams Advanced
Siarhei Vashchylka
5 (11)
Bill Williams Advanced is designed for automatic chart analysis using Bill Williams' "Profitunity" system. The indicator analyzes four timeframes at once. Manual (Be sure to read before purchasing) Advantages 1. Analyzes the chart using Bill Williams' "Profitunity" system. Signals are displayed in a table in the corner of the screen and on the price chart. 2. Finds all known AO and AC signals, as well as zone signals. Equipped with a trend filter based on the Alligator. 3. Finds "Divergence Bar
Trend Screener Pro MT5
STE S.S.COMPANY
4.85 (104)
Trend Screener Indicator --Professional Trend Trading & Market Scanning System for MetaTrader Unlock the true power of trend trading with Trend Screener Indicator — a complete multi-currency, multi-timeframe trend analysis solution powered by Fuzzy Logic,Trend Pulse Technology  and advanced market structure algorithms.   Trend Screener transforms your MetaTrader platform into a professional-grade Trend Analyzer and Market Scanner, helping you identify high-probability trend opportunities, early
Btmm state engine pro
Garry James Goodchild
5 (4)
BTMM State Engine Pro is a MetaTrader 5 indicator for traders who use the Beat The Market Maker approach: Asian session context, kill zone timing, level progression, peak formation detection, and a multi-pair scanner from a single chart. It combines cycle state logic with a built-in scanner dashboard so you do not need the same tool on many charts at once. What it does Draws the Asian session range; session times can follow broker server offset or be set in inputs. Tracks level progression (L
SignalTech MT5 is a trading system for EURUSD, USDCHF, USDJPY, AUDUSD, NZDUSD, EURJPY, AUDJPY, NZDJPY, CADJPY H2 and H3 Timeframe.  It can generate signals with Buy/Sell Arrows and Pop-Up/Sound Alerts. Each signal has clear Entry and Stop Loss levels, which should be automatically flagged on the chart, as well as potential Targets 1, 2, and 3. The Entry and TP levels are fixed after the trade is taken. The exit level is dynamic. If there are signs of a potential short-term trend reversal, the
Crystal Heikin Ashi Signals
Muhammad Jawad Shabir
5 (2)
Crystal Heikin Ashi Signals - Professional Trend & Signal Detection Indicator Advanced Heikin Ashi Visualization with Intelligent Signal System for Manual & Automated Trading Final Price: $149 ---------> Price goes up $10 after every 10 sales . Limited slots available — act fast . Overview Crystal Heikin Ashi Signals is a professional-grade MetaTrader 5 indicator that combines pure Heikin Ashi candle visualization with an advanced momentum-shift detection system. Designed for both manual traders
Berma Bands
Muhammad Elbermawi
5 (8)
The Berma Bands (BBs) indicator is a valuable tool for traders seeking to identify and capitalize on market trends. By analyzing the relationship between the price and the BBs, traders can discern whether a market is in a trending or ranging phase. Visit the [ Berma Home Blog ] to know more. Berma Bands are composed of three distinct lines: the Upper Berma Band, the Middle Berma Band, and the Lower Berma Band. These lines are plotted around the price, creating a visual representation of the pric
Meridian Pro
Ottaviano De Cicco
5 (1)
Meridian Pro: Professional Multi-Timeframe Trend Matrix for MT5 Overview Meridian Pro is a multi-timeframe trend matrix by Merkava Labs that compresses directional state, strength, momentum condition and matrix agreement into one compact panel. One adaptive engine, applied consistently from M1 to W1. No per-symbol tuning. No indicator stacking. One structured readout across every asset and every timeframe. Launch Offer — Get Meridian Pro for USD 99 (introductory). Regular price: USD 149. 1. Why
Auto Optimized Parabolic RSI: Advanced 3D Momentum Engine Most retail indicators fail because they rely on static inputs that break the moment market volatility shifts. Auto Optimized Parabolic RSI solves the problem of "indicator decay" by continuously recalculating its own mathematical edge, bringing institutional-grade quantitative adaptation directly to your MT5 terminal. The Core Advantage: Custom In-Memory 3D Optimization Standard auto-optimizers often freeze the MT5 platform because they
ARICoins
Temirlan Kdyrkhan
ARICoin is a powerful trading companion designed to generate high-probability entry signals with dynamic TP/SL/DP levels based on volatility. Built-in performance tracking shows win/loss stats, PP1/PP2 hits, and success rates all updated live. Key Features: Buy/Sell signals with adaptive volatility bands Real-time TP/SL/DP levels based on ATR Built-in MA Filter with optional ATR/StdDev volatility Performance stats panel (Success, Profit/Loss, PP1/PP2) Alerts via popup, sound, push, or email Cust
IX Power MT5
Daniel Stein
4.92 (13)
IX Power: Unlock Market Insights for Indices, Commodities, Cryptos, and Forex Overview IX Power is a versatile tool designed to analyze the strength of indices, commodities, cryptocurrencies, and forex symbols. While FX Power offers the highest precision for forex pairs by leveraging all available currency pair data, IX Power focuses exclusively on the underlying symbol’s market data. This makes IX Power an excellent choice for non-forex markets and a reliable option for forex charts when deta
Meravith Scanner
Ivan Stefanov
5 (1)
MERAVITH SCANNER is a professional financial market indicator for MetaTrader 5 that consolidates multiple analytical tools into one integrated system. It performs all calculations automatically using a proprietary volume-weighted average price methodology, eliminating subjective interpretation entirely. This indicator contains features that may not supported by the MetaTrader current testing environment The indicator works on all asset classes (Forex, Stocks, Indices, Commodities, Cryptocurrenc
Market Structure Patterns
Samuel Manoel De Souza
4.47 (19)
Available for   MT4   and   MT5 . Join the Market Structure Patterns channel to download materials available for study and/or additional informations. Related posts: Market Structure Patterns - Introduction Beyond Fancy Order Blocks: Using True Volumetric Analysis with Market Structure Patterns & Timeless Charts Market Structure Patterns – Complete SMC Indicator Guide (Concepts + Settings) Market Structure Patterns   is an indicator based on   smart money concepts   that displays   SMC/ICT   e
FX Levels MT5
Daniel Stein
5 (13)
FX Levels: Exceptionally Accurate Support & Resistance for All Markets Quick Overview Looking for a reliable way to pinpoint support and resistance levels across any market—currencies, indices, stocks, or commodities? FX Levels merges our traditional “Lighthouse” method with a forward-thinking dynamic approach, offering near-universal accuracy. By drawing from real-world broker experience and automated daily plus real-time updates, FX Levels helps you identify reversal points, set profit targe
More from author
Description   : The "Market Structure HH HL LH LL" indicator is a powerful and at the same time simple tool for analyzing price dynamics in financial markets. This indicator helps traders and investors identify changes in trends and identify important points in price time series. Displays "BOS" and "CHoCH" lines. Key components of the indicator: HH (Higher High): The top at which the price closes above the previous high top. HH indicates a strengthening uptrend. HL (Higher Low): The minimum
Three TimeFrames
Vladimir Karputov
Three TimeFrames indicator-panel. The indicator is made in the form of a panel based on the CAppDialog class. The panel can be minimized or moved around the current chart using the mouse. The indicator shows three timeframes of the current symbol in the panel. In the current version, the indicator has a minimum number of settings - these are the parameters of three timeframes: "Younger timeframe", "   Middle   timeframe   " and "   Older   timeframe   ". When launched, the indicator-panel autom
The indicator shows bullish and bearish divergence. The indicator itself (like regular stochastic) is displayed in a subwindow. Graphical interface   : In the main window, graphical objects “trend line” are created - produced from the “Low” price to the “Low” price (for bullish divergence) and produced from the “High” price to the “High” price (for bearish divergence). The indicator draws in its window exclusively using graphic buffers: “Main”, “Signal”, “Dot”, “Buy” and “Sell”. The "Buy" and "
Ma Dema Alert
Vladimir Karputov
The indicator displays three lines and monitors two types of intersections. Three lines of the indicator: "   MA   " - slow indicator "Moving Average", "   DEMA Slow   " - slow indicator "   Double Exponential Moving Average" and "   DEMA Fast   " - fast indicator "Double Exponential Moving Average". Two types of intersections       : "   Alert Price MA   " - the price crosses the   "MA" line and   "   Alert DEMA DEMA   " - the lines cross       "DEMA Slow" and   "DEMA Fast   ". When crossing,
The Candle Length Indicator Alarm generates a sound alert, sends a push notification and an email when the size of the current candlestick changes. The size of the current candlestick can be measured in two ways: The first method: the size of the candlestick is measured from the beginning of the candlestick (from the OPEN price). The second method: the size of the candlestick is measured from current price. The indicator has the following settings: sound — a sound file from the folder: "...\Meta
The Buy Sell Color Background indicator changes the background color depending on position direction. It has three settings: Background color for BUY - background color for a Buy position Background color for SELL - background color for a Sell position Default background color - background color with no open position After you detach the indicator from a chart, its background color changes to Default background color .
The calculator of signals operates directly from the MetaTrader 5 terminal, which is a serious advantage, since the terminal provides a preliminary selection and sorts out signals. This way, users can see in the terminal only the signals that ensure a maximum compatibility with their trading accounts. The calculator of signals gives the answer to the one of the questions most frequently asked by users of the Signals service: "Will I be able to subscribe to the signal NNN, and what volume of the
Arrow Signal
Vladimir Karputov
This indicator belongs to the "Stochastic" category. I tried to simplify the control of the indicator as much as possible, so the minimum settings are shown in the input parameters: this is the choice of an icon for the signal arrows. The "Buy" signal is encoded with the ' Buy Arrow code ' parameter, and the "Sell" signal is encoded with the ' Sell Arrow code ' parameter. Signal arrow codes for signals (please use values ​​from 32 to 255) are taken from the Wingdings font. The indicator works on
Arrow Signal EA
Vladimir Karputov
An Expert Advisor based on the custom indicator. Search for a signal at every tick. Positions are closed by an opposite signal. No trailing. There is no stop loss. There is no take profit. Has a minimum of settings Money management: Lot OR Risk   - type Money management The value for "Money management"   - Money management value Deviation   - admissible slippage Buy Arrow code   (font Wingdings) - character code from 'Wingdings' font for BUY signals Sell Arrow code   (font Wingdings) - characte
The trend indicator "   Super Trend Flexible Alert   " has a minimum of settings. This indicator is designed to be as easy to use as possible. The indicator shows the trend with a main colored line ("SuperTrend" line, which you can see in the "Data Windows" window). Also, in places where the trend changes, the indicator shows colored arrows (   "STBuy" and "   STSell" icons, which you can see in the "Data Windows" window       ). In places where the trend changes, the indicator doesn't give a s
This Expert Advisor belongs to the class of utilities for manual and semi-automatic trading. The "   Pending order at the extremums of the day   " EA places two pending orders at the extremums of the previous day. Parameter "   Pending Orders: ...       " allows you to select the type of pending orders: "   Buy Stop and Sell Stop   " or "   Buy Limit and Sell Limit   "   .       extremum       'Low' offset is made downwards). "   New pending -> delete previous ones   " set to "   true   " will f
The "Panel Partial Closure" utility-panel is intended for quick partial closing of a position that has a profit. It has only two parameters: "   Partial closure #1   " and "   Partial closure #2   ". Works for any symbol and for any 'Magic number' - that is, the utility is primarily intended for manual trading. How it works: For example, you have several positions on "EURUSD", "Jump 100 Index" and "XAUUSD" (gold). The utility finds the position with the largest profit - in the screenshot, this
MQL5 "Daily resistance and support" indicator - draws daily support and resistance lines. Drawing is carried out only with the help of graphical objects (trend lines) - indicator buffers are not used in this indicator. The indicator has no settings - the search for levels is carried out on the last 500 bars from the "D1" timeframe and this parameter is hardwired inside the code. Manual trading: When trading manually, this indicator is recommended to be used on timeframes from "M10" to "H1". It
Multi Symbol Trailing
Vladimir Karputov
5 (1)
The "   Multi Symbol Trailing   " utility moves Stop Loss for all positions that are currently open (multi-symbol trailing). It is intended primarily to assist in manual trading. There are no restrictions for the utility either by the name of the currency pair or by the individual identifier (Magic number) - the utility processes absolutely all positions that are currently open. The unit of measurement for the "   Trailing Stop   " and "   Trailing Step   " parameters is points (the difference
The trend indicator "Trend Two Moving Average" uses two types of Arrow to display calculation results - these are "Trend UP" and "Trend DN".       Arrows "Trend Up"       are drawn       By       price       'Low'       bar   ,       A       Arrows "Trend DN" -       By       price       'high'. The trend search algorithm is based on the analysis of the price of a bar and the values of two 'Moving Average' indicators. The trend direction is calculated on the current (zero) bar. Therefore, it is
The "   Market Session Times   " indicator shows the time of four trading sessions: Asia, Europe, America and Pacific. The time of trading sessions is set   in the format       GMT and thus does not depend on the trading server at all. The following data is used: Trading Session City GMT Asia Tokyo Singapore Shanghai 00:00−06:00 01:00−09:00 01:30−07:00 Europe London Frankfurt 07:00−15:30 07:00−15:30 America New York Chicago 13:30−20:00 13:30−20:00 Pacific Wellington Sydney 20:00−02:45 22:00−0
Constant stream
Vladimir Karputov
Trading system for a variety of trading transactions. Allows you to set the balance to wander around zero - used for specific rebate tasks or similar. Configured to work with hedging   accounts.   There cannot be more than one position in the market   . One general setting, the "   Step, Stop Loss, Take Profit   " parameter is measured in points (example for EURUSD: 1.00055-1.00045 = 10 points). The advisor stops trading (while remaining on the chart) if, when   placing a position, it encounters
The indicator shows Fractals from the higher timeframe. It is possible to display two types of Fractals: 'Regular Fractal' and 'BW Fractal'. Consider the formation of the Fractal 'UP'. 'Regular Fractal' is a very strict Fractal in which each subsequent 'high' price (to the left and right of the central bar) is smaller. Whereas in 'BW Fractal' there is only one condition: the central bar (its price 'high') must be the highest. Visually, the difference between these two modes can be seen in diagr
AI Support Resistance This is an indicator that searches for the “Support” and “Resistance” lines. The search is carried out using an algorithm for numerical analysis and data processing. There are three search options available (“mode #1”, “mode #2” and “mode #3”). Each of these options differs in its internal algorithm (at the moment these are completely internal settings, they are not available to the user). We can say that these options differ in the severity of the search. Limitation: At t
Open Time Manager
Vladimir Karputov
The " Open Time Manager " utility opens a position at a specified time and then turns on classic trailing. Time (' Hour ':' Minute ') is always set in the GMT time zone with a GMT Ofset offset. It is possible to select three options for opening a position using the ' Trade mode ' parameter: ' BUY ' ' SELL ' ‘ BUY and SELL (simultaneously) ’ ‘ OFF (no trade, only trailing works) ’ The fourth parameter is used when you only need to enable trailing for your positions and not open new positions. St
The trend trading strategy "Super Trend Flexible Alert EA" is built on the indicator of the same name "Super Trend Flexible Alert". The advisor uses all the information from the indicator, so the advisor has only three parameters, these are: “Working timeframe” – specifies the working timeframe, the timeframe on which the indicator is created, and also from which the “OHLC” data is taken. "Stop Loss" is the constant size of the stop loss, measured in "points" (you can see an example of what "po
Indicator       shows "Support" and "Resistance" lines (these lines are drawn using the DRAW_LINE drawing style - that is, they are not graphic objects). A search for new minimums and maximums is performed to the left and right of the "signal bar" - the "signal bar" is the conventional middle of each new construction. Why is the word Flexible in the name of the indicator? Because we have the possibility to specify different number of bars to the left ('Left Bars') and to the right ('Right Bars'
The dashboard scans the readings of two indicators: 'MACD' and 'Stochastic'. Displays signals in three columns: for MACD, for Stochastic, and the resulting column (if the signal is the same for both indicators).  Scanning can be selected on one or more timeframes. If you disable all timeframes, the dashboard will still load, but with settings specifically for such cases. Signals are always checked for the zero bar (zero bar is the rightmost bar on the chart) of the indicator. Description of para
ATR Bands Alert
Vladimir Karputov
ATR Bands Alert is a channel indicator where the channel width is calculated as a constant multiplier ("Multiplier") and the value of the "Average True Range" indicator. Unlike Bollinger Bands, the bandwidth is not changed so often – in the ATR Bands Alert indicator, the bands often have long straight lines. The interpretation of the ATR Bands Alert is based on the fact that the price is inside the bands for most of the time, and if the price reaches one of the boundaries, it may indicate a tr
The Bollinger Bands Dashboard indicator offers a convenient and informative way to track Bollinger Bands indicator signals on different timeframes using one panel (Dashboard). This tool allows traders to quickly and easily obtain the information they need, enabling efficient decision-making in the market. Main characteristics: 1. **Signals Panel**: The Dashboard displays Bollinger Bands signals for selected timeframes, providing users with clear and structured information. 2. **Flexibility in
Virtual Breakeven
Vladimir Karputov
Introducing the utility "   VIRTUAL BREAKEVEN   !" "Current symbol" is the symbol of the chart on which the utility works. The utility keeps a count of all positions on the current symbol and ignores the "Magic number" of these positions. The utility works on the current symbol and tracks the Breakeven level in the deposit money. When the profit of all positions on the current symbol becomes >= «Trigger» the utility will start tracking « Breakeven ". A common example: manual trading, constantly
Tensline
Vladimir Karputov
Simple , effective - an expert advisor that works for you This advisor is designed for traders who value simplicity and control. With minimal settings, it is incredibly easy to set up and run - no complex optimization required. Holds only one market position at a time - no clutter, no overlap. Currently optimized for trading gold ( XAUUSD , GOLD ). Backtest results show: This advisor is an ideal choice for traders looking for a simple, reliable and adaptable tool for daily trading.
Filter:
No reviews
Reply to review