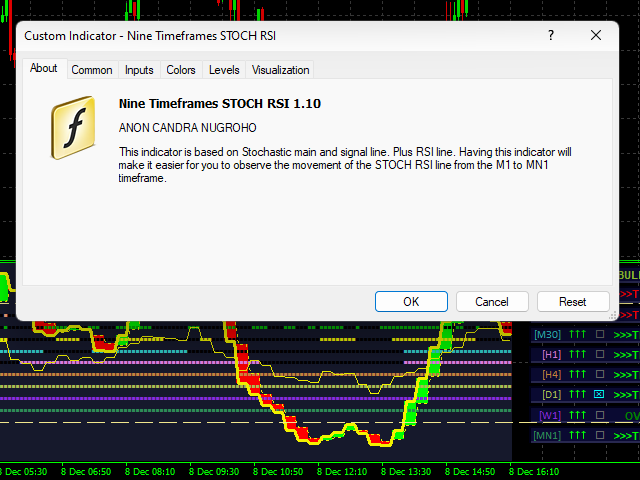
Nine Timeframes Stoch RSI
- Indicators
-
Anon Candra N
 I am a professional trader who has been in the stock market for several years. After making in-depth observations of the stock market, I developed the trading tools that have helped my trading career so far. The good news is, you can have these trading tools on this website.
 - Version: 1.10
- Updated: 9 December 2022
- Activations: 15
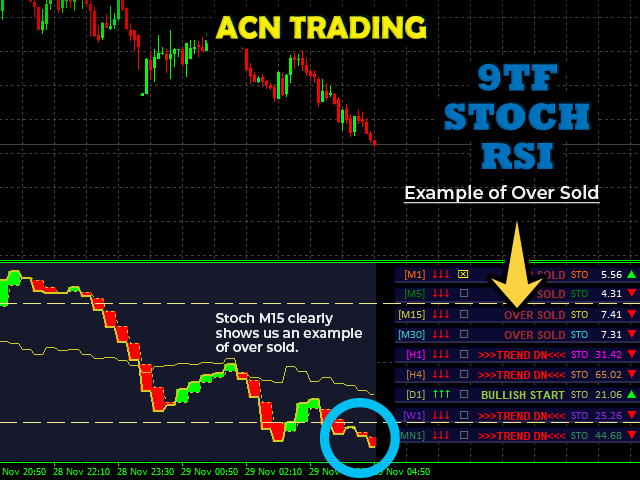
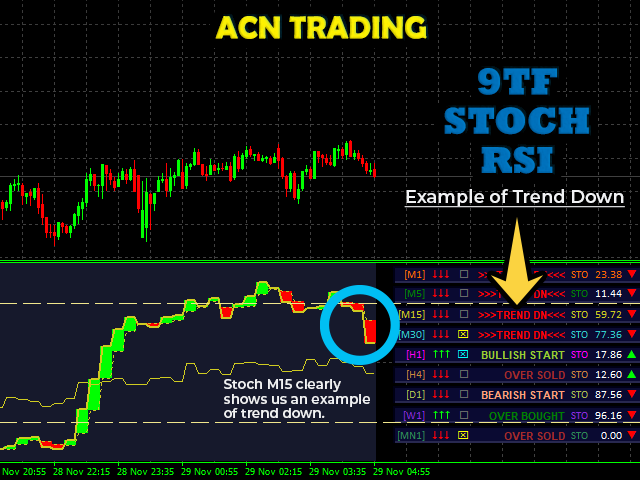
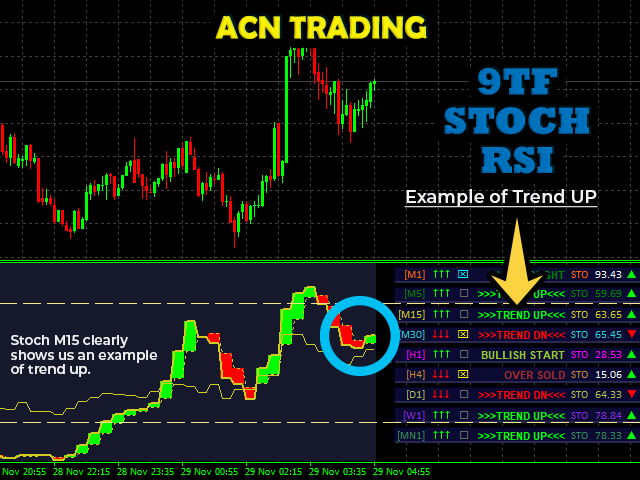
Analyzing multiple time frames of a currency pair in one window can make you confused.
To analyze multiple time frames, you need reliable indicators.
One of them is using 9TF STOCH RSI.
I've been working day and night to create code that is simple but reliable and covers all nine time frames in just one indicator.
Let's look at some of the advantages of this indicator:
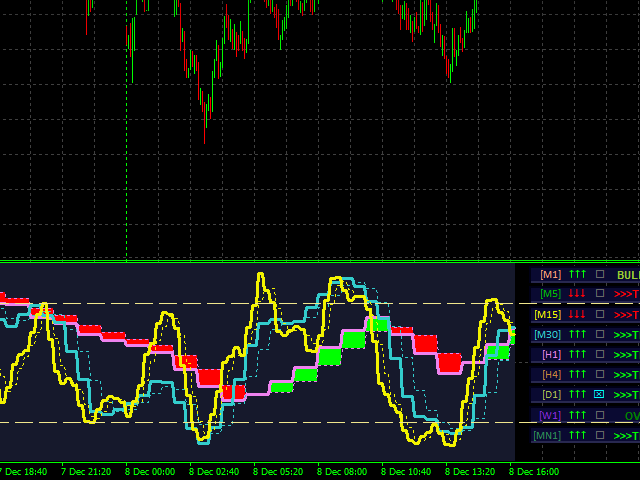
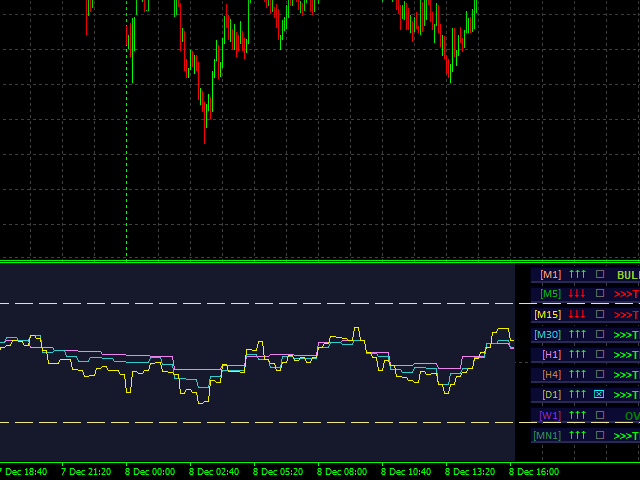
- Colorful histogram.
- The color of the curve in each timeframe is different from one another.
- Arrows indicating the crossing of STOCHASTIC main line & signal line. (Note: Ignore the last arrow that appears!)
- OBOS level line.
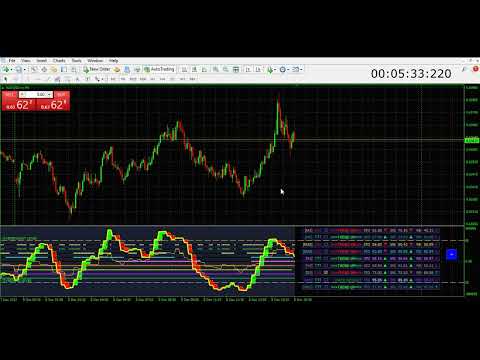
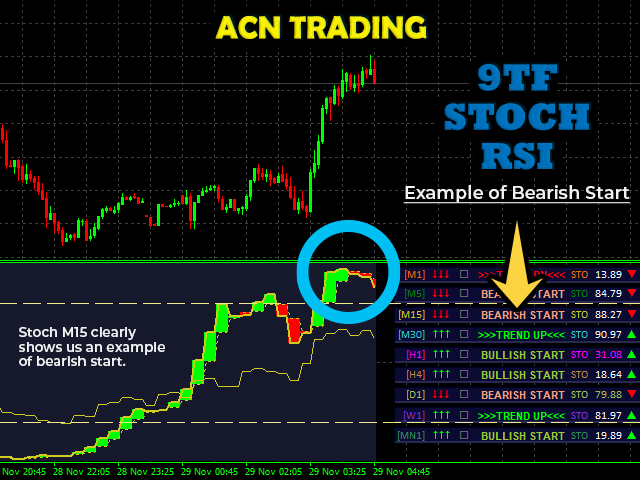
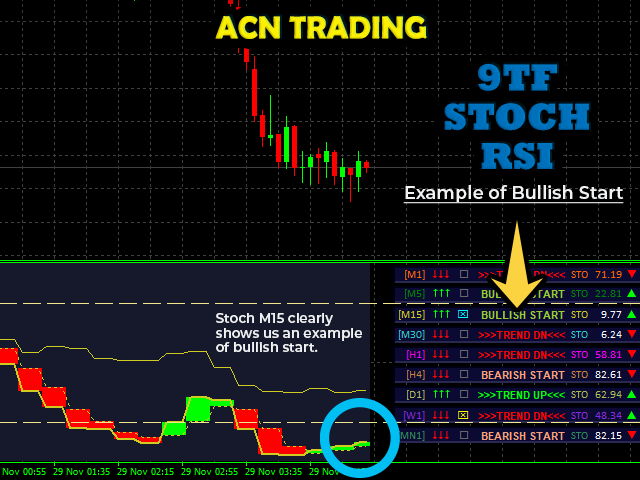
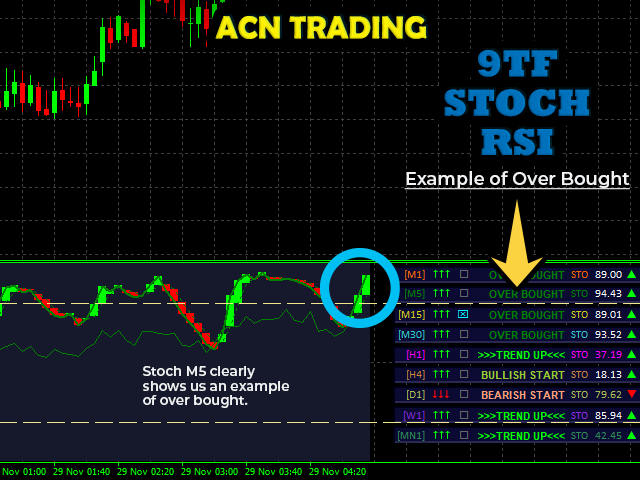
- Real time 9TF dashboard monitor.
- The 9TF dashboard monitor calculations are very accurate even if you change from one time frame to another.
- Monitoring which curve is above the overbought level and which is below the oversold level.
- Monitoring the curve whether the main STOCH is above the signal STOCH or vice versa.
- Monitoring the curve whether there is a crossing between the main STOCH and the signal STOCH.
- Monitoring the movement of the current signal with the previous signal. On the rise or on the way down. (Note: This is very important feature for scalping!)
- Monitoring the movement of RSI line.
- A very important trend bar feature to spot the longer-term trend.
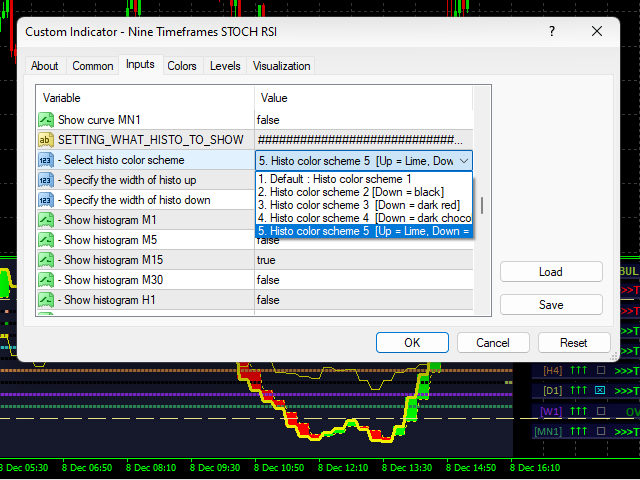
- Ability to change the color.
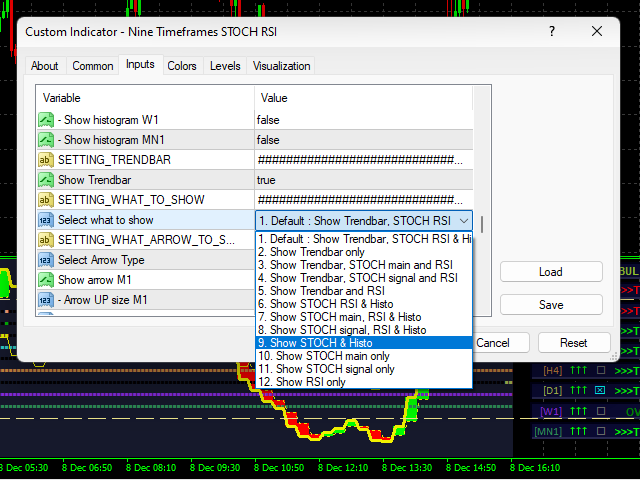
- Ability to choose which curve to show.
- Ability to show STOCH only, RSI only etc.
- Ability to choose which histogram to show.
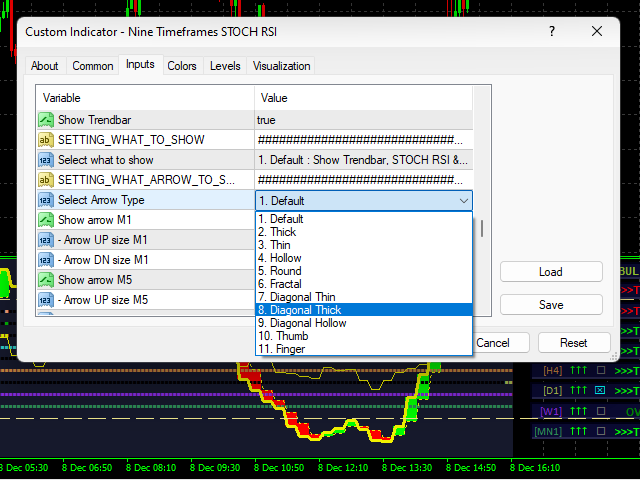
- Ability to choose which arrow to show.
- Ability to place the 9TF dashboard monitor in your desired location.
- Ability to show or hide the indicator in just one click button.
- Ability to monitor the price action movement from the higher time frame to small time frame.
- Can be use to analyze forex, indices, metal/energy, stocks and cryptocurrency.
Q1. How to know whether the stochastic main line is above the stochastic signal line and vice versa?
A1. Take a look at the three arrows. If the current stochastic main line > the current stochastic signal line then the three arrows are facing up and are lime colored. The opposite is facing down and is red.
Q2. How to know whether the current stochastic main line is greater than the previous stochastic main line and vice versa?
A2. Take a look at the stochastic main phase (expressed in the form of a triangle). If the current stochastic main line > the previous stochastic main line, then the phase is in the form of a triangle facing up and is lime colored. The opposite is a downward triangle and is red.
Q3. How to know whether the current stochastic signal line is greater than the previous stochastic signal line and vice versa?
A3. Take a look at the stochastic signal phase (expressed in the form of a triangle). If the current stochastic signal line > the previous stochastic signal line, then the phase is in the form of a triangle facing up and is lime colored. The opposite is a downward triangle and is red.
Q4. How to know whether the current rsi line is greater than the previous rsi line and vice versa?
A4. Take a look at the single arrow. If the current rsi line > the previous rsi line, then the arrow is facing up and is lime colored. The opposite is facing down and is red.
You can watch the full feature on my YouTube channel. Nothing to hide.
My intention to make this indicator is to increase your winning and profits.
Make confident entries with the best STOCH RSI trading indicator.
Get now and trade like a pro.
Thank you.