Dashboard Trend Bar Smart Level 9TF Double CCI

An accurate CCI indicator is available.

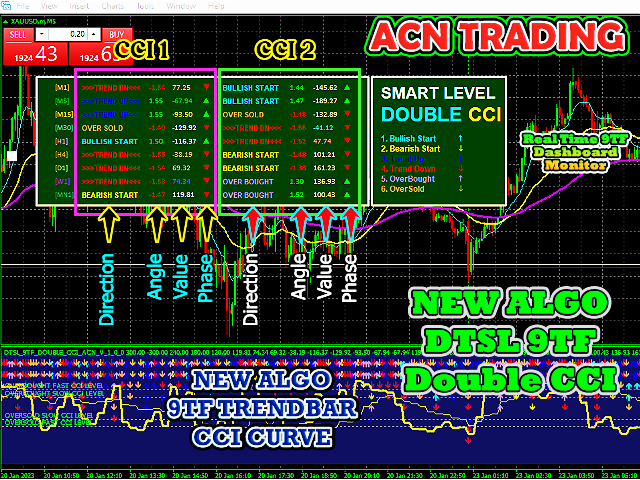
Dashboard Trend Bar Smart Level 9TF Double CCI.

  • Double CCI, i.e Fast CCI & Slow CCI
  • Why you need second CCI? Using additional indicators will convince us more in live trading
  • 9TF Fast CCI curve
  • 9TF Slow CCI curve
  • 9TF real time CCI angle
  • 9TF real time CCI value
  • 9TF real time CCI direction/phase
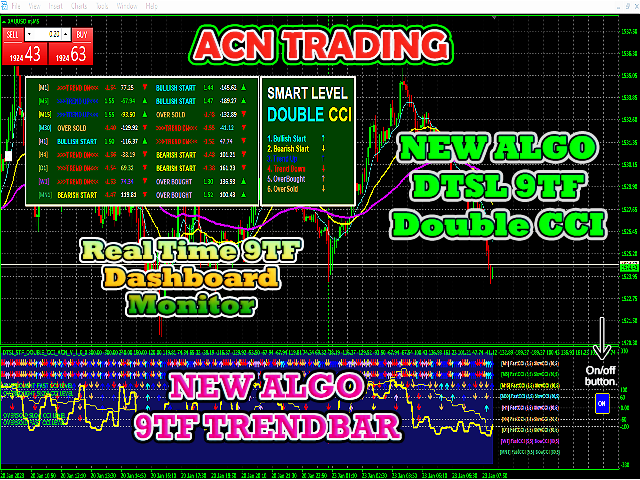
  • 9TF Trend Bar 
  • New algo in calculating trend bar
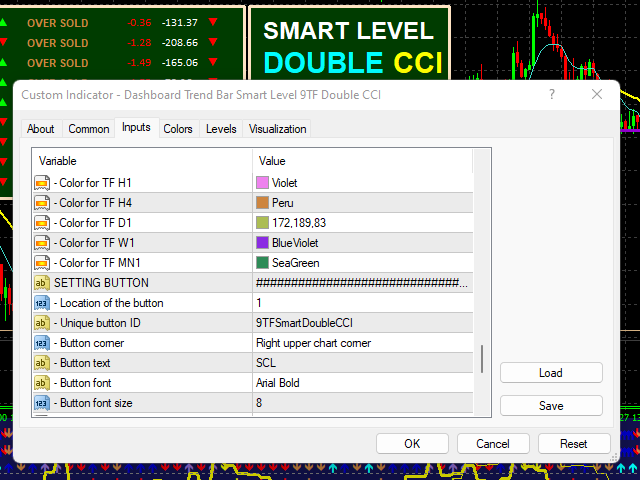
  • On/off Button. Very useful to show/hide indicator in just one click
  • Real time 9TF dashboard monitor 
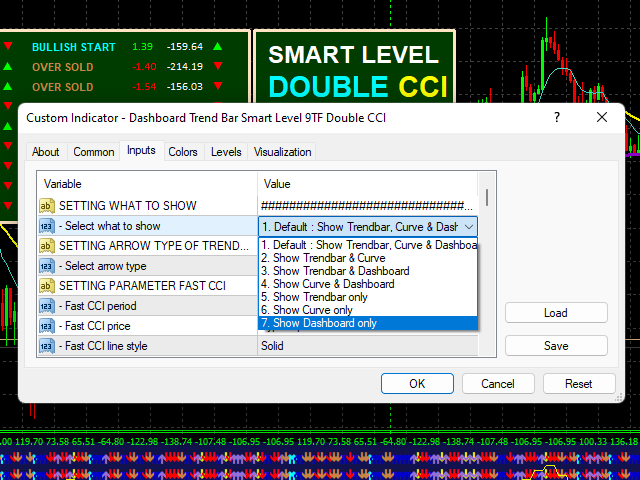
  • Ability to show trend bar only
  • Ability to show CCI curve only
  • Ability to show dashboard only
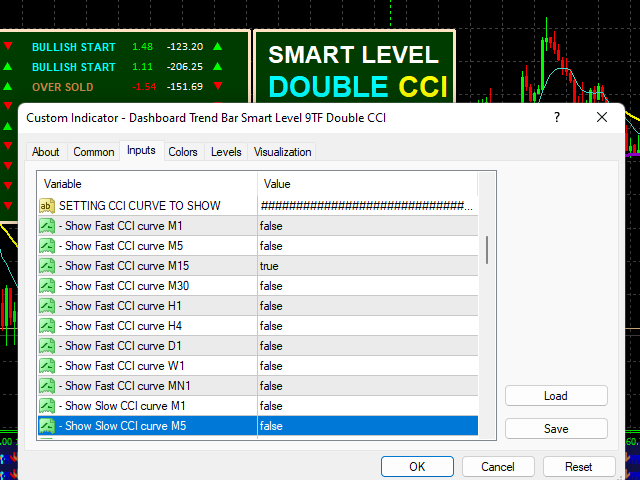
  • Ability to select which CCI curve to show
  • Ability to select arrow type of trend
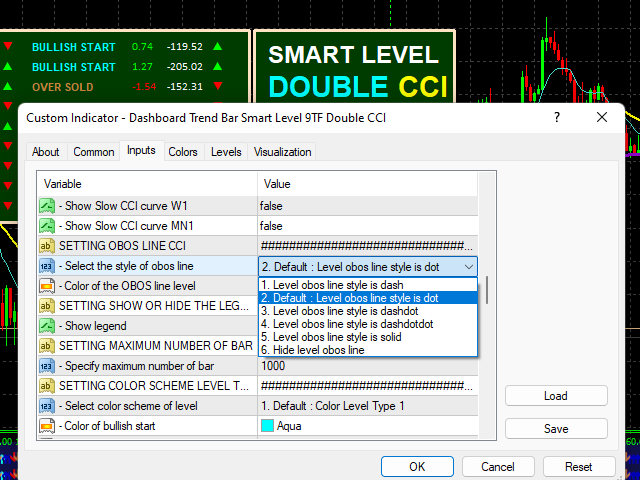
  • Ability to select obos line style
  • Ability to show/hide legend
  • Ability to increase/decrease the number of bar
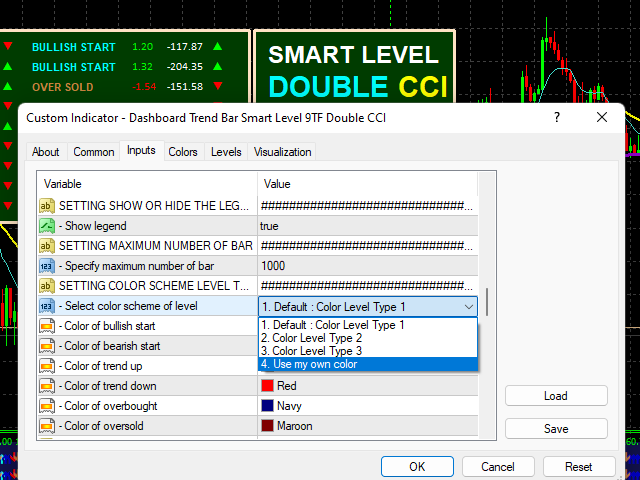
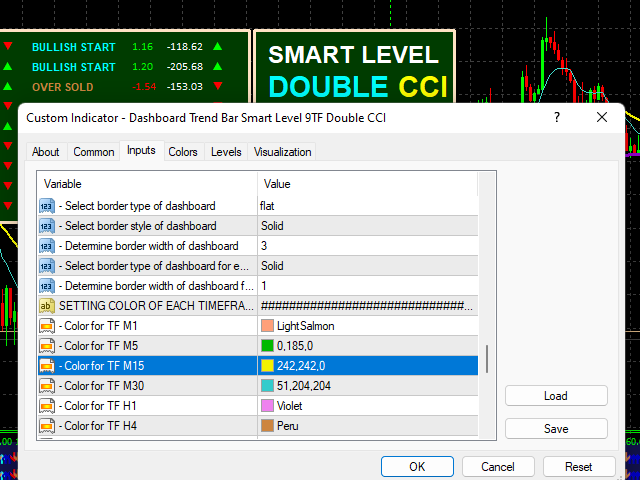
  • Ability to select color scheme level
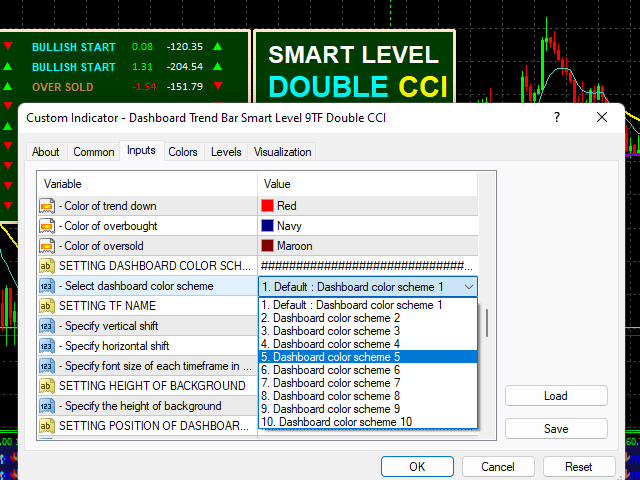
  • Ability to select up to 10 dashboard trend bar color scheme
  • Ability to change the color of CCI curve

This indicator has gone through a series of trials. The programming codes have been written with great care.

Make confident entries with the best DTSL 9TF Double CCI trading indicator. 

Get now and trade like a pro. 

Thank you. 
Recommended products
HMA Trend Professional MT4
Pavel Zamoshnikov
4.57 (7)
Improved version of the free HMA Trend indicator (for MetaTrader 4) with statistical analysis. HMA Trend is a trend indicator based on the Hull Moving Average (HMA) with two periods. HMA with a slow period identifies the trend, while HMA with a fast period determines the short-term movements and signals in the trend direction. The main differences from the free version: Ability to predict the probability of a trend reversal using analysis of history data. Plotting statistical charts for analyzi
Owl smart levels
Sergey Ermolov
4.24 (37)
MT5 version  |  FAQ The Owl Smart Levels Indicator  is a complete trading system within the one indicator that includes such popular market analysis tools as  Bill Williams' advanced fractals , Valable ZigZag which builds  the correct wave structure  of the market, and  Fibonacci levels  which mark the exact levels of entry into the market and places to take profits. Detailed description of the strategy Instructions for working with the indicator Advisor-assistant in trading Owl Helper Private
The Th3Eng PipFinite indicator is based on a very excellent analysis of the right trend direction with perfect custom algorithms. It show the true direction and the best point to start trading. With StopLoss point and Three Take Profit points. Also it show the right pivot of the price and small points to order to replace the dynamic support and resistance channel, Which surrounds the price. And Finally it draws a very helpful Box on the left side on the chart includes (take profits and Stop loss
Signal trend indicator. Detects the direction of the trend and is coloured accordingly.  Has built in audible and visual alerts when trends change. Can send notifications to your phone or email. Allows Trend and Counter-Trend trading. Works on all timeframes, all currency pairs, metals, indices and cryptocurrencies. Can be used with binary options. Distinctive features No re-drawing; Simple and clear settings; Four types of alerts; Works on all timeframes and all trading tools; Suitable
Antabod Gamechanger
Rev Anthony Olusegun Aboderin
*Antabod GameChanger Indicator – Transform Your Trading!*   Are you tired of chasing trends too late or second-guessing your trades? The *Antabod GameChanger Indicator* is here to *revolutionize your trading strategy* and give you the edge you need in the markets!   Why Choose GameChanger? *Accurate Trend Detection* – GameChanger identifies trend reversals with *pinpoint accuracy*, ensuring you enter and exit trades at the optimal time.   *Clear Buy & Sell Signals* – No more guesswork! T
Forex Gump
Andrey Kozak
2.4 (5)
Forex Gump is a fully finished semi-automatic trading system. In the form of arrows, signals are displayed on the screen for opening and closing deals. All you need is to follow the instructions of the indicator. When the indicator shows a blue arrow, you need to open a buy order. When the indicator shows a red arrow, you need to open a sell order. Close orders when the indicator draws a yellow cross. In order to get the most effective result, we recommend using the timeframes H1, H4, D1. There
Gioteen Volatility Index (GVI)   - your ultimate solution to overcoming market unpredictability and maximizing trading opportunities. This revolutionary indicator helps you in lowering your losing trades due to choppy market movements. The GVI is designed to measure market volatility, providing you with valuable insights to identify the most favorable trading prospects. Its intuitive interface consists of a dynamic red line representing the volatility index, accompanied by blue line that indicat
Auto Optimized RSI
Davit Beridze
5 (2)
Auto Optimized RSI is a smart and easy-to-use arrow indicator designed for precision trading. It automatically finds the most effective RSI Buy and Sell levels for your selected symbol and timeframe using real historical data simulations. The indicator can be used as a standalone system or as part of your existing trading strategy. It is especially useful for intraday trading. Unlike traditional RSI indicators that rely on fixed 70/30 levels, Auto Optimized RSI dynamically adjusts its levels bas
EZZ Zig Zag MT4
Paulo Rocha
5 (1)
EZZ Elite Zig Zag is an indicator for the MetaTrader 4 terminal. This indicator traces the peak of the trend based on the market reversal, thus showing various opportunities in the financial market. EZZ Elite Zig Zag is a visual tool, intuitive, and easy to understand and use.  Test it Yourself by Downloading it for Free. Author Paulo Rocha all rights reserved
Fibonacci retracement and extension line drawing tool Fibonacci retracement and extended line drawing tool for MT4 platform is suitable for traders who use  golden section trading Advantages: There is no extra line, no too long line, and it is easy to observe and find trading opportunities Trial version: https://www.mql5.com/zh/market/product/35884 Main functions: 1. Multiple groups of Fibonacci turns can be drawn directly, and the relationship between important turning points can be seen
Cosmic Diviner X Planet
Olena Kondratenko
4 (2)
This unique multi-currency strategy simultaneously determines the strength of trends and market entry points, visualizing this using histograms on the chart. The indicator is optimally adapted for trading on the timeframes М5, М15, М30, Н1. For the convenience of users, the indicator renders the entry point (in the form of an arrow), recommended take profit levels (TP1, TP2 with text labels) and the recommended Stop Loss level. The take profit levels (TP1, TP2) are automatically calculated for
We present you the indicator "Candle closing counter", which will become your indispensable assistant in the world of trading. That’s why knowing when the candle will close can help: If you like to trade using candle patterns, you will know when the candle will be closed. This indicator will allow you to check if a known pattern has formed and if there is a possibility of trading. The indicator will help you to prepare for market opening and market closure. You can set a timer to create a pre
PZ Harmonacci Patterns
PZ TRADING SLU
3.17 (6)
Trade smarter, not harder: Empower your trading with Harmonacci Patterns This is arguably the most complete harmonic price formation auto-recognition indicator you can find for the MetaTrader Platform. It detects 19 different patterns, takes fibonacci projections as seriously as you do, displays the Potential Reversal Zone (PRZ) and finds suitable stop-loss and take-profit levels. [ Installation Guide | Update Guide | Troubleshooting | FAQ | All Products ] It detects 19 different harmonic pric
Heiken Ashi Smoothed Strategy is a very simple but powerful system to get forex market trend direction. This indicator is actually 2 indicators in 1 pack, Heiken Ashi and Heiken Ashi Smoothed Moving Average both included. Because HA (Heiken Ashi) and HAS (Heiken Ashi Smoothed) are calculated in the same one system event with necessary buffers and loop only, so it is the FAST, OPTIMIZED and EFFICIENT HA having the combined indicator of MetaTrader 4. You can choose to display HA and HAS in the sam
Crypto_Forex Indicator  " Morning  Star  pattern" for MT4. Indicator "Morning Star pattern" is a very powerful indicator for Price Action trading:   No repaint, No delay. Indicator   detects bullish Morning Star patterns on chart:  Blue arrow signal on chart (see pictures). With P C, Mobile & Email alerts. Also its brother - bearish  " Evening Star pattern" indicator is available (follow the link below). Indicator  " Morning Star pattern" is excellent to   combine with Support/Resistance Levels
QuantumEdge Trader
Hossam Ali Ahmed Ali
QuantumEdge Trader v1.0 AI-Powered Precision Signals for Serious Traders QuantumEdge Trader is a smart and reliable indicator that delivers accurate BUY and SELL signals using advanced market analysis and trend detection. Designed for M1 to M60 timeframes, it's ideal for scalping and intraday strategies. --- Key Features: No Repaint – Signals never change after appearing Smart trend filters to reduce noise Adjustable sensitivity and alerts Perfect for XAUUSD, EURUSD, and m
Heiken Ashi candle chart is an improved version of The Japanese candle chart, which can effectively filter the market "noise" of the Japanese candle chart. It is favored by many traders for its simplicity and intuition. For trend traders, the HA candle chart is a magic tool. Unlike the traditional Japanese candle chart, Heikenashi does not reflect the opening price, high price, low price and closing price of the market. Instead, Heikenashi calculates the value of a single K line in the dominant
RSI Speed mp
DMITRII GRIDASOV
Crypto_Forex   Indicator "RSI SPEED" for MT4 - great predictive tool , No Repaint. The calculation of this indicator is  based on equations from physics . RSI SPEED is the  1st derivative of RSI  itself. RSI SPEED is   good for scalping entries   into the direction of main trend. Use it   in combination   with suitable   trend indicator , for example HTF MA (as on pictures). RSI SPEED indicator shows how fast RSI itself changes its direction   - it is very sensitive . It is recommended to use RS
Infinity Trend Pro
Yaroslav Varankin
1 (1)
This is a trend indicator without redrawing Developed instead of the binary options strategy (by the color of the Martingale candlestick) Also works well in forex trading When to open trades (binary options) A signal will appear in the place with a candle signaling the current candle It is recommended to open a deal for one candle of the current timeframe M1 and M5 When a blue dot appears, open a deal up When a red dot appears, open a trade down. How to open trades on Forex. When a signal is rec
Spread and Close MT4
Alexander Denisovich Jegorov
Spread & Candle Close Timer Indicator for MT4  Optimize your trading with this lightweight and efficient indicator, designed to display the real-time spread and candle close countdown directly on your MT4 chart. Features: Live Spread Monitoring – Instantly see market conditions. Candle Close Timer – Stay prepared for the next price movement. Simple & Non-Intrusive Design – No unnecessary settings, just clear and accurate data. Ideal for scalpers, day traders, and those who need real-time exec
Trendlines Chart Patterns Indicator (MT4) Automated Chart Patterns & Breakout Signals for MT4: Trade with Precision! The "Trendlines Chart Patterns Indicator" is an advanced trading tool for MetaTrader 4 (MT4) , meticulously designed to identify high-probability buy and sell signals based on dynamically forming, robust trend lines and popular chart patterns . This powerful forex indicator automates the complex process of identifying patterns like triangles, flags, ranges, ascending/descending tr
Gold Titan King Scalper
Dodong Christian Arnon
Indicator Description GOLD TITAN KING SIGNAL INDICATOR High-Precision Gold Scalping Buy/Sell Signals – Manual Trading Assistant Overview The Gold Titan King Signal Indicator is a manual trading assistant tool designed for high-frequency scalping on Gold (XAUUSD) and other major pairs. It generates clear BUY/SELL signals with precise entry levels, along with adjustable Stop Loss and Take Profit levels displayed directly on the chart. ️ This tool is NOT an EA. It does not execute trades
Crypto_Forex Indicator " F orce Index   with Dynamic OverSold/OverBought zones " for MT4 , No Repaint. F orce index is one of the top indicators that combines price and volume data into a single value. It   is great to take   Sell   trades from   dynamic OverBought zone and   Buy   trades from dynamic OverSold zone. T his indicator is excellent for   Momentum trading   into the trend direction. D ynamic   OverBought zone - above yellow line. Dynamic   OverSold zone - below blue line. F orce 
A visualization system for favorite candlesticks price action patterns. Once attached, indicator will automatically mark next patterns on the chart: Pinocchio bar - a small-body bar with a long 'nose', very well-known reverse pattern; Inside bar - a bar whose range lies inside the range of the previous bar. It represents market incertitude; Outside bar - a bar whose range exceeds the range of the previous bar. It represents market incertitude; Rails pattern - two consequent opposite bars with al
Discover the Power of Trend Strength Pro Unlock a new level of clarity in your trading with Trend Strength Pro , the ultimate tool for visualizing market momentum. Stop guessing and start seeing the true strength of a trend with a single glance. Our elegant and intuitive indicator helps you make smarter, more confident trading decisions. Key Advantages & Features Instantly See Trend Strength : Our color-coded histogram tells you whether the trend is getting stronger or weaker. Green means moment
FREE
[V 1.90] MTF NRPA 5 RSI RTD has been released! ( New sub buttons 2025 ) Non repaint arrow real time dashboard. If you are tired of using various RSI indicators but find that they are inaccurate, then try this one tool. Usually people only install 1 RSI to determine the OBOS level in a timeframe. The bad news is that you can't see OBOS levels and trends in various timeframes at once. That's why I developed this trading tool. Here's how it's explained: On this trading tool, I use five RSI. Yes, o
Gartley Hunter MT4
Siarhei Vashchylka
3.67 (3)
Gartley Hunter - An indicator for searching for harmonic patterns (Gartley patterns) and their projections. The indicator is equipped with a system of alerts and push notifications. Manual (Be sure to read before purchasing) | Version for MT5 Advantages 1. 12 harmonic patterns: 7 classical and 5 exotic. New patterns will be added as the indicator develops. 2. Constant automatic search for harmonic patterns. The indicator is capable of finding from the smallest to the largest patterns. 3. Automa
This indicator is another variant of the famous powerful indicator Fibonacci-SS https://www.mql5.com/en/market/product/10136 but has different behaviour in placing Pending Order and TP Line. Automatically places Fibonacci retracement lines from the last highest and lowest visible bars on the chart with: An auto Pending Order (Buy/Sell). Taking Profit 1, Taking Profit 2 is pivot point and Taking Profit 3 for extended reward opportunity. The best risk and reward ratio. Simple and powerful indicat
Renko, Heiken Ashi, Ticks Bar, Range Bar.    Easy switching, easy setup, all in one window.        Place the Custom Chart indicator and view Renko, Heiken Ashi, Tick bar, Range bar charts in real time at real chart.    Position the offline chart window so that the indicator control panel is visible.    Switch the chart mode by click of a button.    Connect to the output chart any indicator, expert advisor without any restrictions.    No, it doesn't work in the tester.    Yes, you can use an
Mirror
Stanislav Korotky
This indicator predicts rate changes based on the chart display principle. It uses the idea that the price fluctuations consist of "action" and "reaction" phases, and the "reaction" is comparable and similar to the "action", so mirroring can be used to predict it. The indicator has three parameters: predict - the number of bars for prediction (24 by default); depth - the number of past bars that will be used as mirror points; for all depth mirroring points an MA is calculated and drawn on the ch
Buyers of this product also purchase
Meravith
Ivan Stefanov
5 (1)
Market makers' tool. The indicator analyzes volume from every point and calculates exhaustion market levels for that volume. ( This is a manual indicator and contains features that may not supported by the MetaTrader current testing environment ) Meravith main lines: - Bullish volume exhaustion line   - serves as a target. - Bearish volume exhaustion line   - serve as a target. -   A line indicating the market trend. It changes color depending on whether the market is bullish or bearish and s
Scalper Inside PRO
Alexey Minkov
4.74 (69)
An exclusive indicator that utilizes an innovative algorithm to swiftly and accurately determine the market trend. The indicator automatically calculates opening, closing, and profit levels, providing detailed trading statistics. With these features, you can choose the most appropriate trading instrument for the current market conditions. Additionally, you can easily integrate your own arrow indicators into Scalper Inside Pro to quickly evaluate their statistics and profitability. Scalper Inside
Year-End Trading SALE – Save 50% While It Lasts! Best Solution for any Newbie or Expert Trader! This dashboard software is working on 28 currency pairs plus one. It is based on 2 of our main indicators (Advanced Currency Strength 28 and Advanced Currency Impulse). It gives a great overview of the entire Forex market plus Gold or 1 indices. It shows Advanced Currency Strength values, currency speed of movement and signals for 28 Forex pairs in all (9) timeframes. Imagine how your trading will imp
Currency Strength Exotics
Bernhard Schweigert
4.88 (33)
CURRENTLY 20% OFF ! Best Solution for any Newbie or Expert Trader! This Indicator is specialized to show currency strength for any symbols like Exotic Pairs Commodities, Indexes or Futures. Is first of its kind, any symbol can be added to the 9th line to show true currency strength of Gold, Silver, Oil, DAX, US30, MXN, TRY, CNH etc. This is a unique, high quality and affordable trading tool because we have incorporated a number of proprietary features and a new formula. Imagine how your trading
Advanced Supply Demand
Bernhard Schweigert
4.91 (296)
Year-End Trading SALE – Save 50% While It Lasts! Best Solution for any Newbie or Expert Trader! This indicator is a unique, high quality and affordable trading tool because we have incorporated a number of proprietary features and a new formula. With this update, you will be able to show double timeframe zones. You will not only be able to show a higher TF but to show both, the chart TF, PLUS the higher TF: SHOWING NESTED ZONES. All Supply Demand traders will love it. :) Important Information Re
New Update of Smart Trend Trading System MT5 For  2026 Market: If You Buy this Indicator you will Get my Professional   Trade Manager + EA  for   FREE . First of all Its worth emphasizing here that this Trading System is   Non-Repainting   , Non Redrawing and Non Lagging Indicator   Which makes it ideal from both manual and robot trading .  [Online course] ,   [manual]   and   [download presets] . The Smart Trend Trading System MT5 is a comprehensive trading solution tailored for   new   and   e
This indicator is an indicator for automatic wave analysis that is perfect for practical trading! Case... Note:   I am not used to the Western name for wave classification. Influenced by the naming habit of Chaos Theory (Chanzhongshuochan), I named the basic wave as   pen   , the secondary wave band as   segment   , and the segment with trend direction   as main trend segment   (this naming method will be used in future notes, let me tell you in advance), but the algorithm is not closely relat
FX Power MT4 NG
Daniel Stein
4.95 (20)
FX Power: Analyze Currency Strength for Smarter Trading Decisions Overview FX Power is your go-to tool for understanding the real strength of currencies and Gold in any market condition. By identifying strong currencies to buy and weak ones to sell, FX Power simplifies trading decisions and uncovers high-probability opportunities. Whether you’re looking to follow trends or anticipate reversals using extreme delta values, this tool adapts seamlessly to your trading style. Don’t just trade—trade
Looking for a powerful yet lightweight swing detector that accurately identifies market structure turning points? Want clear, reliable buy and sell signals that work across any timeframe and any instrument? Buy Sell Arrow MT Swing is built exactly for that — precision swing detection made simple and effective. This indicator identifies Higher Highs (HH) , Higher Lows (HL) , Lower Highs (LH) , and Lower Lows (LL) with remarkable clarity. It is designed to help traders easily visualize market str
Dynamic Forex28 Navigator
Bernhard Schweigert
4.43 (7)
Specials Discount now. The Next Generation Forex Trading Tool. Dynamic Forex28 Navigator is the evolution of our long-time, popular indicators, combining the power of three into one: Advanced Currency Strength28 Indicator (695 reviews) + Advanced Currency IMPULSE with ALERT (520 reviews) + CS28 Combo Signals (recent Bonus) Details about the indicator  https://www.mql5.com/en/blogs/post/758844 What Does The Next-Generation Strength Indicator Offer? Everything you loved about the originals, now
ACB Breakout Arrows
KEENBASE SOFTWARE SOLUTIONS
4.15 (34)
The ACB Breakout Arrows indicator provides a crucial entry signal in the market by detecting a special breakout pattern. The indicator constantly scans the chart for a settling momentum in one direction and provide the accurate entry signal right before the major move.  Get multi-symbol and multi-timeframe scanner from here - Scanner for ACB Breakout Arrows MT4 Key features Stoploss and Take Profit levels are provided by the indicator. Comes with a MTF Scanner dashboard which tracks the breako
Year-End Trading SALE – Save 50% While It Lasts! Best Solution for any Newbie or Expert Trader! This Indicator is a unique, high quality and affordable trading tool because we have incorporated a number of proprietary features and a new formula. With only ONE chart you can read Currency Strength for 28 Forex pairs! Imagine how your trading will improve because you are able to pinpoint the exact trigger point of a new trend or scalping opportunity? User manual: click here That's the first one, th
SMC Blast Signal with FVG, BOS and trend Breakout The SMC Blast Signal  is a  Precise trading system for Meta Trader 4 that uses Smart Money Concepts (SMC) , including Fair Value Gaps (FVG) and Break of Structure (BOS) , to identify high-probability trades. It incorporates a Trend Filter using a higher timeframe moving average, ensuring trades align with the prevailing market trend. TREND SIGNAL-FVG DETECTION-BOS DETECTION-TRADE CONFIRMED-Precise Signal entries on m15  Best TF-M15 AND ABOVE Be
Entry Points Pro
Yury Orlov
4.62 (172)
Top indicator for MT4 providing accurate signals to enter a trade without repainting! Watch  the video  (6:22) with an example of processing only one signal that paid off the indicator! It can be applied to any financial assets:  forex, cryptocurrencies, metals, stocks, indices.  MT5 version is here   It will provide pretty accurate trading signals and tell you when it's best to open a trade and close it. Most traders improve their trading results during the first trading week with the help of t
Hidden Cycles
Lev Vladimirovic Marushkin
5 (1)
Black Friday Sale – Limited Time! Grab Hidden Cycles for only $129 (regular price $179 ). This is your chance to boost your strategy with a powerful, easy-to-use cycle-based trading tool. Offer ends soon — don’t miss it! Based on Universal Laws — NOT Some Guy’s Algorithm: Let the market adjust to the Hidden Cycles Geometry — not the other way around. Most indicators are based on a man-made formula. They often lag, fail over time, or need constant re-optimization.  Hidden Cycles is different.
Adaptive Volatility Range [AVR] is a powerful tool for identifying key trend reversal points. AVR accurately reflects the Average True Range (ATR) of volatility, taking into account the Volume-Weighted Average Price (VWAP). The indicator adapts to any market volatility by calculating the average volatility over a specific period, ensuring a stable rate of profitable trades. You receive not just an indicator but a professional automated trading system , AVR-EA . Advantages: Automated Trading Sys
Royal Wave Pro M4
Vahidreza Heidar Gholami
5 (3)
Royal Wave is a Trend-Power oscillator which has been programmed to locate and signal low-risk entry and exit zones. Its core algorithm statistically analyzes the market and generates trading signals for overbought, oversold and low volatile areas. By using a well-designed alerting system, this indicator makes it easier to make proper decisions regarding where to enter and where to exit trades. Features Trend-Power Algorithm Low risk Entry Zones and Exit Zones Predictions for Overbought and Over
RelicusRoad Pro
Relicus LLC
4.63 (106)
How many times have you bought a trading indicator with great back-tests, live account performance proof with fantastic numbers and stats all over the place but after using it, you end up blowing your account? You shouldn't trust a signal by itself, you need to know why it appeared in the first place, and that's what RelicusRoad Pro does best! User Manual + Strategies + Training Videos + Private Group with VIP Access + Mobile Version Available A New Way To Look At The Market RelicusRoad is th
FX Volume
Daniel Stein
4.62 (37)
FX Volume: Experience Genuine Market Sentiment from a Broker’s Perspective Quick Overview Looking to elevate your trading approach? FX Volume provides real-time insights into how retail traders and brokers are positioned—long before delayed reports like the COT. Whether you’re aiming for consistent gains or simply want a deeper edge in the markets, FX Volume helps you spot major imbalances, confirm breakouts, and refine your risk management. Get started now and see how genuine volume data can
CONGESTION BREAKOUT PRO This indicator scans the breakout of congestion zones . This indicator unlike any other congestion indicator you will find in the market right now,  it uses an advanced algorithm not peculiar to most traditional congestion indicators available today . The advanced algorithm used to define the congestions  is greatly responsible for the high rate real congestion zones and low rate fake congestion zones spotted by this product. UNDERSTANDING CONGESTION Congestion are ar
OrderFlow Absorption – Professional Delta & Absorption Signal Indicator for MT4 Unlock the power of true order flow analysis with   OrderFlow Absorption   – the ultimate delta histogram and absorption signal indicator for MetaTrader 4. Designed for traders who want to see what’s really happening behind every price move, this tool reveals hidden buy/sell pressure and absorption events that drive the market. Features Delta Histogram Visualization:   Instantly see buy and sell pressure with clear,
Extreme Value Sniper is a detrended price indicator  Indicator finds the potential reversal levels by checking value ranges and price cycles. MT5 Version of the product :  https://www.mql5.com/en/market/product/114550 It shows the overbought and oversold levels using the average range. Overbought Levels are between 4 and 10 Oversold levels are bewtween -4 and -10 Those levels can be used as a reversal levels. Extreme Value Sniper look for some special divergence and convergence patterns to c
The " Dynamic Scalper System " indicator is designed for the scalping method of trading within trend waves. Tested on major currency pairs and gold, compatibility with other trading instruments is possible. Provides signals for short-term opening of positions along the trend with additional price movement support. The principle of the indicator. Large arrows determine the trend direction. An algorithm for generating signals for scalping in the form of small arrows operates within trend waves.
PZ Swing Trading
PZ TRADING SLU
5 (3)
Protect against whipsaws: revolutionize your swing trading approach Swing Trading is the first indicator designed to detect swings in the direction of the trend and possible reversal swings. It uses the baseline swing trading approach, widely described in trading literature. The indicator studies several price and time vectors to track the aggregate trend direction and detects situations in which the market is oversold or overbought and ready to correct. [ Installation Guide | Update Guide | Tro
The BB Reversal Arrows technical trading system has been developed to predict reverse points for making retail decisions. The current market situation is analyzed by the indicator and structured for several criteria: the expectation of reversal moments, potential turning points, purchase and sale signals. The indicator does not contain excess information, has a visual understandable interface, allowing traders to make reasonable decisions. All arrows appear to close the candle, without redrawin
Trend Viewer Pro
Raymond Gilmour
5 (4)
SEE THE TREND ON EVERY TIME FRAME. INTELLIGENT INDICATOR READS PRICE ACTION TO SPOT TRUE MARKET CYCLES AND TREND. This advanced multi-currency and multi-time frame indicator, reads trend in real-time so you always know the trends of the markets you want to trade.  ​Trend-Viewer Pro has been specifically designed to read the trend of every time frame and every market , simultaneously, making it much easier for you to find markets with time frame correlation , so you can focus on the best markets
Full Scalping Signal
Leandro Bernardez Camero
FullScalping is a non-repainting, non-backpainting indicator, specially designed to generate CONSTANT scalping entries in any market. Perfect for aggressive traders looking for nonstop action! Join the channel to stay updated with exclusive information and updates: https://www.mql5.com/en/channels/forexnewadvisor You’ll notice it gives signals on almost every candle , either confirming the trend or signaling key retracements. It’s like having a radar constantly guiding you. How does it work?
The price is indicated only for the first   30 copies  ( only      3  copies left ).                                             The next price will be increased to    $150 . The final price will be    $250. Sniper Delta Imbalance is a professional tool for deep delta analysis — the difference between buyer and seller volumes. It takes volume analysis to the next level, allowing traders to see in real time who controls the price — buyers or seller
NAM Order Blocks
NAM TECH GROUP, CORP.
3.67 (3)
MT4 Multi-timeframe Order Blocks detection indicator. Features - Fully customizable on chart control panel, provides complete interaction. - Hide and show control panel wherever you want. - Detect OBs on multiple timeframes. - Select OBs quantity to display. - Different OBs user interface. - Different filters on OBs. - OB proximity alert. - ADR High and Low lines. - Notification service (Screen alerts | Push notifications). Summary Order block is a market behavior that indicates order collection
The Nihilist 5.0 Indicator includes Forexalien and Nihilist Easy Trend trading strategies and systems. It is composed of an MTF Dashboard where you can analyze the different input possibilities of each strategy at a glance. It has an alert system with different types of configurable filters. You can also configure which TF you want to be notified on your Metatrader 4 platform and Mobile application The indicator has the option to view how could be a TP and SL by using ATR or fixed points, even w
More from author
[V 2.00] MTF NRPA 5 Moving Average RTD has been released! ( New sub buttons 2025 ) Non repaint arrow real time dashboard. If you are looking for the best moving average indicator then you are on the right page. Generally people will install two moving averages because the intersection of the two moving averages (the crossover) will determine the direction of the next price trend. If the fast moving average intersects with the slow moving average and fast > slow then the trend is up. Conversely,
Analyzing multiple time frames of a currency pair in one window can make you confused. To analyze multiple time frames, you need reliable indicators. One of them is using 9TF STOCH RSI . I've been working day and night to create code that is simple but reliable and covers all nine time frames in just one indicator .  Let's look at some of the advantages of this indicator: Colorful histogram . The color of the curve in each timeframe is different from one another.  Arrows indicating the crossing
Analyzing multiple time frames of a currency pair in one window can make you confused. To analyze multiple time frames, you need reliable indicators. One of them is using 9TF RSI MA . I've been working day and night to create code that is simple but reliable and covers all nine time frames in just one indicator .  Let's look at some of the advantages of this indicator: Colorful histogram . The color of the curve in each timeframe is different from one another.  Arrows indicating the crossing of
Analyzing multiple time frames of a currency pair in one window can make you confused. To analyze multiple time frames, you need reliable indicators. One of them is using 9TF Double RSI Double MA . I've been working day and night to create code that is simple but reliable and covers all nine time frames in just one indicator .  Let's look at some of the advantages of this indicator: Double RSI , i.e RSI faster & RSI slower. Double MA , i.e MA faster & MA slower. MA angle of fast & slow. ( Note
Analyzing multiple time frames of a currency pair in one window can make you confused. To analyze multiple time frames, you need reliable indicators. One of them is using 9TF Double CCI Double MA . I've been working day and night to create code that is simple but reliable and covers all nine time frames in just one indicator .  Let's look at some of the advantages of this indicator: Double CCI , i.e CCI faster & CCI slower. Double MA , i.e MA faster & MA slower. MA angle of fast & slow. ( Note
An accurate RSI indicator is available. Dashboard Trend Bar Smart Level 9TF Double RSI. Double RSI , i.e Fast RSI & Slow RSI Why you need second RSI? Using additional indicators will convince us more in live trading 9TF Fast RSI curve 9TF Slow RSI curve 9TF real time  RSI angle 9TF real time RSI value 9TF real time RSI direction/phase 9TF Trend Bar   New algo in calculating trend bar On/off Button . Very useful to show/hide indicator in just one click Real time 9TF dashboard monitor   Ability to
An accurate MACD indicator is available. Dashboard Trend Bar Smart Level 9TF Dual MACD. Dual MACD , i.e Fast (MACD 1) & Slow (MACD 2) Why you need second MACD? Using additional indicators will convince us more in live trading 9TF Fast MACD 1 curve 9TF Slow MACD 2 curve 9TF real time  MACD angle 9TF real time MACD value 9TF real time MACD direction/phase 9TF Trend Bar   New algo in calculating trend bar On/off Button . Very useful to show/hide indicator in just one click Real time 9TF dashboard m
An accurate Stochastic indicator is available. Dashboard Trend Bar Smart Level 9TF Dual Stochastic. Dual Stochastic , i.e Fast Stochastic & Slow Stochastic  Why you need second Stochastic? Using additional indicators will convince us more in live trading 9TF Fast Stochastic curve 9TF Slow Stochastic curve 9TF real time  Stochastic angle 9TF real time Stochastic value 9TF real time Stochastic direction/phase 9TF Trend Bar   New algo in calculating trend bar On/off Button . Very useful to show/hid
If you are looking for a trading tool that combines various indicators, then you are on the right page. Why do we need to combine different indicators? THE ANSWER IS TO STRENGTHEN THE SIGNAL. It is possible that the RSI is rising at that time but is the moving average also rising? Is the stochastic also rising? Is the CCI also rising? Sometimes RSI keeps going up even though it is already in the overbought area. Even at 100 it is still going up. Is it safe for us to take a sell position when R
[V 1.90] MTF NRPA 5 RSI RTD has been released! ( New sub buttons 2025 ) Non repaint arrow real time dashboard. If you are tired of using various RSI indicators but find that they are inaccurate, then try this one tool. Usually people only install 1 RSI to determine the OBOS level in a timeframe. The bad news is that you can't see OBOS levels and trends in various timeframes at once. That's why I developed this trading tool. Here's how it's explained: On this trading tool, I use five RSI. Yes, o
Introducing the advanced trading tools of 2023. MTF PPAAF Model S. This is sub window version of my best trading tool : MTF Precise Price Action Arrow Filtered.  Click here to learn more about MTF PPAAF . This trading tool is equipped with various powerful features : MTF = Multi Time Frame = Time Frame can be changed. On/off button. Non Repaint Arrows.  Customizable parameter, color etc.  Can show all time frame (ATF) crossover arrows of fast stochastic main line & fast stochastic signal line (
If you are curious about the position of the stochastic, RSI, CCI curve, whether it is at the OBOS level or not, then this trading tool is for you. Introducing the advanced trading tools of 2024. ATF Trend Following Trend Bar OBOS. This indicator is similar to MTF PPAAF Model S but have two layers.  Click here to learn more about MTF PPAAFS . This trading tool is equipped with various powerful features : MTF = Multi Time Frame = Time Frame can be changed. On/off button. Customizable parameter,
Hello traders. Introducing my best trading tool : MTF PPAAF Model T. Multi Time Frame Precise Price Action Arrow Filtered Model T. This trading tool is my best work after years of making various trading tools. This trading tool is similar to the original MTF PPAAF but you can monitor per TF curve of Double RSI and Stochastic visually from M1 to MN which is very very important! Why is this trading tool the best and reliable? 1. This tool uses 7 indicators :  Similar to the original MTF PPAAF.
With this trading tool, you can scan 15 markets simultaneously . Introducing, new trading indicator 2024 : ️ Dashboard Multi Currency Multi Time Frame Stochastic. There are at least two reasons why I created this trading tool : First , I'm bored of only observing one market. Second , I don't want to lose the entry moment in another market. That's why I want to know other market conditions at the same time. For this reason, I need a scanner that can scan the conditions of several markets si
With this trading tool, you can scan 15 markets simultaneously . Introducing, new trading indicator 2024 : ️ Dashboard Multi Currency Multi Time Frame Double CCI. There are at least two reasons why I created this trading tool : First , I'm bored of only observing one market. Second , I don't want to lose the entry moment in another market. That's why I want to know other market conditions at the same time. For this reason, I need a scanner that can scan the conditions of several markets si
With this trading tool, you can scan 15 markets simultaneously . Introducing, new trading indicator 2024 : ️ Dashboard Multi Currency Multi Time Frame Double RSI. There are at least two reasons why I created this trading tool : First , I'm bored of only observing one market. Second , I don't want to lose the entry moment in another market. That's why I want to know other market conditions at the same time. For this reason, I need a scanner that can scan the conditions of several markets si
Looking for a trading tool based on the CCI indicator that can display crossovers arrows on all time frames? Introducing trading indicator : All Time Frame Double CCI Model T ready to help you achieve daily profits. This tool is created using the intersection of two CCI (Double CCI) indicator lines: the main CCI and the signal CCI. Using this tool makes it easier to observe the real-time dashboard and intersections of multiple timeframes simultaneously. Viewing both higher and lower timeframes
Looking for a trading tool based on the CCI indicator that can display crossovers arrows on all time frames? Introducing trading indicator : All Time Frame Double CCI Model S ready to help you achieve daily profits. This tool is created using the intersection of two CCI (Double CCI) indicator lines: the main CCI and the signal CCI. Using this tool makes it easier to observe the real-time dashboard and intersections of multiple timeframes simultaneously. Viewing both higher and lower timeframes
Looking for a trading tool based on the MACD indicator that can display crossovers arrows on all time frames? Introducing trading indicator : All Time Frame MACD Model T ready to help you achieve daily profits. This tool is created using the intersection of two indicator lines of MACD : the main MACD and the signal MACD. Using this tool makes it easier to observe the real-time dashboard and intersections of multiple timeframes simultaneously. Viewing both higher and lower timeframes simultaneou
Looking for a trading tool based on the MACD indicator that can display crossovers arrows on all time frames? Introducing trading indicator : All Time Frame MACD Model S ready to help you achieve daily profits. This tool is created using the intersection of two indicator lines of MACD : the main MACD and the signal MACD. Using this tool makes it easier to observe the real-time dashboard and intersections of multiple timeframes simultaneously. Viewing both higher and lower timeframes simultaneou
Looking for a trading tool based on the Stochastic indicator that can display crossovers arrows on all time frames? Introducing trading indicator : All Time Frame Stochastic Model T ready to help you achieve daily profits. This tool is created using the intersection of two indicator lines of Stochastic  : the main Stochastic  and the signal Stochastic . Using this tool makes it easier to observe the real-time dashboard and intersections of multiple timeframes simultaneously. Viewing both higher
Looking for a trading tool based on the Stochastic indicator that can display crossovers arrows on all time frames? Introducing trading indicator : All Time Frame Stochastic Model S ready to help you achieve daily profits. This tool is created using the intersection of two indicator lines of Stochastic  : the main Stochastic and the signal Stochastic . Using this tool makes it easier to observe the real-time dashboard and intersections of multiple timeframes simultaneously. Viewing both higher
Looking for a trading tool based on the RSI indicator that can display crossovers arrows on all time frames? Introducing trading indicator : All Time Frame Double RSI Model T ready to help you achieve daily profits. This tool is created using the intersection of two RSI (Double RSI) indicator lines: the main RSI and the signal RSI. Using this tool makes it easier to observe the real-time dashboard and intersections of multiple timeframes simultaneously. Viewing both higher and lower timeframes
Looking for a trading tool based on the RSI indicator that can display crossovers arrows on all time frames? Introducing trading indicator : All Time Frame Double RSI Model S ready to help you achieve daily profits. This tool is created using the intersection of two RSI (Double RSI) indicator lines: the main RSI and the signal RSI. Using this tool makes it easier to observe the real-time dashboard and intersections of multiple timeframes simultaneously. Viewing both higher and lower timeframes
Looking for a trading tool based on the moving average indicator that can display crossovers arrows on all time frames? Introducing trading indicator : All Time Frame Two MA Model T ready to help you achieve daily profits. This tool is created using the intersection of two moving average  indicator lines: the main MA1 and the signal MA2. Using this tool makes it easier to observe the real-time dashboard and intersections of multiple timeframes simultaneously. Viewing both higher and lower timef
Looking for a trading tool based on the moving average indicator that can display crossovers arrows on all time frames? Introducing trading indicator : All Time Frame Two MA Model S ready to help you achieve daily profits. This tool is created using the intersection of two moving average indicator lines: the main MA1 and the signal MA2. Using this tool makes it easier to observe the real-time dashboard and intersections of multiple timeframes simultaneously. Viewing both higher and lower timefr
Filter:
No reviews
Reply to review