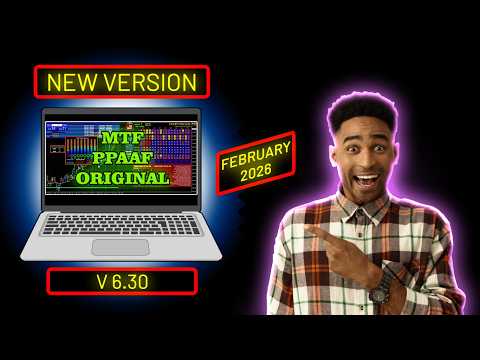
MTF Precise Price Action Arrow Filtered
- Indicators
- Anon Candra N
- Version: 4.70
- Updated: 3 April 2024
- Activations: 20
If you often lose trades because you only use one indicator, then try this trading tool. This trading tool uses more than one indicator. I often observe traders who only use the RSI indicator. Very often the market is oversold but still down or the market is overbought but still up. For this reason, you need to use more than one indicator. Introducing the new version V 4.70 MTF PPAAF : Multi Time Frame Precise Price Action Arrow Filtered. This trading tool uses various indicators to strengthen the direction of market movement.
The first indicator used in this trading tool is Dual Stochastic. Here, I use two Stochastics, namely Fast Stochastic and Slow Stochastic. In Fast Stochastic there is a Fast Stochastic main line and a Fast Stochastic signal line. Likewise, in Slow Stochastic there is a Slow Stochastic main line and a Slow Stochastic signal line. The intersection/crossover of the main line and signal line will form up and down arrows.
The second indicator is Double RSI, namely fast RSI and slow RSI. The intersection of the two will form an up and down arrow.
The third indicator is Double CCI, namely fast CCI and slow CCI. The intersection of the two will form an up and down arrow.
The fourth indicator is Dual MACD. Similar to dual Stochastic, here there are Fast MACD and Slow MACD. In Fast MACD there is a Fast MACD main line and a Fast MACD signal line. Likewise, in Slow MACD there is a Slow MACD main line and a Slow MACD signal line. The intersection of the main line and signal line will form up and down arrows.
The fifth indicator is RSIMA. As the name suggests, here the up and down arrows are determined by the intersection of the RSI line with the moving average (MA) line. If RSI > MA then the arrow is up and vice versa.
The sixth indicator is Six MA. Here I use six moving average lines, namely MA 1,2,3,4,5,6. The intersection of the MA 1 line with MA 2, the MA 3 line with MA 4 and the MA 5 line with MA 6 will form up and down arrows.
Based on the results of my research, many traders lose because they only use one indicator. That's why I created this trading tool. The six indicators that I have explained above will strengthen the direction of market movement.
Then, to see market movements in real time, I have added various TOP features :
1. Real time 9TF dashboard monitor. With this feature, you will see market movements in real time starting from the 1 minute time frame to the MN1 time frame. In the dashboard you will be able to see whether the main line is greater than the signal line or not, whether the fast RSI line is greater than the slow RSI line or not, whether the RSI line is all up or not, etc. You can also see whether the Stochastic, RSI and CCI levels are overbought or oversold. Knowing the OBOS (overbought oversold) level is very important.
2. On chart features. Monitoring visually is important. For this reason, I added the On chart Dual Stochastic, On chart Four MA, On chart Double RSI and On chart True RSIMA features. For your information, placing stochastics in the chart window is more accurate than placing stochastics in the sub window. Observing the intersection of the main line and signal line in real time in the chart window will make you confident in determining entry points and exit points. My principle is buy low sell high. Please remember that principle.
3. This trading tool can display ATF (all time frame) crossover arrows :
- Show ATF Stochastic, namely Stochastic main line x Stochastic signal line
- Show ATF MACD, namely MACD main line x MACD signal line
- Show ATF MA 1x2, namely moving average 1 x moving average 2
- Show ATF DRSI, namely Fast RSI x Slow RSI
- Show ATF RSIMA, namely RSI x MA
- Show ATF DCCI, namely Fast CCI x Slow CCI
4. Dashboard Trend Bar 5 Bar Ago Super Trend Arrows (STA). There are five trend bars that you can observe. The rightmost trend bar is the latest real time trend bar (0). Followed by the previous trend bar (1,2,3,4). This trend bar is useful for observing changes in the direction of market trends from the previous time frame to the current time frame.
5. Trend Following STF (selected time frame). Here you can choose the time frame according to your wishes. If two lines cross each other, an arrow appears. Plus the trend following arrow will appear if the angles of the two lines are all positive (UP) or all negative (Down).
6. Pivot levels feature. Pivot levels act like S & R, namely Support and Resistance.
7. Replay System. With this feature you can go back in time, observing the condition of the 9TF dashboard on a certain day and time. Suppose you want to analyze why at 2023.10.11 14:21:30 the market sells. To use this feature, open your Meta Trader 4 chart in a lower timeframe, for example M5.
8. Candle HTF (High Time Frame). With this feature you can see market movements in the high time frame (for example H1) when you open the chart in the lower time frame (I like opening it at M5).
9. TSPI (Time Spread Profit Info). With this feature you can see in real time the current time, spread, profit/loss and percentage of profit/loss.
10. On/off button feature. With this feature you can show or hide this trading tool with just one click. Interesting right?
11. 20 dashboard color schemes that you can choose from. With this feature, you can choose a dashboard color that matches the color of your chart.
12. Customizable parameter. All parameters used in calculating indicators can be adjusted according to your wishes. You can use stochastic parameters 14,3,3 or 5,3,3 etc. Or you use the default settings.
13. MTF, namely Multi Time Frame. You can set a time frame according to your wishes. For example, you want to activate the dual stochastic on chart feature on the M5 and H1 time frames. You can!
14. Non Repaint Arrows (NRPA). If two lines intersect at any time then the crossover arrow will appear. Very often, because of high volatility, in the following seconds and minutes, the two lines do not intersect. As a result, the arrow that appeared earlier then disappeared. This is a very important feature. Remember that during high volatility, the arrow that was previously up can become down. The arrow that had previously appeared could disappear in an instant. That's why my message is to validate using the real time 9TF dashboard monitor!
15. MTF Belt Trend. You can set a time frame according to your wishes.
16. Dual MTF Cloud Histo. There are two MTF histogram. You can set a time frame according to your wishes.
17. Dashboard 3TF of True RSIMA.
Using only one trading indicator is not very convincing. That's why we combine several indicators to strengthen our analysis on market direction.
The price action movement can then be filtered using any of 6 indicator :
- RSIOMA
- Dual MACD (New version 1.3!)
- Dual Stochastic (New version 1.3!)
- Double CCI (New version 2.3!)
- Six Moving Average (New version 4.5! Not just four ma)
- Double RSI (New version 1.2!)
The strength of the direction of price action movement can then be conclude by monitoring the real time 9TF dashboard.
The 9TF dashboard monitor shows us the real time data of Four Moving Average, RSIMA, Double RSI, Dual MACD, Dual Stochastic, and Double CCI.
- One click button, to show or hide the indicator
- 9TF real time dashboard monitor
- Monitoring 9TF Six Moving Average, i.e MA 1x2, MA 3x4 and MA 5x6
- Monitoring whether fast MA line above or below slow MA line
- Monitoring the angle of fast MA & slow MA
- Monitoring 9TF Double RSI, i.e Fast RSI and Slow RSI
- Monitoring whether fast RSI line above or below slow RSI line
- Monitoring 9TF Dual MACD, i.e Fast MACD (MACD 1) above or below Slow MACD (MACD 2) & are up or down
- Monitoring whether main MACD line above or below signal MACD line
- Monitoring 9TF Dual Stochastic, i.e Fast Stochastics (Stochastics 1) above or below Slow Stochastics (Stochastics 2) & are up or down
- Monitoring whether main Stochastic line above or below signal Stochastic line
- Monitoring 9TF Double CCI, i.e the position on OBOS line & the current movement
- Monitoring 9TF RSIOMA, i.e RSI line above or below MA line
- Ability to set parameter & choose the time frame as you wish
- Ability to show/hide legend
- Ability to increase/decrease the number of bar, default is 800 bar
- Ability to select up to 20 dashboard color scheme
- This indicator can display the RSIMA arrow for the timeframe you chose
- This indicator can display the MACD arrow for the timeframe you chose
- This indicator can display the Stochastic arrow for the timeframe you chose
- This indicator can display the MA 1x2 and MA 3x4 arrow for the timeframe you chose
- This indicator can display the Double RSI arrow for the timeframe you chose
- This indicator can display the Double CCI arrow for the timeframe you chose
- Non repaint arrows
- MTF, i.e timeframe can be changed
- Ability to show all timeframe arrows or just selected timeframe only
- Ability to monitor RSI divergence accurately
- Ability to monitor Pivot Level of all timeframe
- Ability to Go Back in Time!
- Ability to see the price action of Candle High Timeframe
- Monitoring MACD value above or below zero level
- Accurate Trading in the zone vertical lines and horizontal line
[New Feature 1.70] Ability to monitor visually using on chart stochastic, on chart four ma improve, on chart double rsi and on chart true rsima.
[New Feature 1.80] Ability to analyze the indicators at certain time e.g you want to analyze why three days ago or five days ago the price action is up/down and you want to see the dashboard monitor at that time (let's say at 2023.06.14 10:23:46). It's very easy to go back in time!.
[New Feature 1.80] Ability to monitor S & R of all time frame via Pivot Level. This value gives you current upper bound and lower bound.
[New Feature 1.80] Completing the dual stochastic by adding slow stochastic on chart which will give you more confident during live trading.
[New Feature 1.80] Adding MTF candle high time frame e.g you can monitor the price action of candle H4 while opening the chart in M5.
[New Feature 1.90] Adding Super Trend Arrows (STA) Higher Timeframe. Trade in lower timeframe e.g M5 while monitoring STA higher timeframe is absolutely profitable.
[New Feature 2.00] Adding Confluence Arrows of 3 Timeframe Double RSI. Choose 3TF from 12 available timeframe schemes e.g M15,M30,H1 then up arrows (indicate by unfilled square symbols) means fast RSI is above slow RSI in selected timeframe, i.e M15,M30,H1.
[New Feature 2.10] Adding timeframe scheme D1,W1,MN1 for conflux DRSI.
[New Feature 2.20] Adding upper bound 100 & lower bound 0 of on chart dual Stoch and on chart double RSI. This is very important feature for monitoring visually.
[New Feature 2.30] Adding Mode 28, i.e trading in the zone. Adding 9TF double CCI dashboard monitor and crossover arrows. Adding STA monthly arrows. Adding three dashboard color scheme.
[New Feature 2.40] Adding confluence of 3TF Fast Dual Stochastic. Adding confluence of 3TF Fast Dual MACD. Adding trend following selected timeframe of Double RSI. Adding super trend arrow (STA) monitor H1,H4,D1,W1,MN1 from top to bottom.
[New Feature 2.50] Adding confluence of 3TF MA 1x2. For example, if MA 1 > MA 2 in TF scheme M5,H4,D1 then the arrow is up and vice versa.
[New Feature 2.60] Adding STF belt trend. This trend will be useful for determining entry point on lower timeframe such as 5 minute.
[New Feature 2.80] Adding Time Spread Profit Info (TSPI) indicator. This indicator will show you the spread, the remaining time to bar close, the total profit or loss and the percentage of profit or loss.
[New Feature 2.90] Adding Mode 29 : Show ATF Fast Stoch DRSI. Adding STA calculation mode.
[New Feature 3.10] Can show all time frame crossover arrows of fast CCI and slow CCI. Activate mode 6.
[New Feature 3.30] Trend Bar 9TF of STA mode 2 (fast RSI cross slow RSI) starting from current timeframe (0) to previous 1 bar ago (1) up to previous 4 bar ago (4). Trend Bar is useful to monitor trend changes in the market.
[New Feature 3.50] You can now turn on and off the trend following arrows.
[New Feature 3.60] My favorite arrow.
[New Feature 3.90] On Chart Dual Double RSI. MTF Trend Bar Trend Following 3TF of Stochastic/RSI. Trend Bar Average 3TF Stochastic/RSI. MTF Trend Bar Trend Following MA5xMA6. Trend Bar Average MA5xMA6.
[New Feature 4.00] Background color for trend bar 3TF. Mode 8 : Show ATF crossover arrows MA 1x2 and DRSI.
[New Feature 4.20] Histogram of MTF Belt Trend.
[New Feature 4.40] Trend Bar & Dashboard of True RSIMA. Vertical lines trading in the zone. Local computer time & broker time.
[New Feature 4.50] Dashboard 3TF True RSIMA. Dual MTF Cloud Histo. Pivot value horizontal line trading in the zone. Total mode right now is 13 (previously 9).
[New Feature 4.60] Dual MTF Belt Trend with trend following.
🟡 Learn old version here :
▶️ V 4.40 ▶️ V 4.10 ▶️ V 4.00 ▶️ V 3.90 ▶️ V 3.80 ▶️ V 3.70 ▶️ V 3.60 ▶️ V 3.50 ▶️ V 3.40 ▶️ V 3.30 ▶️ V 3.20 ▶️ V 3.10 ▶️ V 3.00 ▶️ V 2.90 ▶️ V 2.80 ▶️ V 2.70 ▶️ V 2.60 ▶️ V 2.50 ▶️ V 2.40 ▶️ V 2.30 ▶️ V 2.20 ▶️ V 2.10 ▶️ V 2.00 ▶️ V 1.90 ▶️ V 1.80 ▶️ V 1.70 ▶️ V 1.60 ▶️ V 1.50 ▶️ V 1.40 ▶️ V 1.30 ▶️ V 1.20 ▶️ V 1.10There are 13 total modes to chose:
- 1. Show ATF RSIMA
- 2. Show ATF STOCH
- 3. Show ATF DRSI
- 4. Show ATF MACD
- 5. Show ATF DCCI
- 6. Show ATF MA 1x2
- 7. Show ATF MA 3x4
- 8. Show ATF MA 1x2 STOCH
- 9. Show ATF MA 1x2 DRSI
- 10. Show ATF MA 3x4 STOCH
- 11. Show ATF MA 3x4 DRSI
- 12. Show ATF STOCH DRSI
- 13. Show Normal Mode
>> For best setting price action trading tool :
- Trade on M5
- Trading in the zone (H4,H4,H4,H4)
- Wait arrow of Dual MTF Belt Trend to appear in the direction of trading in the zone
- Set Dual MTF Cloud Histogram to M15 & M30
- Activate On Chart Dual DRSI
- Validate using real time 9TF dashboard monitor
This indicator has gone through a series of trials. The programming codes have been written with great care.
Make confident entries with the best Non Repaint Price Action trading indicator MTF PPAAF.
Get now and trade like a pro.
Thank you.
#StochasticRSI #marketstructure #priceaction #bestrsi #rsima #rsioma #stochrsicci #stochrsi #movingaveragedashboard #movingaveragersi #crossoverdashboard #priceactionindicator #macd