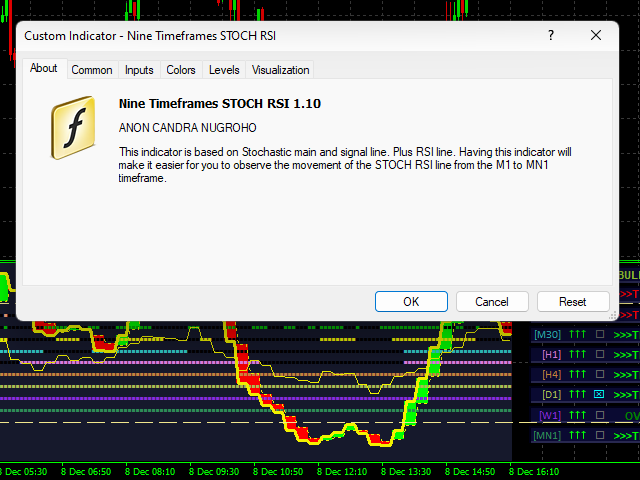
Nine Timeframes Stoch RSI
- インディケータ
- バージョン: 1.10
- アップデート済み: 9 12月 2022
- アクティベーション: 15

1 つのウィンドウで通貨ペアの複数の時間枠を分析すると、混乱する可能性があります。
複数の時間枠を分析するには、信頼できるインジケーターが必要です。
それらの 1 つは 9TF STOCH RSI を使用しています。
シンプルでありながら信頼性が高く、1 つのインジケーターで 9 つの時間枠すべてをカバーするコードを作成するために、昼夜を問わず取り組んできました。
このインジケーターの利点のいくつかを見てみましょう。
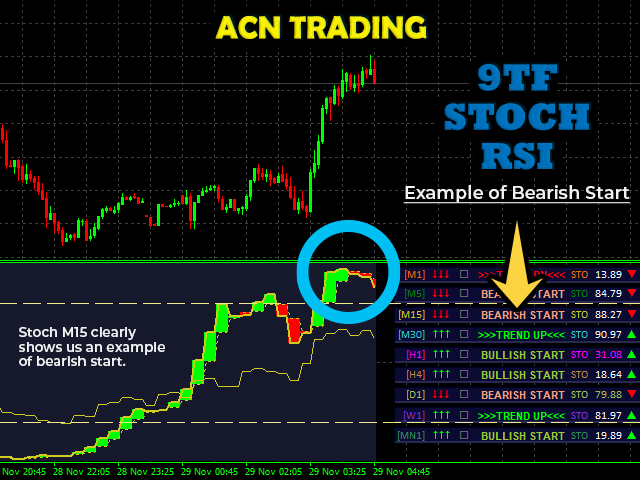
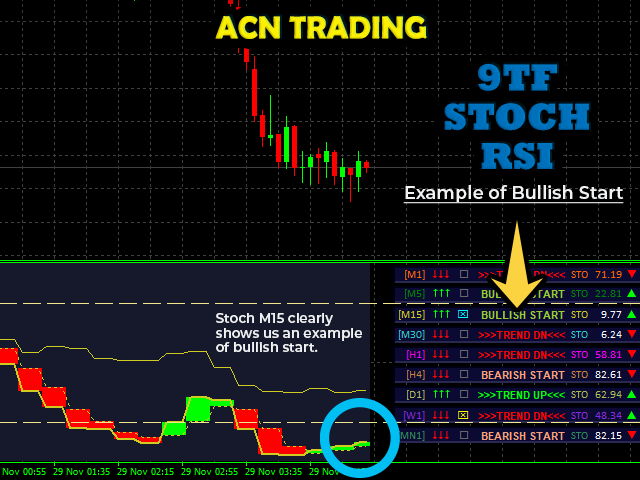
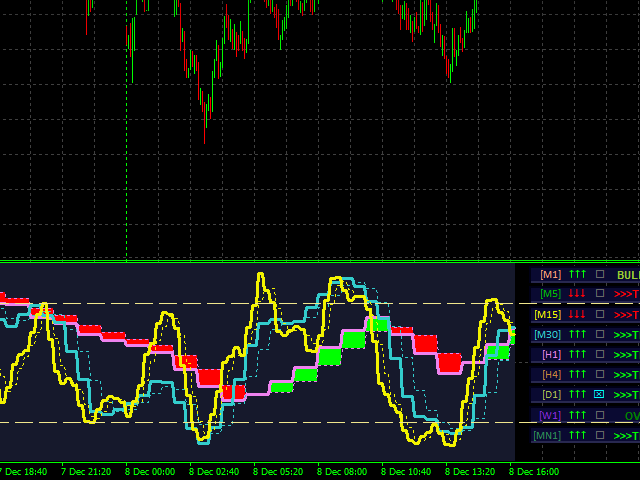
カラフルなヒストグラム。
各時間枠の曲線の色は互いに異なります。
STOCHASTICメインラインとシグナルラインの交差を示す矢印。 (注: 最後に表示される矢印は無視してください!)
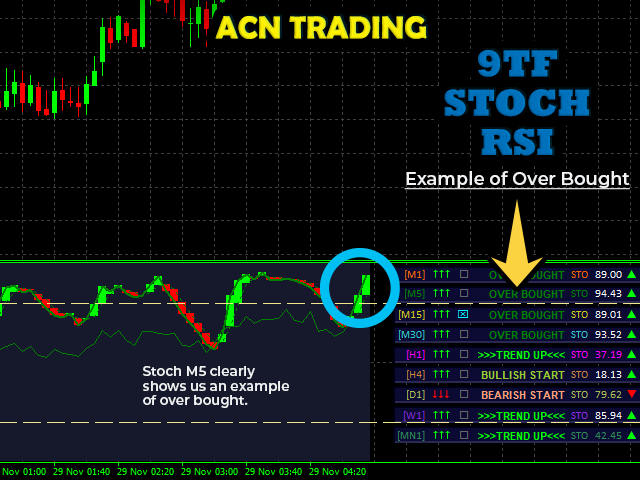
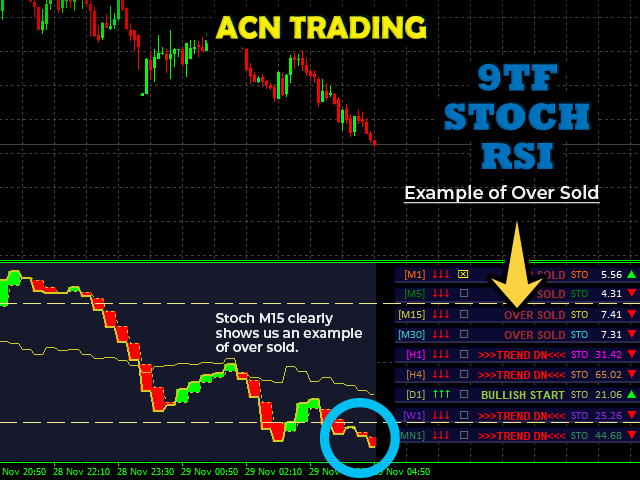
OBOS レベルライン。
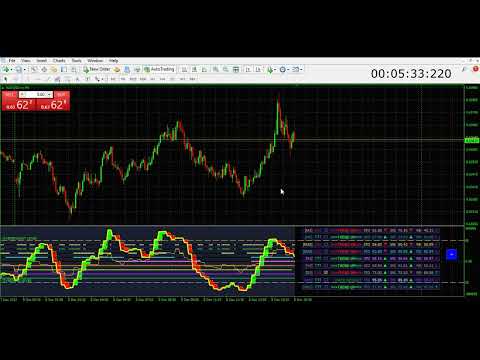
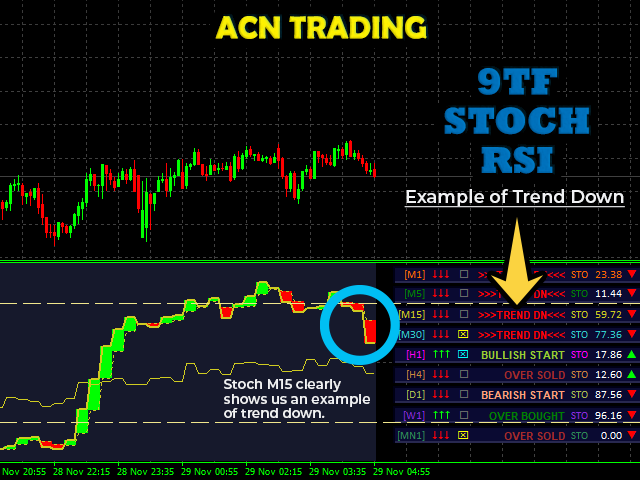
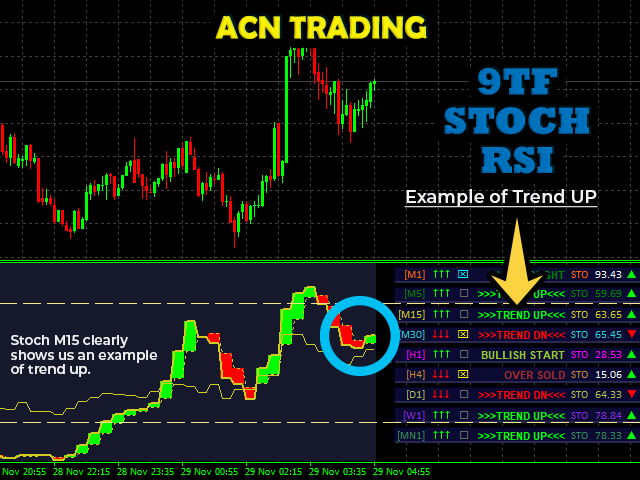
リアルタイム 9TF ダッシュボード モニター。
ある時間枠から別の時間枠に変更しても、9TF ダッシュボード モニターの計算は非常に正確です。
どの曲線が買われ過ぎのレベルを上回っており、どの曲線が売られ過ぎのレベルを下回っているかを監視します。
メイン STOCH が信号 STOCH を上回っているか、またはその逆であるかを曲線で監視します。
メイン STOCH と信号 STOCH の間に交差があるかどうか曲線を監視します。
前の信号で現在の信号の動きを監視します。 上昇中または下降中。 (注: これはスキャルピングにとって非常に重要な機能です!)
RSI ラインの動きを監視します。
長期的なトレンドを見つけるための非常に重要なトレンド バー機能です。
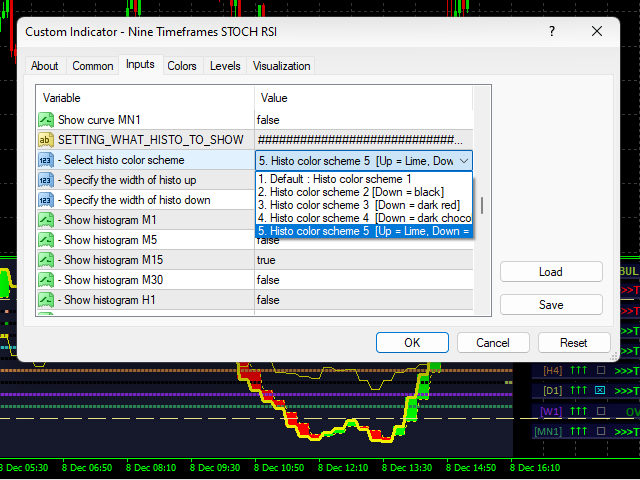
色を変える能力。
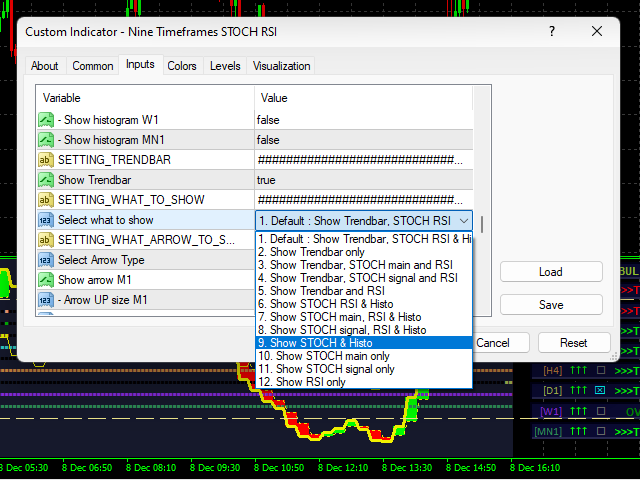
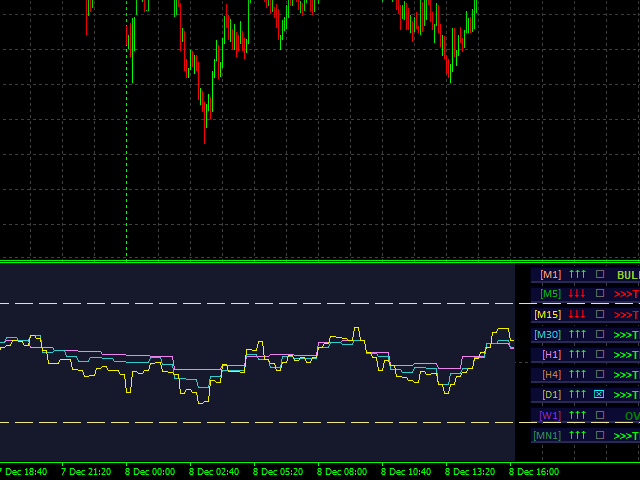
表示する曲線を選択する機能。
表示するヒストグラムを選択する機能。
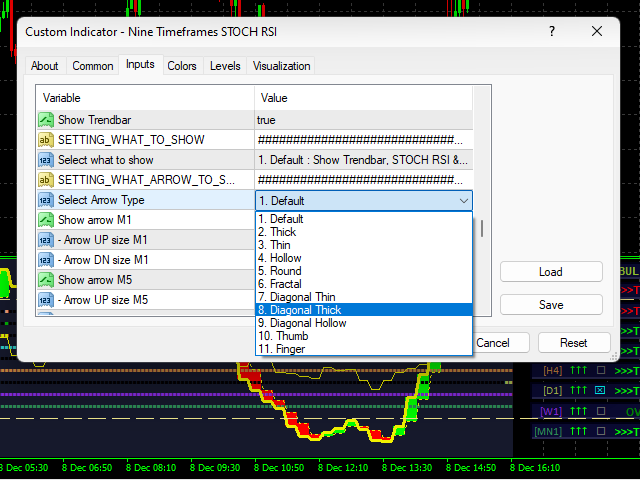
表示する矢印を選択する機能。
9TF ダッシュボード モニターを希望の場所に配置する機能。
ボタンを 1 回クリックするだけでインジケーターを表示または非表示にする機能。
高い時間枠から短い時間枠までの価格行動の動きを監視する機能。
外国為替、指数、金属/エネルギー、株式、暗号通貨の分析に使用できます。
私のYouTubeチャンネルでフル機能を見ることができます. 隠すことは何もない。
この指標を作成する私の意図は、あなたの勝利と利益を増やすことです.
最高の STOCH RSI 取引指標で自信を持ってエントリーしましょう。
今すぐプロのように取引しましょう。
ありがとうございました。