Nine Timeframes Stoch RSI
- 지표
-
Anon Candra N
 I am a professional trader who has been in the stock market for several years. After making in-depth observations of the stock market, I developed the trading tools that have helped my trading career so far. The good news is, you can have these trading tools on this website.
 - 버전: 1.10
- 업데이트됨: 9 12월 2022
- 활성화: 15
하나의 창에서 통화 쌍의 여러 시간 프레임을 분석하면 혼란스러울 수 있습니다.
여러 시간 프레임을 분석하려면 신뢰할 수 있는 지표가 필요합니다.
그중 하나는 9TF STOCH RSI를 사용하고 있습니다.
나는 단순하지만 신뢰할 수 있고 단 하나의 지표에서 9개의 시간 프레임을 모두 다루는 코드를 만들기 위해 밤낮으로 노력했습니다.
이 표시기의 몇 가지 장점을 살펴보겠습니다.
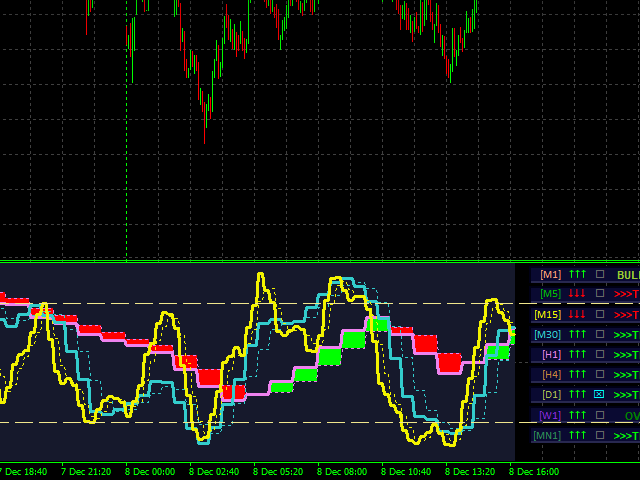
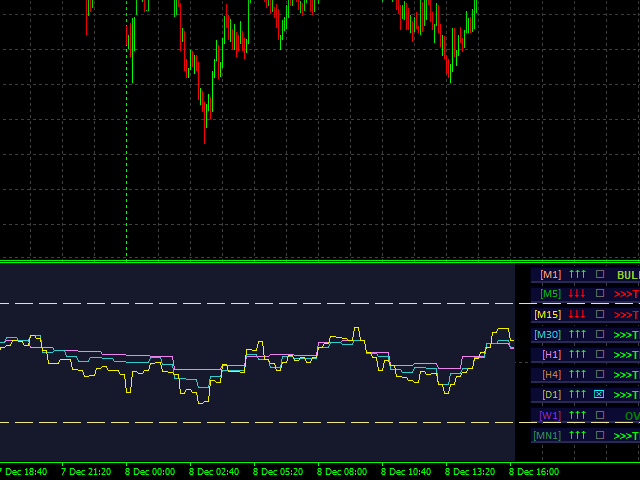
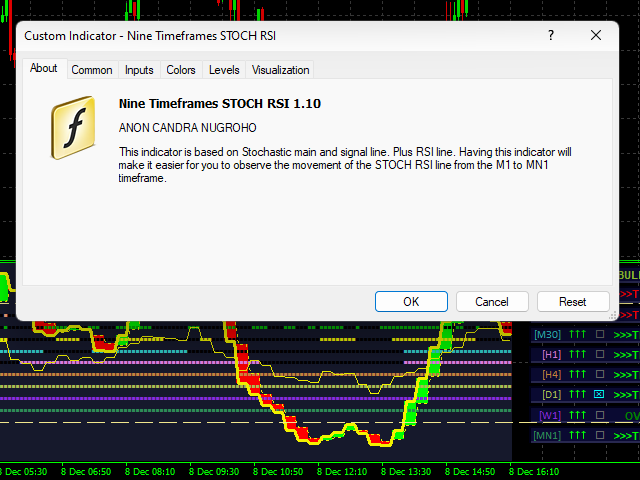
다채로운 히스토그램.
각 기간의 곡선 색상은 서로 다릅니다.
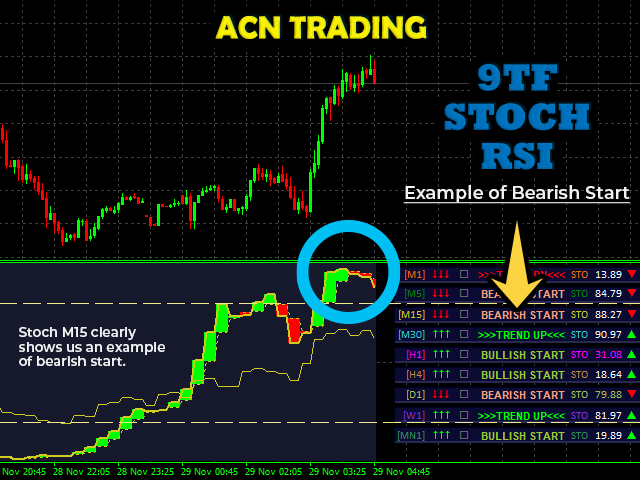
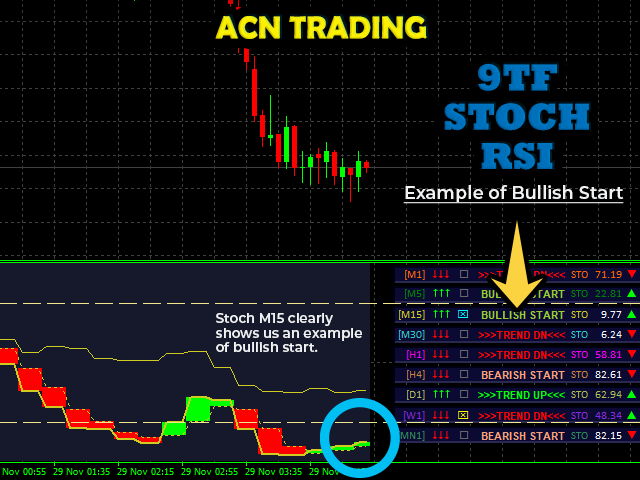
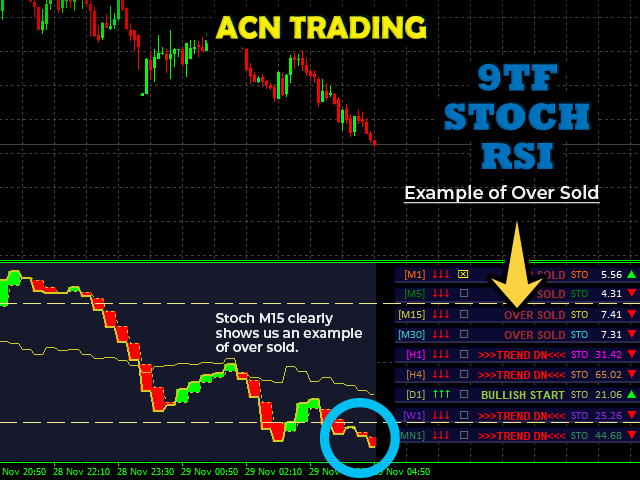
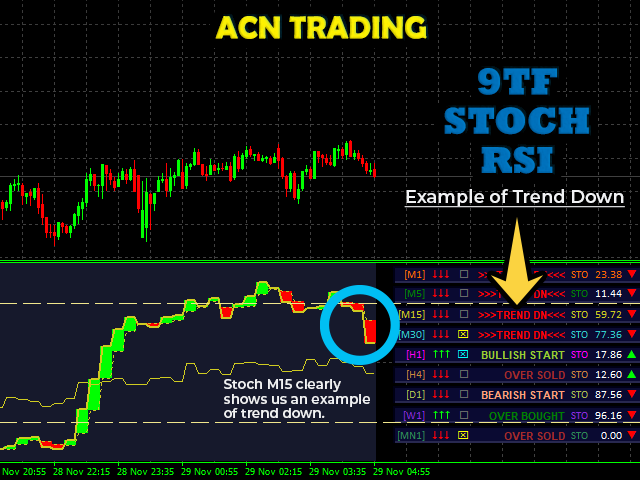
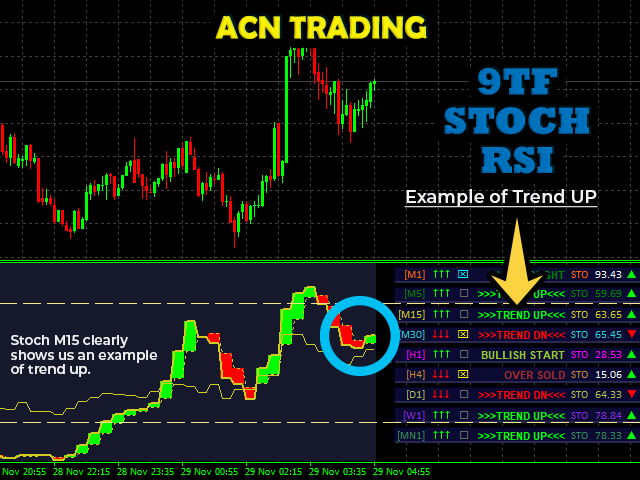
STOCHASTIC 본선과 신호선의 교차점을 나타내는 화살표. (참고: 나타나는 마지막 화살표는 무시하십시오!)
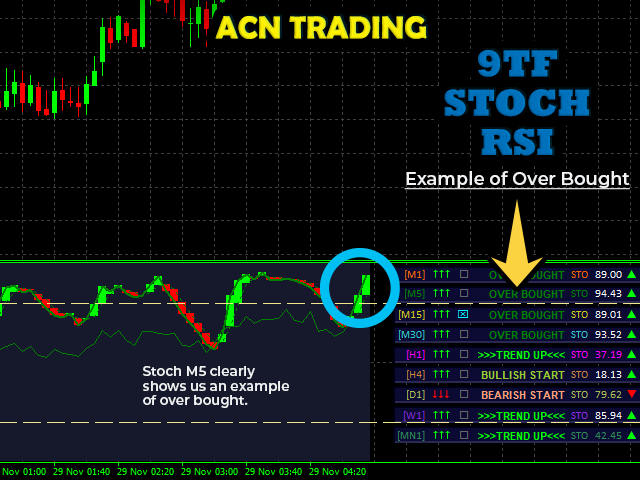
OBOS 레벨 라인.
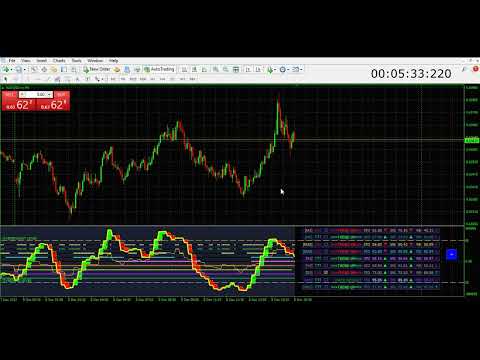
실시간 9TF 대시보드 모니터.
9TF 대시보드 모니터 계산은 한 시간 프레임에서 다른 시간 프레임으로 변경하더라도 매우 정확합니다.
어떤 곡선이 과매수 수준 위에 있고 과매도 수준 아래에 있는지 모니터링합니다.
메인 STOCH가 신호 STOCH 위에 있는지 또는 그 반대인지 곡선을 모니터링합니다.
메인 STOCH와 신호 STOCH 사이에 교차가 있는지 곡선을 모니터링합니다.
이전 신호로 현재 신호의 움직임을 모니터링합니다. 상승 중이거나 하락 중입니다. (참고: 이것은 스캘핑에 매우 중요한 기능입니다!)
RSI 라인의 움직임을 모니터링합니다.
장기 추세를 파악하는 데 매우 중요한 추세 막대 기능입니다.
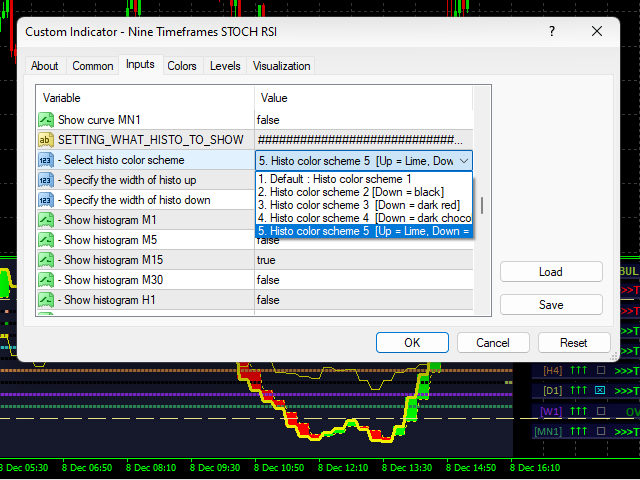
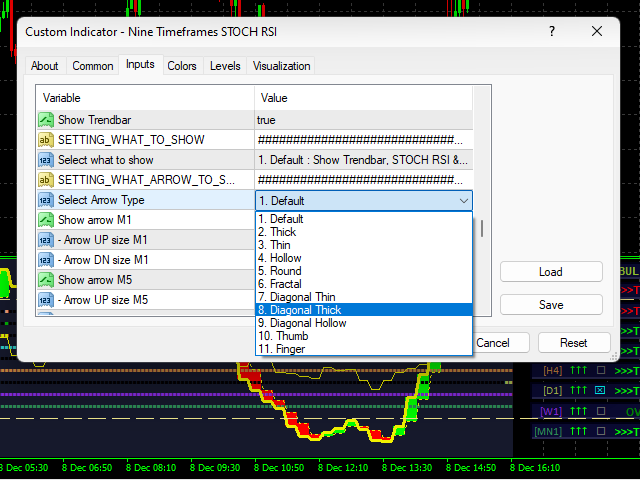
색상을 변경하는 기능.
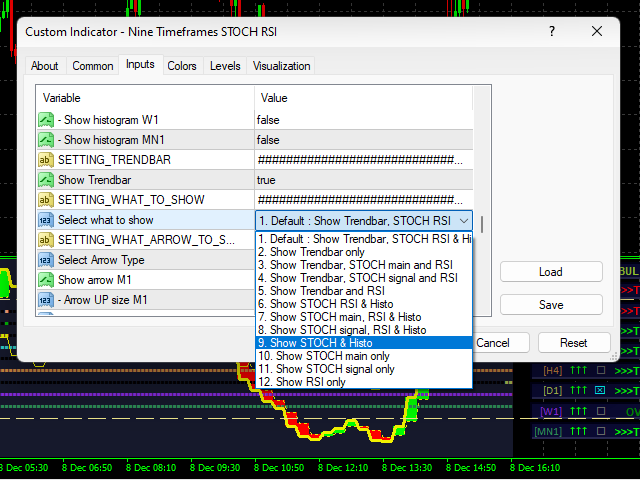
표시할 곡선을 선택하는 기능.
표시할 히스토그램을 선택하는 기능.
표시할 화살표를 선택하는 기능.
원하는 위치에 9TF 대시보드 모니터를 배치할 수 있는 기능.
한 번의 클릭 버튼으로 지표를 표시하거나 숨길 수 있습니다.
더 높은 시간 프레임에서 작은 시간 프레임으로 가격 행동 움직임을 모니터링하는 기능.
외환, 지수, 금속/에너지, 주식 및 암호화폐를 분석하는 데 사용할 수 있습니다.
내 YouTube 채널에서 전체 기능을 볼 수 있습니다. 숨길 것이 없습니다.
이 지표를 만드는 나의 의도는 당신의 승리와 이익을 늘리는 것입니다.
최고의 STOCH RSI 거래 지표로 자신 있게 입력하세요.
지금 구매하여 전문가처럼 거래하십시오.
고맙습니다.