Dashboard Multi Currency MTF Stochastic
- Indicators
-
Anon Candra N
 I am a professional trader who has been in the stock market for several years. After making in-depth observations of the stock market, I developed the trading tools that have helped my trading career so far. The good news is, you can have these trading tools on this website.
 - Version: 1.50
- Updated: 6 February 2025
- Activations: 20
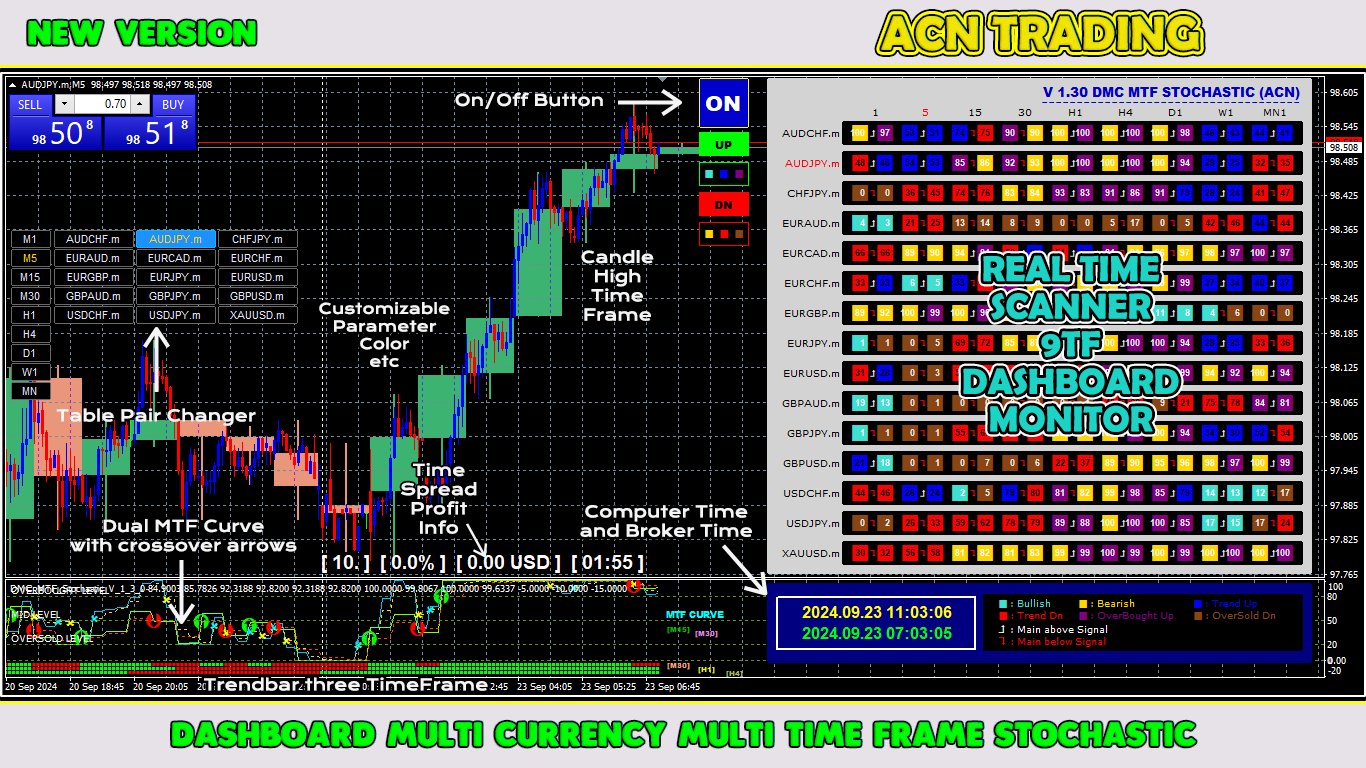
With this trading tool, you can scan 15 markets simultaneously.
Introducing, new trading indicator 2024 :
➡️ Dashboard Multi Currency Multi Time Frame Stochastic.
There are at least two reasons why I created this trading tool :
- First, I'm bored of only observing one market.
- Second, I don't want to lose the entry moment in another market.
That's why I want to know other market conditions at the same time.
For this reason, I need a scanner that can scan the conditions of several markets simultaneously.
I often look for markets where the stochastic main line > (or <=) stochastic signal line starts from M1 to H4 (or just M1 to M30).
If you agree with my analysis, then this is the trading indicator you have been looking for.
Don't miss the moment when market conditions meet the requirements above.
How to use this tool :
1. BUY if the trend bar M30 and H1 all UP (lime color)
2. Strong BUY if the trend bar M30, H1 and H4 all UP (lime color)
3. SELL if the trend bar M30 and H1 all DOWN (red color)
4. Strong SELL if the trend bar M30, H1 and H4 all DOWN (red color)
5. When the distance is far from the crossover, be careful.
6. Validate using real time 9TF dashboard monitor
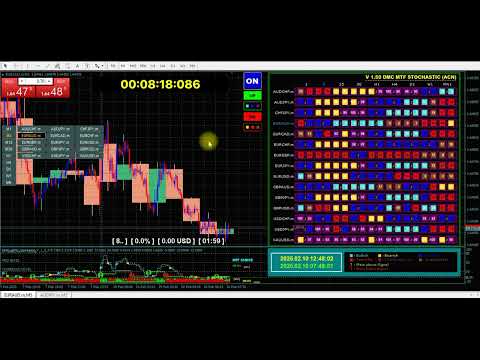
This is a scanner or dashboard of stochastic with a lot of great features :
- Can show the data of stochastic main line
- Can show the data of stochastic signal line
- Can show the position of stochastic main line and signal line (main line above signal line or main line below signal line)
- Can show the data level of both stochastic main line and signal line (bullish, bearish, trend up, trend down, overbought but still up and oversold but still down)
- Can show real time data from M1 to MN
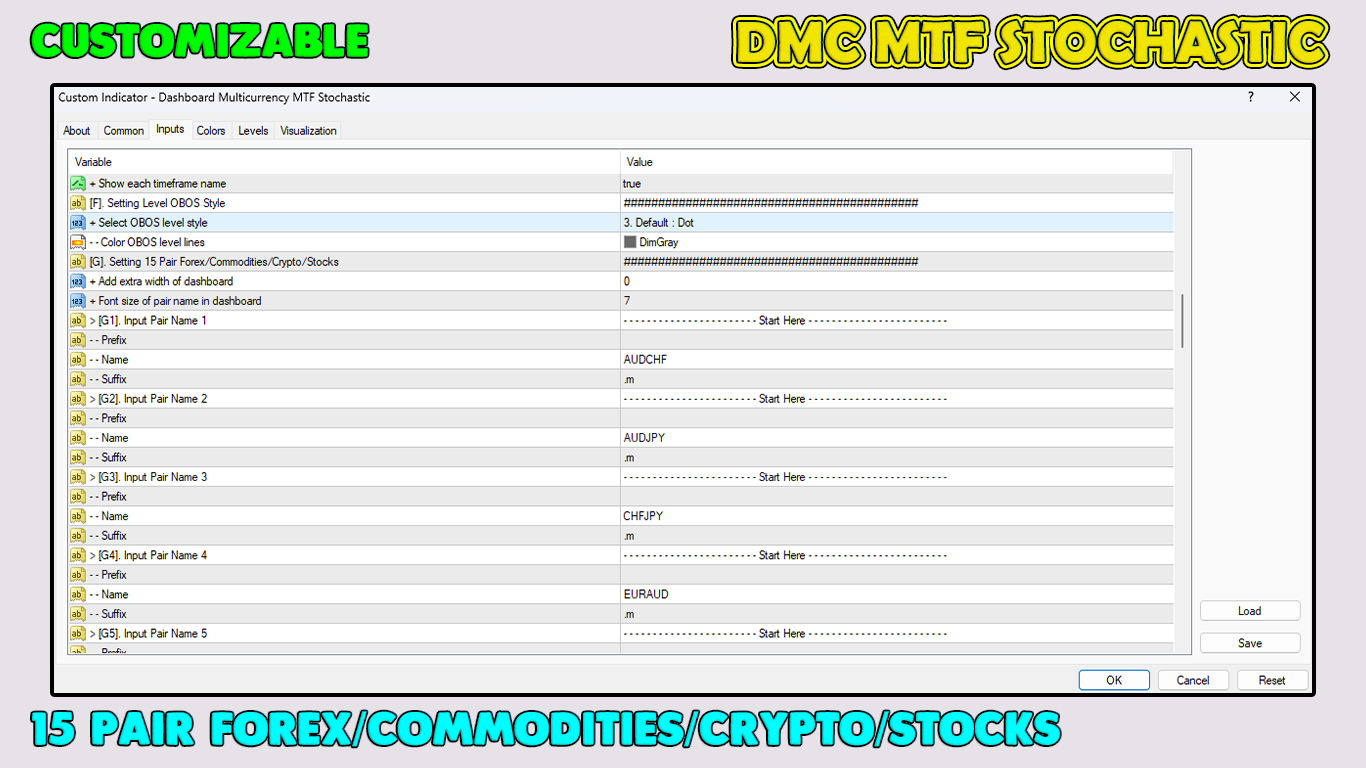
- Can show the data of 15 currency pair (multicurrency forex/commodities/crypto/stocks)
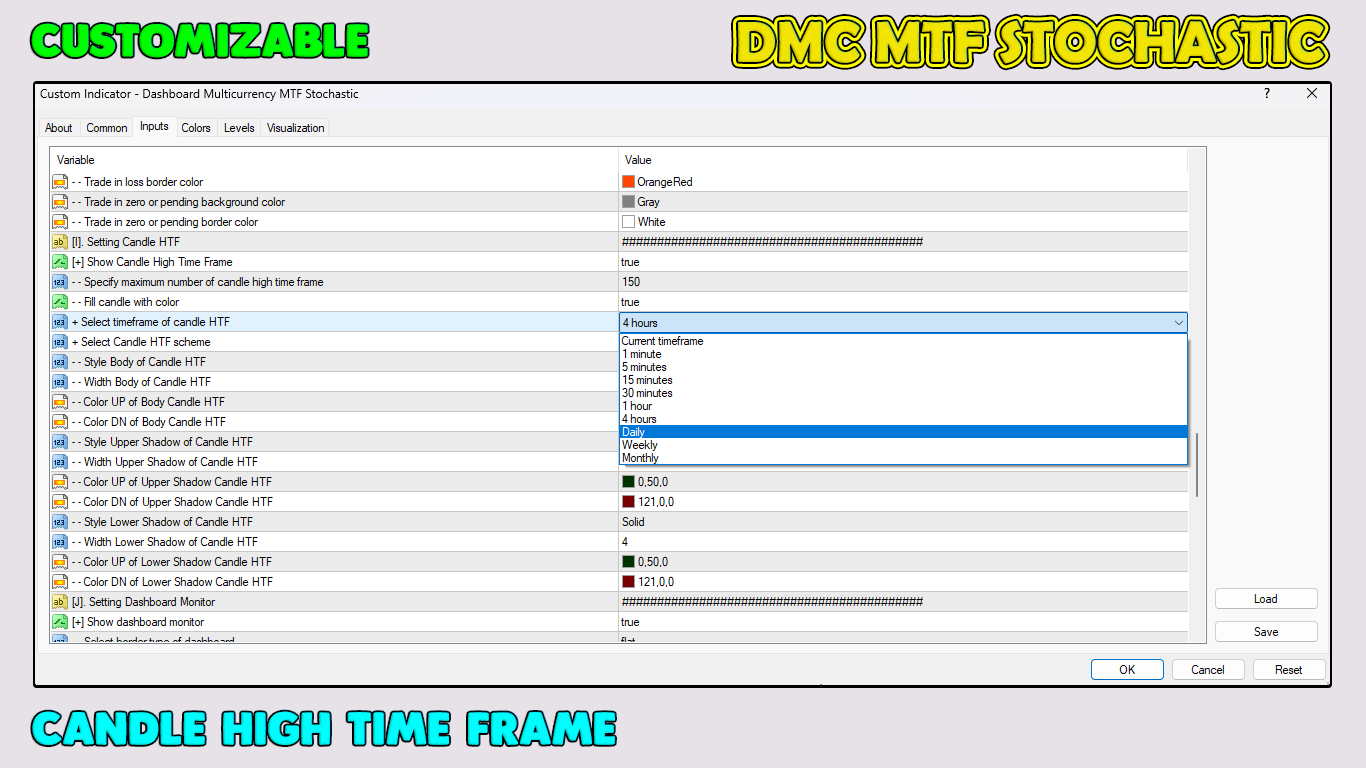
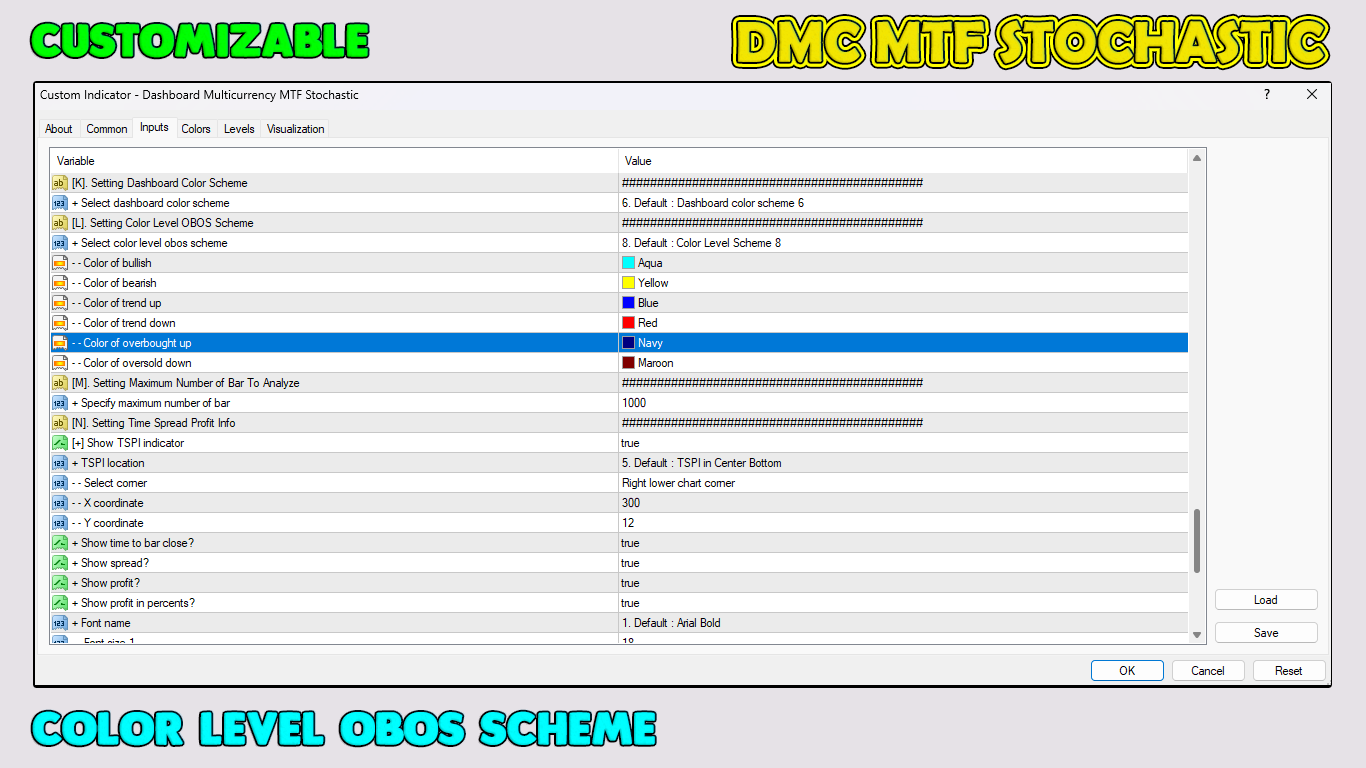
- Customizable parameter
- Customizable color OBOS level
- Beautiful 20 dashboard color scheme
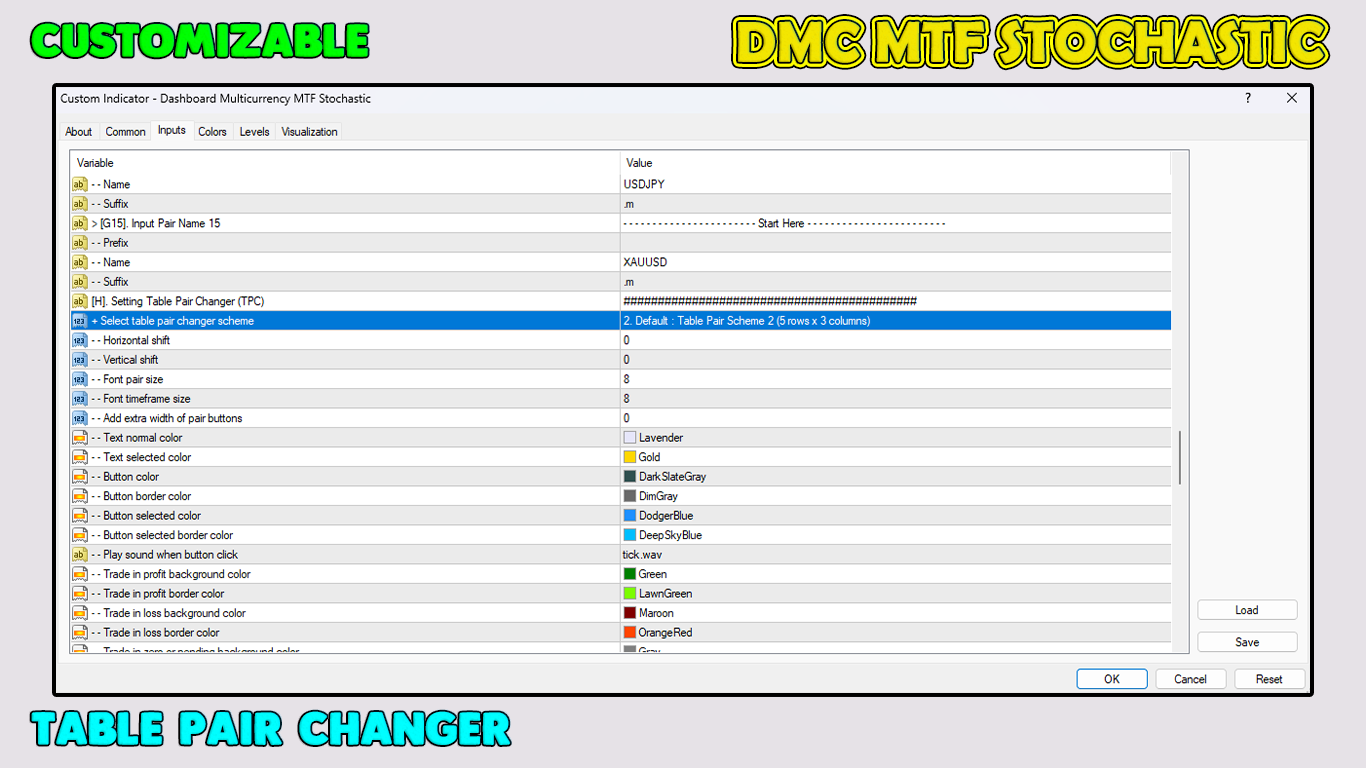
- Equipped with on/off currency pair changer
- Equipped with candle high time frame
- Equipped with time spread profit info
- Equipped with current local computer time and broker time
- Equipped with dual MTF stochastic curve
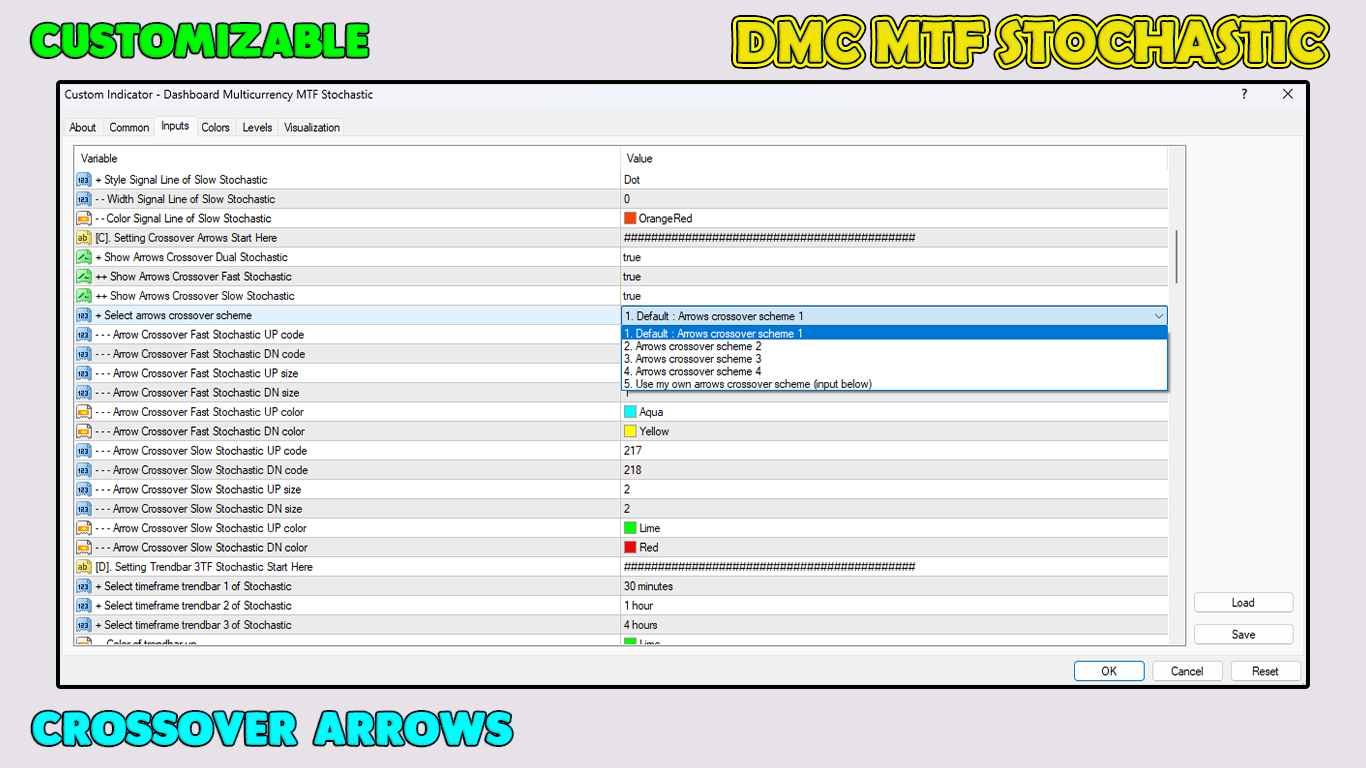
- Equipped with crossover arrows of dual MTF stochastic curve
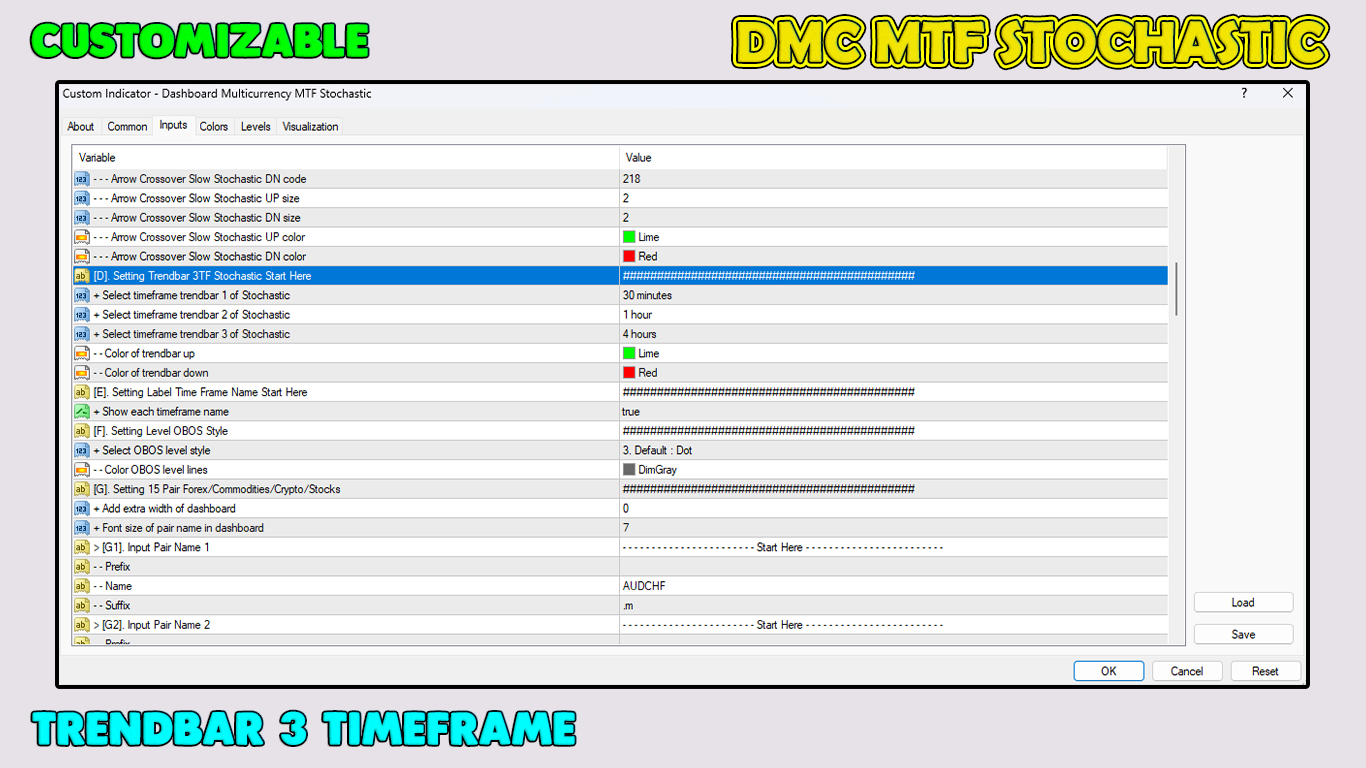
- Equipped with trend bar 3TF stochastic
This trading tool is absolutely what every trader needs.
Download today.
Make confident entries and trade like a pro!
Thank you.
Take advantage of this promotional price.
This trading tool with various advanced features should be sold at a price of $200.
So, buy this trading indicator NOW!
#dashboardstochastic #multicurrency #multitimeframe #stochastictradingstrategy