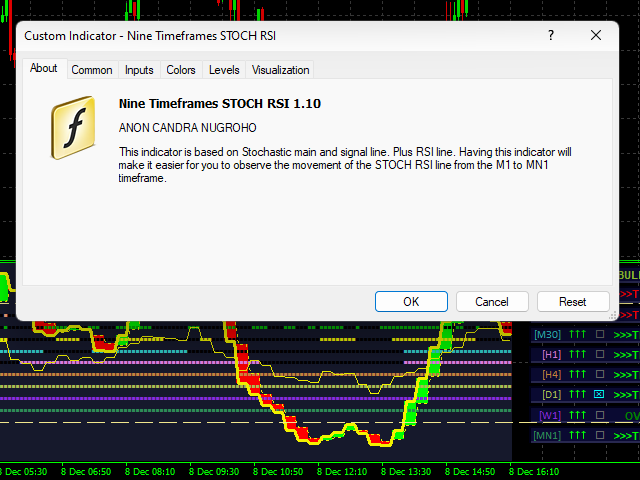
Nine Timeframes Stoch RSI

Analisar vários intervalos de tempo de um par de moedas em uma janela pode deixá-lo confuso.

Para analisar vários intervalos de tempo, você precisa de indicadores confiáveis.

Um deles está usando 9TF STOCH RSI.

Tenho trabalhado dia e noite para criar um código simples, mas confiável, que cubra todos os nove intervalos de tempo em apenas um indicador.

Vejamos algumas das vantagens deste indicador:

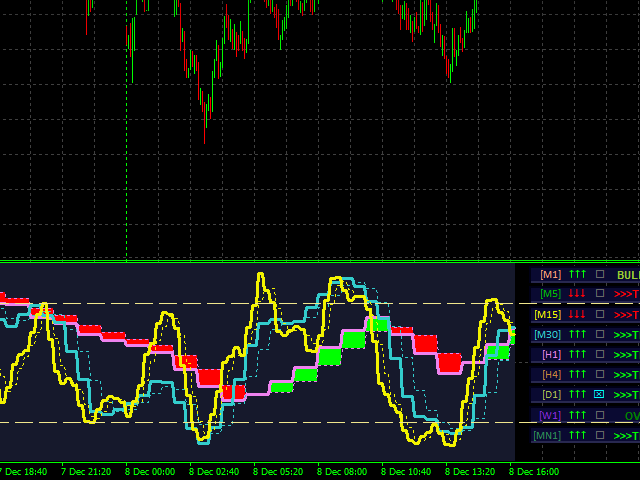
Histograma colorido.
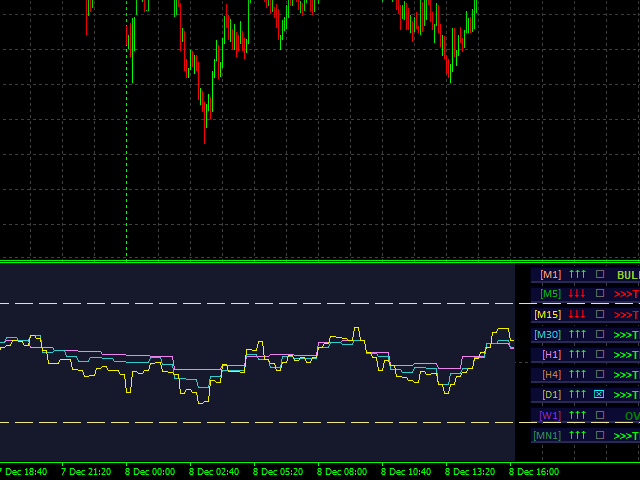
A cor da curva em cada timeframe é diferente uma da outra.
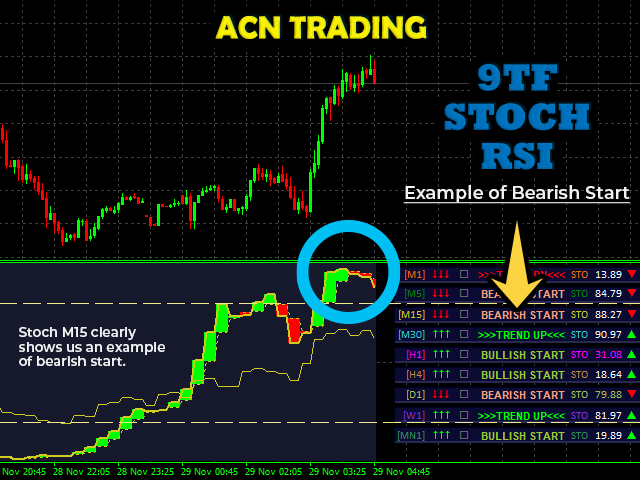
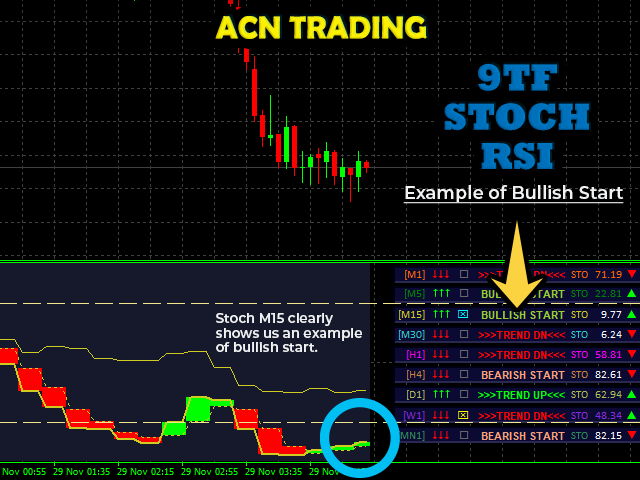
Setas indicando o cruzamento da linha principal ESTOCÁSTICA e linha de sinal. (Nota: Ignore a última seta que aparece!)
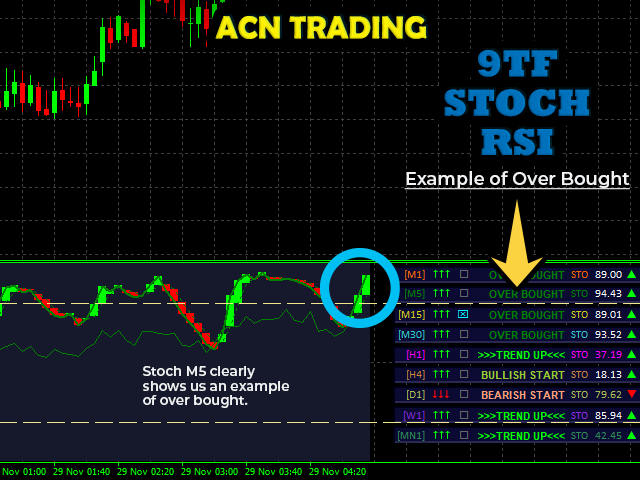
Linha de nível OBOS.
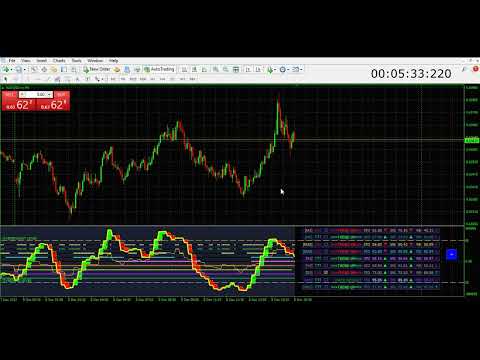
Monitor de painel 9TF em tempo real.
Os cálculos do monitor do painel 9TF são muito precisos, mesmo se você mudar de um período de tempo para outro.
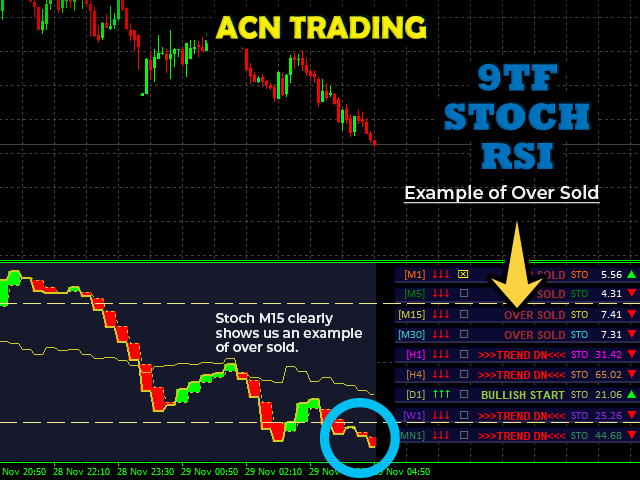
Monitorando qual curva está acima do nível de sobrecompra e qual está abaixo do nível de sobrevenda.
Monitorando a curva se o STOCH principal está acima do sinal STOCH ou vice-versa.
Monitorando a curva se há cruzamento entre o STOCH principal e o sinal STOCH.
Monitorando o movimento do sinal atual com o sinal anterior. Na subida ou na descida. (Nota: Este é um recurso muito importante para escalpelamento!)
Monitorando o movimento da linha RSI.
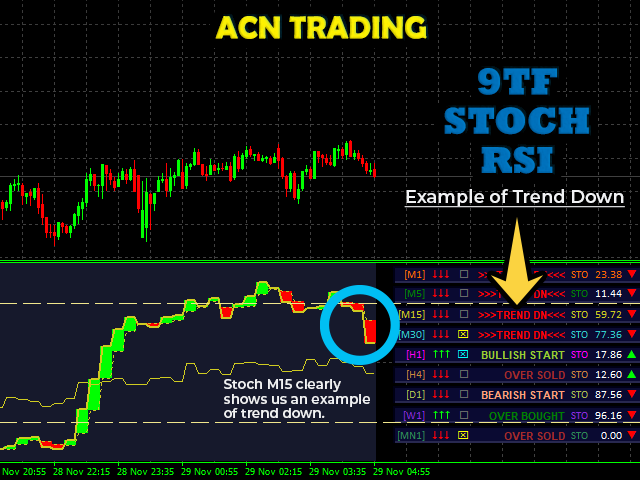
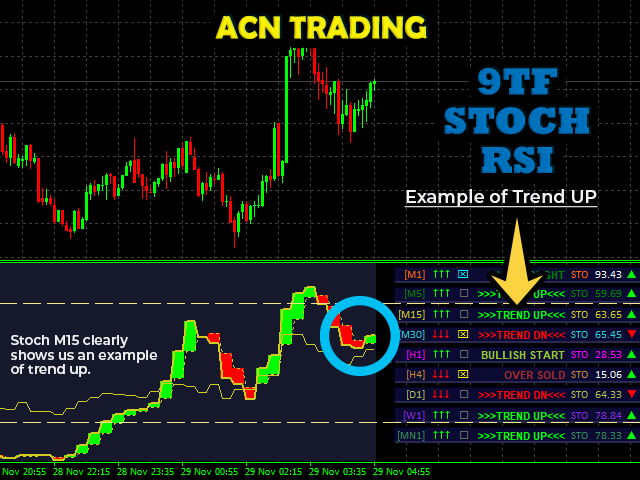
Um recurso de barra de tendência muito importante para identificar a tendência de longo prazo.
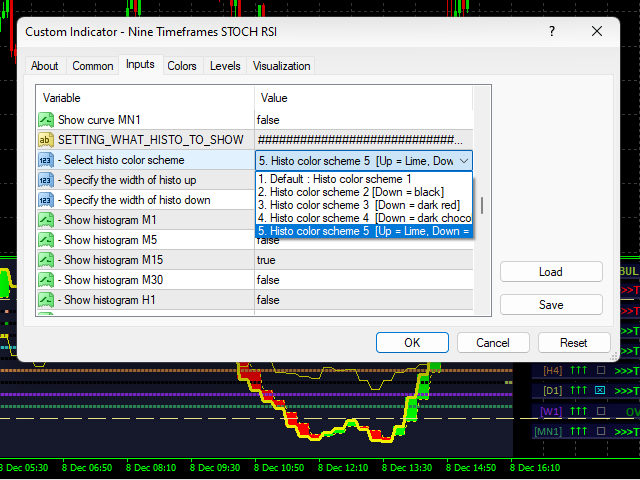
Capacidade de mudar a cor.
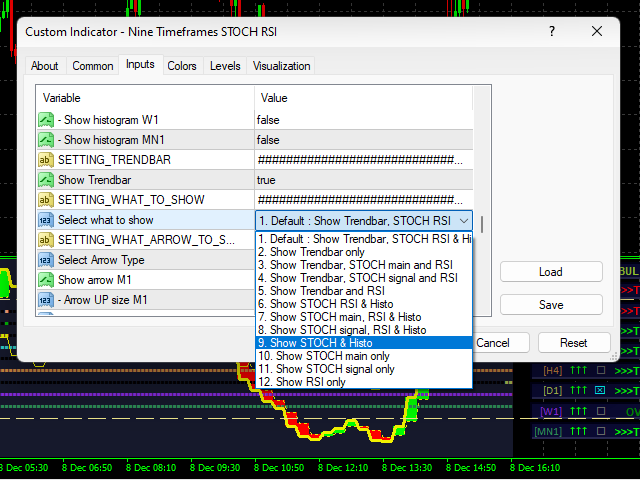
Capacidade de escolher qual curva mostrar.
Capacidade de escolher qual histograma mostrar.
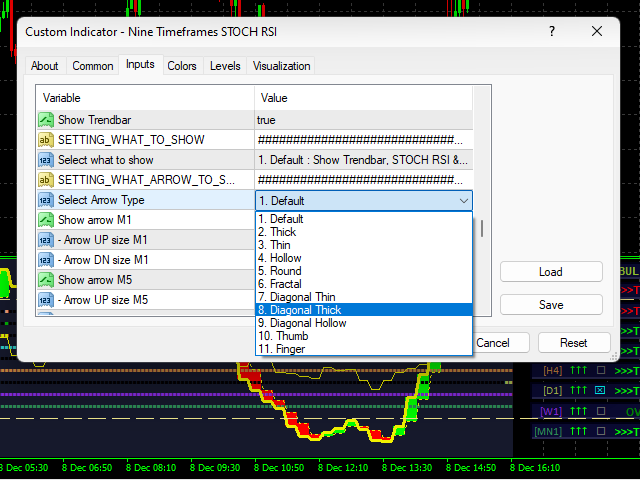
Capacidade de escolher qual seta mostrar.
Capacidade de colocar o monitor do painel 9TF no local desejado.
Capacidade de mostrar ou ocultar o indicador em apenas um botão de clique.
Capacidade de monitorar o movimento da ação do preço do período de tempo mais alto para o período de tempo menor.
Pode ser usado para analisar forex, índices, metal/energia, ações e criptomoedas.
Você pode assistir ao recurso completo no meu canal do YouTube. Nada a esconder.

Minha intenção de fazer este indicador é aumentar seus ganhos e lucros.

Faça entradas confiantes com o melhor indicador de negociação STOCH RSI.

Obtenha agora e negocie como um profissional.

Obrigada.
Produtos recomendados
Telegram Ultimate Manager MT4 Use Cases: Manager Order (open, close, modify order) Publish open and close order to Telegram Channel Open trade based on Forex Factory News Requirement: Telegram Chat ID Telegram Bot API Token Telegram Channel ID Please read the guide This tools can not be backtested Free n8n workflow template to : 1. Import Forex Factory news to Google Calendar 2. Send chat to Telegram bot about news release. Is it good or bad for the currency Inputs: Telegram Bot Token : your T
Element 8
Vladimir Deryagin
O EA trabalha com base na reversão da posição por trás da tendência. As configurações do EA são intuitivas. Você pode usar este EA em qualquer par de moedas, tendo previamente selecionado as configurações usando testes. Configurações do Expert Advisor, descrição: (Monday, Tuesday, Wednesday, Thursday, Friday, Saturday, Sunday) – a escolha do dia da semana de negociação, ou a hora naquele dia, até a qual você pode negociar. Magic - número único de transações abertas. Volume - volume de negociaç
TrendSys
Maryna Shulzhenko
Trend Sys, an indicator designed to detect trends in price movement and allows you to quickly determine the direction of the trend. The best way to trade Trend Sys is to enter the market when Trend Sys peaks and goes the other way. This is a sign of a trend reversal. I hope you enjoy this indicator and leave your comments to make it even better. Good luck and happy trading.
Ophiuchus Paid Version
Limitless Trading Enterprise
4.33 (9)
Ophiuchus is the 13th zodiac and it is also the name for this EA as   13   is the key elements for this trading strategy. Trading Strategy The following are the main characteristic of this EA. Martingale based strategy. Only open more trades when it is on the right direction. earn small profit for each trades but a lot of volume everyday. Profit from the volatility of the market. Tested and Proved to be able to profit on EURUSD trading with M1 timeframe. Back Test Result Back test result are a
HMA Multi Basket Grid EA
Oluwasegun Emmanuel Banjo
HMA Multi-Basket Grid EA (MT4) HMA Multi-Basket Grid EA is a rule-based automated trading system for MetaTrader 4 designed to manage multiple independent trade baskets using a structured grid approach. The Expert Advisor focuses on order management, basket control, and risk handling , making it suitable for traders who want an organized grid framework rather than a single-trade system. Key Features Multi-Basket Architecture Each signal opens and manages its own basket independently using
Rainbow MT4
Jamal El Alama
Rainbow MT4 is a technical indicator based on Moving average with period 34 and very easy to use. When price crosses above MA and MA changes color to green, it’s a signal to buy. When price crosses below MA and MA changes color to red, it’s a signal to sell. The Expert advisor ( Rainbow EA MT4) based on Rainbow MT4 indicator, as you can see in the short video below is now available here .
FREE
InfinityPro
Agus Wahyu Pratomo
This EA uses a multi time frame trading strategy with several indicators. So EA can analyze trends on a macro basis, then EA will analyze in a smaller time frame and decide to open a Buy or Sell position.  This EA does not use dangerous strategies such as grid strategies, averaging, martingale and other dangerous strategies. This EA uses take profit and stop loss where the stop loss uses a hidden stop loss with the help of analysis from several indicators. This EA has build in "News FIlter" to
ECNture Piranha Bar
Dimitri Nepomniachtchi
A flock of piranhas devours trading bars on the chart, collecting profits. They hunt, receive signals to act, and enter the market. They don't wait long for distant prey, resting until it's nearby or switching to a new bar and ravaging it as it rises or falls. This happens so quickly and imperceptibly on the chart, as the number of closed orders increases in the statistics window and the profit line curves upward. Your terminal may freeze, but underneath, the piranhas are actively fighting to co
DTFX Algo Zones are auto-generated Fibonacci Retracements based on market structure shifts. These retracement levels are intended to be used as support and resistance levels to look for price to bounce off of to confirm direction.   USAGE Figure 1 Due to the retracement levels only being generated from identified market structure shifts, the retracements are confined to only draw from areas considered more important due to the technical Break of Structure (BOS) or Change of Character (CHo
MACD Crossover Arrows & Alert is a MT4 (MetaTrader 4) indicator and it can be used with any forex trading systems / strategies for additional confirmation of trading entries or exits on the stocks and currencies market. This mt4 indicator provides a   BUY signal   if the MACD main line crosses above the MACD   signal  line . It also displays a   Sell signal   if the   MACD main line crosses  below the MACD   signal  line . STRATEGY Traders can use the MACD signal alerts from a higher time frame
FREE
Eurusdkiller
Nehemiah Rono
EUTUSDKILLER is a trend EA that works in all market conditions (i)It buys when the indicator confirms a trend  (ii)Sell when the same indicator confirms a down trend. (iii)Easy visual and effective trend detection. (iV)It filters and improve your trading strategies. (v) It scans previous data and give real time output. (vi) It can be set to auto calculate lots size.
A cratera binária é um indicador poderoso e versátil para MetaTrader 4, projetado especificamente para negociação de opções binárias. Funciona de forma eficaz em qualquer período de tempo e com qualquer par de moedas, tornando-se uma ferramenta extremamente flexível para os traders. Principais recursos: Análise de Tendências: O indicador determina automaticamente a tendência atual do mercado, o que ajuda os traders a entrar em negociações na direção da tendência, aumentando assim a probabilid
N Era V EA MT4
Aleksandr Zheltikov
New Era V EA  is a powerful Expert Advisor that combines DiNapoli levels and support and resistance levels for forex trading. It provides risk allocation, analyzes the market and opens positions based on the signals received from DiNapoli levels and support and resistance levels, providing traders with an excellent trading strategy. Description of Strategy Real Signal: https://www.mql5.com/en/signals/2234325 With the purchase of N Era V EA you will receive one of my EA's as a gift . So please wr
Hello, I would like to give an example of this EA. From the picture you can see that the EA can spin around 3,500 lots, when taking into account the rebate, you will get about 35,000$ and a little bit of profit during execution. The EA has actually been run as shown in the picture. **You can optimize to get the best value before actually running it.  Thankyou  Excuseme .I'm sorry that I'm not good at English. Therefore, communication may be somewhat wrong. MT5 version  :   https://www.mql5.co
Connect Indicator
Sukunthakan Ngernbamrung
Connect Indicator is a tool used for connecting indicators between the MQL market and MT4. The connected indicators are made by our group and can be used for other applications, such as sending messages to the Line application or Telegram application. If you have any questions, please don't hesitate to ask us to receive support. Function and indicator buffer Buffer one is the high price of the previous candle. Buffer two is the high price of the previous candle. Usage To connect indicators to fu
Oscillator helps determine the direction of the market Shows the direction of the price movement and is painted in the appropriate color. Allows you to conduct trend and counter trend trading It works on all timeframes, on any currency pairs, metals and cryptocurrency Can be used when working with binary options Distinctive features Does not redraw; Simple and clear settings; It works on all timeframes and on all symbols; Suitable for trading currencies, metals, options and cryptocurrency (Bitco
VarMomentPulse is a unique trading algorithm developed with precision and flexibility in mind, based on an extensive historical data cluster. Its operation is grounded in the principles of analyzing crossovers between normalized moving averages and dispersions across various time intervals, enabling it to uncover new opportunities in evaluating market trends. Key Features of the VarMomentPulse Robot: Adaptability to Volatility:The use of price dispersion analysis allows VarMomentPulse to accou
Double Trend Signals (MT4 Indicator) A powerful, non‑repainting trend‑following indicator built to deliver clean, visually intuitive Buy signals powered by smart filtering and dual‑trend confirmation layers. The Double Trend Signals indicator simplifies trend trading by combining a unique impulse‑based trend filter with two SuperTrend confirmation layers. This multi‑filter design strengthens signal quality, filters out market noise, and gives traders confidently confirmed Buy opportunities. Ev
Imperator EA
Sergei Ozerov
Imperator EA   Imperator   é um sistema de negociação moderadamente seguro baseado em um modelo de cluster de padrões de negociação. É composto por muitas funções simples e possui muitos parâmetros que permitem memorizar várias situações de mercado e interpretá-las corretamente. O EA abre uma negociação em uma determinada direção e define   Stop Loss   e   Take Profit   , e quando um certo lucro é alcançado, o EA usa   Trailing Stop   . Os sinais do modelo são baseados em indicadores como: MACD
Sunan Giri
Victor Adhitya
5 (1)
Sunan Giri EA by Victoradhitya Risk Disclosure : Futures, Forex, Stock, Crypto and Derivative trading contains substantial risk and is not for every investor. An investor could potentially lose all or more than the initial investment. I am not responsible for any financial losses you may incur by using this EA! ea uses a no martingle strategy or martingale strategy depends on your set every trade always uses a hidden SL EA has back test for 5 years Minimum balance $1000
FREE
FTC Neuro
Aliaksandr Ausiyevich
Bem - vindo ao mundo das soluções de negociação inovadoras! Apresentamos a sua atenção o nosso consultor de negociação avançado FTC Neuro , que trabalha com base em estatísticas macroeconômicas atualizadas e cálculos de redes neurais modernos. Ao analisar a situação do mercado com a ajuda de algoritmos complexos, o consultor reconhece padrões ocultos em informações econômicas usando algoritmos avançados de inteligência artificial. Ele oferece a você a experiência de negociação mais profissional
It is a secure automated market trading software. The architecture is a fully automatic autonomous expert robot capable of independently analyze the market and make trading decisions Efficient. It is an advanced and professional trading system. Requirements Supported currency pairs: CADJPY,GBPCHF,AUDJPY,USDCHF,EURCAD,EURNZD,NZDJPY; Best Pair CAD/JPY; Timeframe: H1; The EA may not be sensitive to spread and slippage. I advise you to use a good broker convenient for you; The adviser must work co
HMA Trend
Pavel Zamoshnikov
4.54 (70)
A trend indicator based on the Hull Moving Average (HMA) with two periods. The Hull Moving Average is an improved variant of the moving average, which shows the moment of trend reversal quite accurately. It is often used as a signal filter. Combination of two types of Hull Moving Averages makes a better use of these advantages: HMA with a slow period identifies the trend, while HMA with a fast period determines the short-term movements and signals in the trend direction. Features The movement d
FREE
Price Rectifier Signals
Safwan Rushdi Khalil Arekat
This indicator provides trading signals based on the polarity of the dynamical parameters of two digital signals. The dynamical parameters (momentum-acceleration) are derived by applying a high quality momentum oscillator, MTEMA LPD ( see Top Gun Oscillators ) to two digital signals. The MTEMA momentum oscillator is first applied to the price itself. Then, a rectification procedure is applied to the price based on the signals from the momentum oscillator yielding a rectified price signal. This s
FREE
Reverse copier is a tool that will open opposite buy/sell orders from your master account. It will help you with low profit EA's that lose consistenly and turn it to wins. Feel free to ask for new functions/features and I will add it. Now it's a simple MT5 to MT4 bridge with straightforward logic of one position open/close.  How to install: https://www.mql5.com/en/market/product/141604
FREE
Praetor EA
Sergei Ozerov
Praetor EA   PRAETOR   is a moderately secure trading system based on a clustering model of trading patterns. It consists of many simple functions and has many parameters that allow you to memorize various market situations and interpret them correctly. The advisor opens one deal in a certain direction and places       Stop Loss       and       Take Profit   , and when a certain profit is reached, the advisor uses       Trailing Stop   . The signals of the model are based on such indicators as:
Trendline indicator
David Muriithi
2 (1)
Are you tired of drawing trendlines every time you're analyzing charts? Or perhaps you would like more consistency in your technical analysis. Then this is for you. This indicator will draw trend lines automatically when dropped on a chart. How it works Works similar to standard deviation channel found on mt4 and mt5. It has 2 parameters: 1. Starting Bar 2. Number of bars for calculation The   starting bar   is the bar which drawing of the trend lines will begin, while the   number of bars for c
FREE
Mongol Indicator2
Sumiyabazar Buyanjargal
It's a variation of mid of HH and LL since it compares the higher of HH or LL against a period and twice the number of bars back to avoid whipsaws. I used to display this against lines on a chart, but made a histogram out of it and it looks interesting. It looks good at gauging trend strength and general turns (see image below). The name of the indicator is BAM, which is an acronym for "Below and Above Mid". Ways to use it: 1. To see general trend on longer TFs (more than 30 bars back).
Email Drawdown Alert
Roman Starostin
5 (12)
Free informative Indicator-helper. It'll be usefull for traders who trade many symbols or using grid systems (Averaging or Martingale). Indicator counts drawdown as percent and currency separate. It has a number of settings: Count deposite drawdown according equity value and send e-mail or notifications to user if DD more than set; Sending e-mail when max open orders reached; Shows price and remaining pips amount before MarginCall on current chart and Account generally; Display summary trade lot
FREE
Indicador Crypto_Forex "Histograma de Entrada de Tendência" para MT4, sem repintura. - O indicador Histograma de Entrada de Tendência pode ser usado para buscar sinais de entrada na direção da tendência assim que a barra de entrada aparecer. - Este indicador possui um recurso exclusivo: ele considera preço e volume para cálculos. - O Histograma de Entrada de Tendência pode ter duas cores: vermelho para tendência de baixa e azul para tendência de alta. - Assim que você observar uma tendência es
Os compradores deste produto também adquirem
Scalper Inside PRO
Alexey Minkov
4.74 (69)
An exclusive indicator that utilizes an innovative algorithm to swiftly and accurately determine the market trend. The indicator automatically calculates opening, closing, and profit levels, providing detailed trading statistics. With these features, you can choose the most appropriate trading instrument for the current market conditions. Additionally, you can easily integrate your own arrow indicators into Scalper Inside Pro to quickly evaluate their statistics and profitability. Scalper Inside
Dynamic Forex28 Navigator
Bernhard Schweigert
4.43 (7)
Dynamic Forex28 Navigator - A ferramenta de negociação Forex de última geração. ATUALMENTE 49% DE DESCONTO. Dynamic Forex28 Navigator é a evolução dos nossos indicadores populares de longa data, combinando o poder de três em um: Indicador Advanced Currency Strength28 (695 avaliações) + Advanced Currency IMPULSE com ALERTA (520 avaliações) + Sinais CS28 Combo (Bônus). Detalhes sobre o indicador https://www.mql5.com/en/blogs/post/758844 O que o Next-Generation Strength Indicator oferece?  Tudo
Atomic Analyst
Issam Kassas
5 (3)
Primeiramente, vale ressaltar que este Indicador de Negociação não repinta, não redesenha e não apresenta atrasos, tornando-o ideal tanto para negociação manual quanto automatizada. Manual do utilizador: configurações, entradas e estratégia. O Analista Atômico é um Indicador de Ação de Preço PA que utiliza a força e o momentum do preço para encontrar uma vantagem melhor no mercado. Equipado com filtros avançados que ajudam a remover ruídos e sinais falsos, e aumentam o potencial de negociação.
GOLD Impulse with Alert
Bernhard Schweigert
4.64 (11)
Este indicador é uma super combinação dos nossos 2 produtos Advanced Currency IMPULSE with ALERT  +   Currency Strength Exotics . Funciona para todos os períodos de tempo e mostra graficamente impulso de força ou fraqueza para as 8 principais moedas mais um Símbolo! Este Indicador é especializado para mostrar a aceleração da força da moeda para quaisquer símbolos como Ouro, Pares Exóticos, Commodities, Índices ou Futuros. É o primeiro do seu género, qualquer símbolo pode ser adicionado à 9ª
Supply and Demand Dashboard PRO
Bernhard Schweigert
4.8 (20)
Actualmente 40% OFF ! Este painel é uma peça de software muito poderosa que trabalha em múltiplos símbolos e até 9 prazos. Baseia-se no nosso principal indicador (Melhores críticas: Advanced Supply Demand ).   O tablier dá uma óptima visão geral. Mostra:   Valores filtrados da Oferta e da Procura, incluindo a classificação da força da zona, Distâncias de/para as zonas e dentro das zonas, Destaca as zonas aninhadas, Dá 4 tipos de alertas para os símbolos escolhidos em todos os (9) períodos de
Actualmente 40% OFF ! A melhor solução para qualquer novato ou comerciante especializado! Este software de painel de instrumentos está a funcionar em 28 pares de moedas. É baseado em 2 dos nossos principais indicadores (Advanced Currency Strength 28 e Advanced Currency Impulse). Dá uma grande visão geral de todo o mercado Forex. Mostra valores avançados de força da moeda, velocidade de movimento da moeda e sinais para 28 pares de divisas em todos os (9) períodos de tempo. Imagine como a sua n
Se você comprar este indicador, receberá meu Gerenciador de Operações Profissional   + EA  GRATUITAMENTE. Primeiramente, vale ressaltar que este Sistema de Trading é um Indicador Não Repintado, Não Redesenho e Não Atrasado, o que o torna ideal tanto para o trading manual quanto para o automatizado. Curso online, manual e download de predefinições. O "Sistema de Trading Inteligente MT5" é uma solução completa de trading projetada para traders novos e experientes. Ele combina mais de 10 indicador
FX Power MT4 NG
Daniel Stein
4.95 (21)
FX Power: Analise a Força das Moedas para Decisões de Negociação Mais Inteligentes Visão Geral FX Power é a sua ferramenta essencial para compreender a força real das principais moedas e do ouro em quaisquer condições de mercado. Identificando moedas fortes para comprar e fracas para vender, FX Power simplifica as decisões de negociação e revela oportunidades de alta probabilidade. Quer você prefira seguir tendências ou antecipar reversões usando valores extremos de Delta, esta ferramenta adap
Volatility Trend System - um sistema de negociação que dá sinais para entradas. O sistema de volatilidade fornece sinais lineares e pontuais na direção da tendência, bem como sinais para sair dela, sem redesenho e atrasos. O indicador de tendência monitora a direção da tendência de médio prazo, mostra a direção e sua mudança. O indicador de sinal é baseado em mudanças na volatilidade e mostra entradas no mercado. O indicador está equipado com vários tipos de alertas. Pode ser aplicado a vários i
El indicador "MR BEAST ALERTAS DE LIQUIDEZ" es una herramienta avanzada diseñada para proporcionar señales y alertas sobre la liquidez del mercado basándose en una serie de indicadores técnicos y análisis de tendencias. Ideal para traders que buscan oportunidades de trading en función de la dinámica de precios y los niveles de volatilidad, este indicador ofrece una visualización clara y detallada en la ventana del gráfico de MetaTrader. Características Principales: Canal ATR Adaptativo: Calcula
RFI levels PRO
Roman Podpora
5 (1)
O indicador mostra com precisão os pontos de reversão e as zonas de retorno de preço onde o   Principais players . Você identifica onde novas tendências estão se formando e toma decisões com máxima precisão, mantendo o controle sobre cada negociação. VERSION MT5     -     Revela seu potencial máximo quando combinado com o indicador   TREND LINES PRO. O que o indicador mostra: Estruturas de reversão e níveis de reversão com ativação no início de uma nova tendência. Exibição dos níveis de   TAKE
PZ Harmonacci Patterns
PZ TRADING SLU
3.17 (6)
Este é sem dúvida o indicador de reconhecimento automático de formação de preço harmônico mais completo que você pode encontrar para a MetaTrader Platform. Ele detecta 19 padrões diferentes, leva as projeções de Fibonacci tão a sério quanto você, exibe a Zona de Reversão Potencial (PRZ) e encontra níveis adequados de stop loss e take-profit. [ Guia de instalação | Guia de atualização | Solução de problemas | FAQ | Todos os produtos ] Detecta 19 formações harmônicas de preços diferentes Traça
Weis Wave with Alert
Trade The Volume Waves Single Member P.C.
4.82 (22)
Rental/Lifetime Package Options and Privileges' Rent Monthly Six Months   Yearly/Lifetime Weis Wave with Speed with Alert+Speed Index x x x Manual  x x x Quick Set up Video x x x Blog x x x Lifetime Updates x x x Setup and Training Material x x Rectangle Break Alert Tool      x Discord Access Channel "The SI traders" x   How to trade info visit:    http://www.tradethevolumewaves.com   ** If you purchase please contact me to setup your  : training Room and  complete manual access.  This is
Um indicador técnico que estrutura gráficos e identifica movimentos cíclicos de preços. Pode funcionar em qualquer gráfico. Vários tipos de notificações. Existem setas adicionais no próprio gráfico. Sem redesenhar a história, trabalha no fecho da vela. TF recomendado a partir de M5 e superior. Parâmetros fáceis de utilizar e configurar. Ao utilizar 2 indicadores com parâmetros diferentes, pode utilizá-los sem outros indicadores. Tem 2 parâmetros de entrada Ciclicidade e duração do sinal Estes
Advanced Supply Demand
Bernhard Schweigert
4.91 (299)
Atualmente com 40% de desconto! A melhor solução para qualquer Trader Novato ou especialista! Este indicador é uma ferramenta de negociação exclusiva, de alta qualidade e acessível porque incorporamos uma série de recursos proprietários e uma nova fórmula. Com esta atualização, você poderá mostrar fusos horários duplos. Você não só será capaz de mostrar um TF mais alto, mas também mostrar ambos, o TF do gráfico, MAIS o TF mais alto: MOSTRANDO ZONAS ANINHADAS. Todos os traders de Oferta e Demanda
Trend Lines PRO
Roman Podpora
5 (1)
LINHAS DE TENDÊNCIA PRO       Ajuda a entender onde o mercado está realmente mudando de direção. O indicador mostra inversões de tendência reais e pontos onde os principais participantes retornam ao mercado. Você vê     Linhas BOS     Análise de tendências e níveis-chave em prazos maiores — sem configurações complexas ou ruídos desnecessários. Os sinais não são repintados e permanecem no gráfico após o fechamento da barra. VERSÃO MT 5      -      Revela seu potencial máximo quando emparelhada co
Currency Strength Exotics
Bernhard Schweigert
4.88 (33)
ACTUALMENTE 20% DE DESCONTO ! A melhor solução para qualquer novato ou comerciante especializado! Este Indicador é especializado para mostrar a força da moeda para quaisquer símbolos como Pares Exóticos de Commodities, Índices ou Futuros. É o primeiro do seu género, qualquer símbolo pode ser adicionado à 9ª linha para mostrar a verdadeira força da moeda de Ouro, Prata, Petróleo, DAX, US30, MXN, TRY, CNH etc. Esta é uma ferramenta de negociação única, de alta qualidade e acessível, porque inco
No Repaint Bext
Andrey Kozak
1 (1)
No Repaint Bext is a ready-made trading system. Shows when to open and when to close trades, as well as in which direction. Every time a green arrow appears, you need to open a buy trade. Close all buy trades when a red arrow appears. The same goes for the opposite direction, every time a red arrow appears, open sell trades and close them all when a green arrow appears. We use the M5 timeframe for trading. You can trade on any cozy pair. This indicator does not repaint and practically does not
Are you looking for a simple and reliable indicator that can help you spot market swing points easily? Do you want clear buy and sell signals that work on any timeframe and any trading instrument? Buy Sell Signal Pro is designed to do exactly that. It helps traders identify important market turning points and understand the current market structure in a clear and easy way. This indicator detects Higher Highs (HH), Higher Lows (HL), Lower Highs (LH), and Lower Lows (LL) so you can quickly see wh
Super Signal – Skyblade Edition Sistema profissional de sinais de tendência sem repintar / sem atraso com taxa de acerto excepcional | Para MT4 / MT5 Funciona melhor em timeframes mais curtos, como 1 minuto, 5 minutos e 15 minutos. Principais características: Super Signal – Skyblade Edition é um sistema inteligente de sinais desenvolvido especificamente para operações com tendência. Utiliza uma lógica de filtragem em múltiplas camadas para detectar apenas movimentos direcionais fortes sustenta
Smc Blast Signal
Mohit Dhariwal
3.4 (5)
OFFER OFFER! The price of the indicator is kept at 75 dollars only from 20th Feb to 28th Feb. Full Fledged EA and Alert plus for alerts will also be provided in this offer along with the purchase of Indicator. Limited copies only at this price and Ea too. Grab your copy soon Alert plus for indicator with set file is kept in comment section with the image  SMC Blast Signal with FVG, BOS and trend Breakout The SMC Blast Signal is a Precise trading system for Meta Trader 4 that uses Smart Money Con
PipFinite Volume Critical
Karlo Wilson Vendiola
4.61 (28)
Volume Gives Depth To Price Action! Volume Critical can accurately locate the cheapest areas to place trades. Enter reversals as early as possible to get the best Risk Reward setups! Features Aggressive algorithm that anticipates reversals Volume Classifications Gray Histograms - Normal Volume, average market activity Orange Histogram - Trending Volume, increased market activity Pink Histograms - Overbought Volume, we can wait for further confirmation to sell Blue Histograms - Oversold Conditio
Indicador de gestão de risco e monitoramento de limites para traders profissionais e contas de avaliação (Prop) Esta ferramenta apenas exibe, no gráfico, informações precisas de gestão de risco e limites, ajudando você a decidir com mais foco. O indicador não abre/fecha/modifica ordens e não interfere com Expert Advisors (EAs). Recursos Monitoramento do drawdown diário e total Calcula e exibe o drawdown diário e total com base no Saldo (Balance) ou no Patrimônio (Equity) (configurável). Mostra
CRT Multi-Timeframe Market Structure & Liquidity Sweep Indicator Non-Repainting | Multi-Asset | MT5 Version Available MT5 Version:   https://www.mql5.com/en/market/product/162075 Full User Guide — explains what each feature does and why:   https://www.mql5.com/en/blogs/post/767525 Quick Start User Guide  — explains how to configure and in what order:  https://www.mql5.com/en/blogs/post/767540 Indicator Overview CRT Ghost Candle HTF Fractal is a complete institutional-grade market structure too
ACTUALMENTE COM 40% DE DESCONTO A melhor solução para qualquer novato ou comerciante especializado! Este Indicador é uma ferramenta comercial única, de alta qualidade e acessível, porque incorporámos uma série de características proprietárias e uma nova fórmula. Com apenas UM gráfico, pode ler a força da moeda para 28 pares de Forex! Imagine como a sua negociação irá melhorar porque é capaz de apontar o ponto exacto do gatilho de uma nova tendência ou oportunidade de escalada? Manual do util
Indicador Miraculous – Ferramenta 100% Não Repintável para Forex e Opções Binárias Baseada no Quadrado de Nove de Gann Este vídeo apresenta o Indicador Miraculous , uma ferramenta de negociação altamente precisa e poderosa, desenvolvida especificamente para traders de Forex e Opções Binárias . O que torna este indicador único é a sua base no lendário Quadrado de Nove de Gann e na Lei da Vibração de Gann , tornando-o uma das ferramentas de previsão mais precisas disponíveis na negociação moderna.
Cumulative Delta Pro
Stanislav Konin
5 (1)
Cumulative Delta Pro is a professional indicator that takes market order flow analysis to a fundamentally new level. Cumulative Delta is the difference between buying and selling volumes, presented as a continuous cumulative sum over a specific period of time starting from the initial calculation point. This metric allows traders to see in real time who controls the market: if the positive delta increases, it indicates the dominance of active buyers; if the negative delta decreases, sellers are
Looking for a powerful yet lightweight swing detector that accurately identifies market structure turning points? Want clear, reliable buy and sell signals that work across any timeframe and any instrument? Buy Sell Arrow MT Swing is built exactly for that — precision swing detection made simple and effective. This indicator identifies Higher Highs (HH) , Higher Lows (HL) , Lower Highs (LH) , and Lower Lows (LL) with remarkable clarity. It is designed to help traders easily visualize market stru
PairMaster Buy Sell Arrow Indicator for MT4 Trade Reversals Like a Pro — Catch Every Swing Point with Precision The PairMaster Buy Sell Arrow Indicator is a powerful MetaTrader 4 tool built to identify high-probability swing trading opportunities . Designed for traders who value accuracy, clarity, and simplicity, PairMaster detects key market turning points and plots intuitive buy and sell arrows directly on your chart. Key Features Accurate Swing Point Detection – Automatically identifies ma
Gold PL MTF - este é um excelente indicador técnico de ações. O algoritmo do indicador analisa o movimento do preço do ativo e reflete automaticamente os Níveis de Pivot importantes do período de tempo especificado (TF) utilizando o método de Fibonacci (secção áurea). O indicador descreve perfeitamente a trajetória de preços do período selecionado (dia, semana, mês, ano), determina o início de uma tendência e o início de uma correção, que pode evoluir para uma tendência oposta. O indicador mo
Mais do autor
Analyzing multiple time frames of a currency pair in one window can make you confused. To analyze multiple time frames, you need reliable indicators. One of them is using 9TF RSI MA . I've been working day and night to create code that is simple but reliable and covers all nine time frames in just one indicator .  Let's look at some of the advantages of this indicator: Colorful histogram . The color of the curve in each timeframe is different from one another.  Arrows indicating the crossing of
Analisar vários intervalos de tempo de um par de moedas em uma janela pode deixá-lo confuso. Para analisar vários intervalos de tempo, você precisa de indicadores confiáveis. Um deles está usando 9TF Double RSI Double MA. Tenho trabalhado dia e noite para criar um código simples, mas confiável, que cubra todos os nove intervalos de tempo em apenas um indicador. Vejamos algumas das vantagens deste indicador: RSI duplo, ou seja, RSI mais rápido e RSI mais lento. MA duplo, ou seja, MA mais rá
Analisar vários intervalos de tempo de um par de moedas em uma janela pode deixá-lo confuso. Para analisar vários intervalos de tempo, você precisa de indicadores confiáveis. Um deles está usando 9TF Double CCI Double MA. Tenho trabalhado dia e noite para criar um código simples, mas confiável, que cubra todos os nove intervalos de tempo em apenas um indicador. Vejamos algumas das vantagens deste indicador: CCI duplo, ou seja, CCI mais rápido e CCI mais lento. MA duplo, ou seja, MA mais rá
Um indicador CCI preciso está disponível. Dashboard Trend Bar Smart Level 9TF Double CCI. CCI duplo, ou seja, CCI rápido e CCI lento Por que você precisa do segundo CCI? O uso de indicadores adicionais nos convencerá mais na negociação ao vivo Curva CCI rápida 9TF Curva CCI lenta 9TF Ângulo CCI em tempo real 9TF 9TF valor CCI em tempo real Direção/fase CCI em tempo real 9TF Barra de tendência 9TF Novo algo no cálculo da barra de tendências Botão ligar / desligar. Muito útil para mostrar/oculta
Um indicador RSI preciso está disponível. Dashboard Trend Bar Smart Level 9TF Double RSI. RSI duplo, ou seja, RSI rápido e RSI lento Por que você precisa do segundo RSI? O uso de indicadores adicionais nos convencerá mais na negociação ao vivo Curva RSI rápida 9TF Curva RSI lenta de 9TF Ângulo RSI em tempo real 9TF Valor do RSI em tempo real de 9TF Direção/fase do RSI em tempo real 9TF Barra de tendência 9TF Novo algo no cálculo da barra de tendências Botão ligar / desligar. Muito útil para mo
Um indicador MACD preciso está disponível. Dashboard Trend Bar Smart Level 9TF Double MACD. MACD duplo, ou seja, rápido (MACD 1) e lento (MACD 2) Por que você precisa do segundo MACD? O uso de indicadores adicionais nos convencerá mais na negociação ao vivo 9TF Fast MACD 1 curva Curva MACD 2 lenta 9TF 9TF ângulo MACD em tempo real 9TF valor MACD em tempo real Direção MACD em tempo real 9TF Um indicador MACD preciso está disponível. Dashboard Trend Bar Smart Level 9TF Double MACD. MACD duplo,
Um indicador estocástico preciso está disponível. Dashboard Trend Bar Smart Level 9TF Dual Stochastic. Dual Stochastic, ou seja, Fast Stochastic e Slow Stochastic Por que você precisa do segundo estocástico? O uso de indicadores adicionais nos convencerá mais na negociação ao vivo Curva Estocástica Rápida 9TF Curva Estocástica Lenta 9TF 9TF ângulo estocástico em tempo real 9TF valor estocástico em tempo real 9TF direção/fase estocástica em tempo real Barra de tendência 9TF Novo algo no cálculo
Se você costuma perder negociações porque usa apenas um indicador, experimente esta ferramenta de negociação. Esta ferramenta de negociação utiliza mais de um indicador. Costumo observar traders que usam apenas o indicador RSI. Muitas vezes o mercado está sobrevendido, mas ainda em baixa, ou o mercado está sobrecomprado, mas ainda em alta. Por esse motivo, é necessário utilizar mais de um indicador. Apresentando a nova versão V 3.40 MTF PPAAF: Multi Time Frame Precise Price Action Arrow Filtere
[V 1.00] O MTF NRPA 5 Moving Average RTD foi lançado! Painel em tempo real de seta sem repintura. Se você está procurando o melhor indicador de média móvel, está na página certa. Geralmente as pessoas instalarão duas médias móveis porque a interseção das duas médias móveis (o cruzamento) determinará a direção da próxima tendência de preço. Se a média móvel rápida cruzar com a média móvel lenta e rápido > lento, a tendência é de alta. Por outro lado, se a média móvel rápida cruzar com a média
[V 1.00] MTF NRPA 5 RSI RTD foi lançado! Painel em tempo real de seta sem repintura. Se você está cansado de usar vários indicadores RSI, mas acha que eles são imprecisos, tente esta ferramenta. Normalmente, as pessoas instalam apenas 1 RSI para determinar o nível de OBOS em um período de tempo. A má notícia é que você não pode ver os níveis e tendências do OBOS em vários períodos de tempo ao mesmo tempo. É por isso que desenvolvi esta ferramenta de negociação. Veja como é explicado: Nesta
Introducing the advanced trading tools of 2023. MTF PPAAF Model S. This is sub window version of my best trading tool : MTF Precise Price Action Arrow Filtered.  Click here to learn more about MTF PPAAF . This trading tool is equipped with various powerful features : MTF = Multi Time Frame = Time Frame can be changed. On/off button. Non Repaint Arrows.  Customizable parameter, color etc.  Can show all time frame (ATF) crossover arrows of fast stochastic main line & fast stochastic signal line (
If you are curious about the position of the stochastic, RSI, CCI curve, whether it is at the OBOS level or not, then this trading tool is for you. Introducing the advanced trading tools of 2024. ATF Trend Following Trend Bar OBOS. This indicator is similar to MTF PPAAF Model S but have two layers.  Click here to learn more about MTF PPAAFS . This trading tool is equipped with various powerful features : MTF = Multi Time Frame = Time Frame can be changed. On/off button. Customizable parameter,
Olá comerciantes. Apresentando minha melhor ferramenta de negociação. FTM PPAAF Modelo T. Multi Time Frame Seta de ação de preço precisa filtrada Modelo T.  Esta ferramenta de negociação é meu melhor trabalho depois de anos criando várias ferramentas de negociação. Por que esta ferramenta de negociação é a melhor e confiável?  1. Esta ferramenta utiliza 6 indicadores:  CCI duplo = CCI rápido x CCI lento Estocástico duplo = estocástico rápido (linha principal estocástica rápida x lin
Com esta ferramenta de negociação, você pode analisar 15 mercados simultaneamente. Apresentando o novo indicador de negociação 2024: ️ Painel Estocástico Multi Moeda Multi Time Frame. Há pelo menos duas razões pelas quais criei esta ferramenta de negociação: Primeiro, estou cansado de observar apenas um mercado. Segundo, não quero perder o momento de entrada em outro mercado. É por isso que quero conhecer outras condições de mercado ao mesmo tempo. Por esta razão, preciso de um scanner q
Com esta ferramenta de negociação, você pode analisar 15 mercados simultaneamente. Apresentando o novo indicador de negociação 2024: ️ Dashboard Multi Moeda Multi Time Frame Double CCI. Há pelo menos duas razões pelas quais criei esta ferramenta de negociação: Primeiro, estou cansado de observar apenas um mercado. Segundo, não quero perder o momento de entrada em outro mercado. É por isso que quero conhecer outras condições de mercado ao mesmo tempo. Por esta razão, preciso de um scanner
Com esta ferramenta de negociação, você pode analisar 15 mercados simultaneamente. Apresentando o novo indicador de negociação 2024: ️ Dashboard Multi Moeda Multi Time Frame Double RSI. Há pelo menos duas razões pelas quais criei esta ferramenta de negociação: Primeiro, estou cansado de observar apenas um mercado. Segundo, não quero perder o momento de entrada em outro mercado. É por isso que quero conhecer outras condições de mercado ao mesmo tempo. Por esta razão, preciso de um scanner
Looking for a trading tool based on the CCI indicator that can display crossovers arrows on all time frames? Introducing trading indicator : All Time Frame Double CCI Model T ready to help you achieve daily profits. This tool is created using the intersection of two CCI (Double CCI) indicator lines: the main CCI and the signal CCI. Using this tool makes it easier to observe the real-time dashboard and intersections of multiple timeframes simultaneously. Viewing both higher and lower timeframes
Looking for a trading tool based on the CCI indicator that can display crossovers arrows on all time frames? Introducing trading indicator : All Time Frame Double CCI Model S ready to help you achieve daily profits. This tool is created using the intersection of two CCI (Double CCI) indicator lines: the main CCI and the signal CCI. Using this tool makes it easier to observe the real-time dashboard and intersections of multiple timeframes simultaneously. Viewing both higher and lower timeframes
Looking for a trading tool based on the MACD indicator that can display crossovers arrows on all time frames? Introducing trading indicator : All Time Frame MACD Model T ready to help you achieve daily profits. This tool is created using the intersection of two indicator lines of MACD : the main MACD and the signal MACD. Using this tool makes it easier to observe the real-time dashboard and intersections of multiple timeframes simultaneously. Viewing both higher and lower timeframes simultaneou
Looking for a trading tool based on the MACD indicator that can display crossovers arrows on all time frames? Introducing trading indicator : All Time Frame MACD Model S ready to help you achieve daily profits. This tool is created using the intersection of two indicator lines of MACD : the main MACD and the signal MACD. Using this tool makes it easier to observe the real-time dashboard and intersections of multiple timeframes simultaneously. Viewing both higher and lower timeframes simultaneou
Looking for a trading tool based on the Stochastic indicator that can display crossovers arrows on all time frames? Introducing trading indicator : All Time Frame Stochastic Model T ready to help you achieve daily profits. This tool is created using the intersection of two indicator lines of Stochastic  : the main Stochastic  and the signal Stochastic . Using this tool makes it easier to observe the real-time dashboard and intersections of multiple timeframes simultaneously. Viewing both higher
Looking for a trading tool based on the Stochastic indicator that can display crossovers arrows on all time frames? Introducing trading indicator : All Time Frame Stochastic Model S ready to help you achieve daily profits. This tool is created using the intersection of two indicator lines of Stochastic  : the main Stochastic and the signal Stochastic . Using this tool makes it easier to observe the real-time dashboard and intersections of multiple timeframes simultaneously. Viewing both higher
Looking for a trading tool based on the RSI indicator that can display crossovers arrows on all time frames? Introducing trading indicator : All Time Frame Double RSI Model T ready to help you achieve daily profits. This tool is created using the intersection of two RSI (Double RSI) indicator lines: the main RSI and the signal RSI. Using this tool makes it easier to observe the real-time dashboard and intersections of multiple timeframes simultaneously. Viewing both higher and lower timeframes
Looking for a trading tool based on the RSI indicator that can display crossovers arrows on all time frames? Introducing trading indicator : All Time Frame Double RSI Model S ready to help you achieve daily profits. This tool is created using the intersection of two RSI (Double RSI) indicator lines: the main RSI and the signal RSI. Using this tool makes it easier to observe the real-time dashboard and intersections of multiple timeframes simultaneously. Viewing both higher and lower timeframes
Looking for a trading tool based on the moving average indicator that can display crossovers arrows on all time frames? Introducing trading indicator : All Time Frame Two MA Model T ready to help you achieve daily profits. This tool is created using the intersection of two moving average  indicator lines: the main MA1 and the signal MA2. Using this tool makes it easier to observe the real-time dashboard and intersections of multiple timeframes simultaneously. Viewing both higher and lower timef
Looking for a trading tool based on the moving average indicator that can display crossovers arrows on all time frames? Introducing trading indicator : All Time Frame Two MA Model S ready to help you achieve daily profits. This tool is created using the intersection of two moving average indicator lines: the main MA1 and the signal MA2. Using this tool makes it easier to observe the real-time dashboard and intersections of multiple timeframes simultaneously. Viewing both higher and lower timefr
Filtro:
Sem comentários
Responder ao comentário